
The last picks have been made. Thank you for the numerous symbol requests. The email group had plenty of symbols flying around and then I had two subscribers send separate requests.
Two subscribers sent in UBER so I decided that I needed to cover that one. The other two are very interesting and do have some excellent upside potential. It is a long list, but I'm going to put down all of the symbols that have been talked about this week.
I decided I wanted to impart a little advice on annotations. I believe the most important annotations are support/resistance lines. Forget the chart patterns and rising/falling trends, always put in support/resistance first! Price will adhere to these levels better than anything else. This was advice that I received from Greg Morris. He says trendlines are fairly useless (I do disagree there) and that the most important levels are support/resistance.
I'll see you in the Diamond Mine trading room tomorrow morning! The final recap will go out tomorrow along with the final DP Weekly/Monthly Wrap. I can't believe we're at the end already. Thank you for all of your support!
Good Luck & Good Trading,
Erin
Today's "Diamonds in the Rough": OCUL, SMCI and UBER.
Other requests: FNDE, HIMX, ING, NGG, NVDA, PAGS, GOOG, CAT, NEM, SNOW, SYM, SOFI, NU, NET, MNDY, CRWD, ZS, DDOG, IBM, OLLI, PAG, NTRA, LYV, MO, NN, FALN, ROKU, CALM and ARM.

Diamond Mine Trading Room:
RECORDING & DOWNLOAD LINK (6/20/2025):
Topic: DecisionPoint Diamond Mine (6/20/2025) LIVE Trading Room
Download & Recording LINK
Passcode: June#20th
REGISTRATION for 6/27/2025:
When: June 27, 2025 09:00 AM Pacific Time (US and Canada)
Topic: DecisionPoint Diamond Mine LIVE Trading Room
Register in advance for this webinar HERE
After registering, you will receive a confirmation email containing information about joining the webinar.
Welcome to DecisionPoint Diamonds, wherein I highlight ten "Diamonds in the Rough" per week. These are selected from the results of my DecisionPoint Scans which search for stocks that could benefit from the trend and condition of the market. Remember, these are not recommendations to buy or sell, but are the most interesting of the stocks that surfaced in my scans. My objective is to save you the work of the initial, tedious culling process, but you need to apply your own analysis to see if these stocks pique your interest as well. There are no guaranteed winners here!
"Predefined Scans Triggered" are taken from StockCharts.com using the "Symbol Summary" option instead of a "SharpChart" on the workbench.
Stop levels are all rounded down.
Ocular Therapeutix Inc. (OCUL)
EARNINGS: 2025-08-06 (BMO)
Ocular Therapeutix, Inc. is a biopharmaceutical company, which engages in the development and commercialization of therapies for diseases and conditions of the eye. Its product pipeline includes Dextenza, OTX-TP, and OTX-TIC. The company was founded by Amarpreet S. Sawhney and Farhad Khosravi on September 12, 2006 and is headquartered in Bedford, MA.
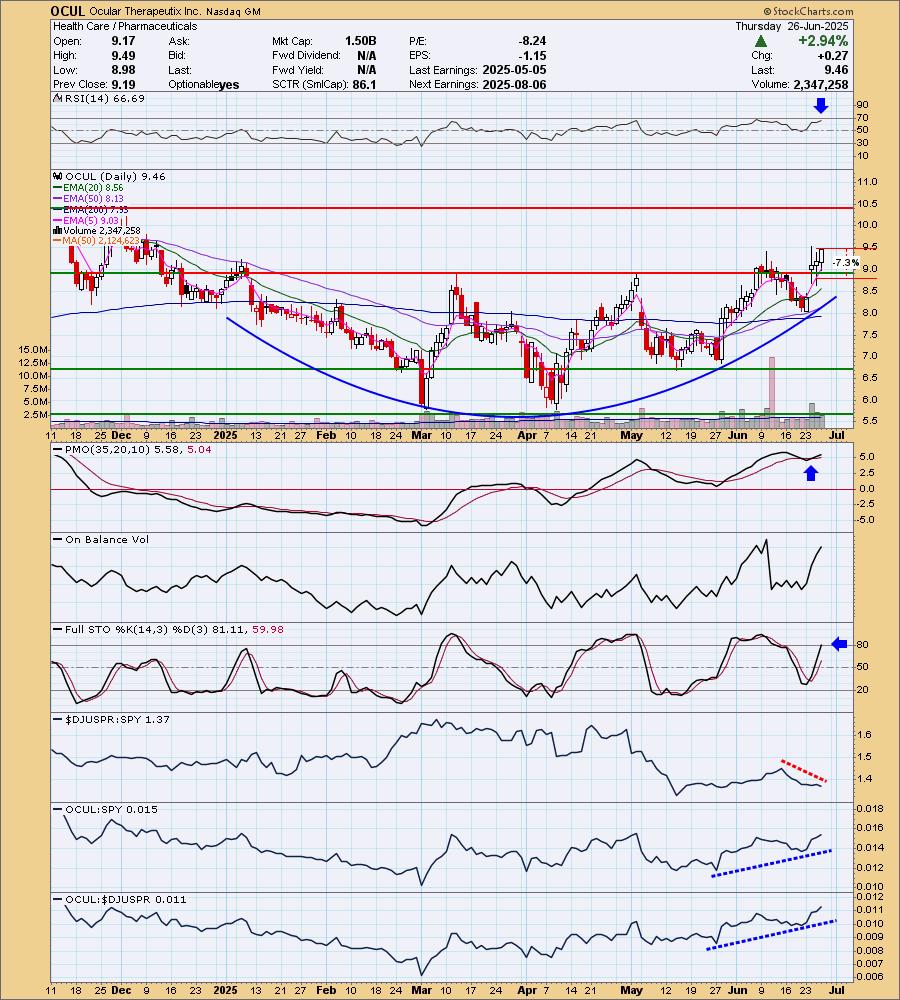
Predefined Scans Triggered: Moved Above Upper Bollinger Band, P&F Double Top Breakout and P&F Triple Top Breakout.
OCUL is up +0.42% in after-hours trading. I liked the big base on the rounded bottom combined with the breakout from the base. The RSI is positive and not overbought. The PMO has whipsawed into a Crossover BUY Signal well above the zero line. Stochastics just moved above 80. The group isn't outperforming yet, but OCUL is doing very well against the group and the SPY so I went ahead and picked it anyway. The stop is set beneath support at 7.3% or $8.76.
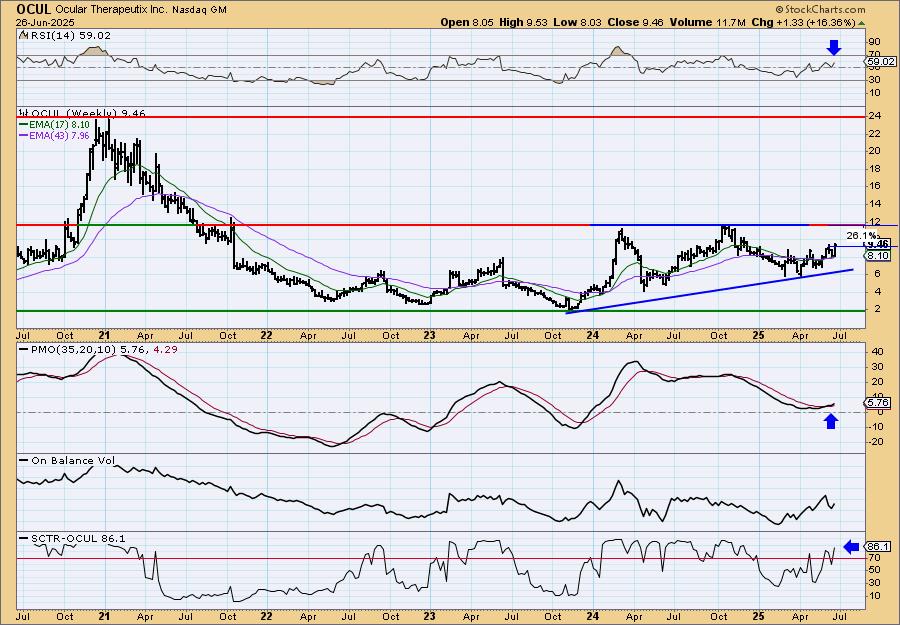
There is plenty of upside potential here. There is a large bullish ascending triangle. Even if price just makes it to the top of the pattern it would be an excellent gain, but this chart pattern suggests it could even break out from there. The weekly RSI is positive and the weekly PMO is rising on a new Crossover BUY Signal that occurred above the zero line. The StockCharts Technical Rank (SCTR) is well within the hot zone*.
*If a stock is in the "hot zone" above 70, it implies that it is stronger than 70% of its universe (large-, mid-, small-caps and ETFs) primarily in the intermediate to long terms.
Super Micro Computer, Inc (SMCI)
EARNINGS: 2025-08-12 (AMC)
Super Micro Computer, Inc. engages in the distribution and manufacture of information technology solutions and other computer products. Its products include twin solutions, MP servers, GPU and coprocessor, MicroCloud, AMD solutions, power supplies, SuperServer, storage, motherboards, chassis, super workstations, accessories, SuperRack and server management products. The company was founded by Charles Liang, Yih-Shyan Liaw, Sara Liu, and Chiu-Chu Liu Liang in September 1993 and is headquartered in San Jose, CA.
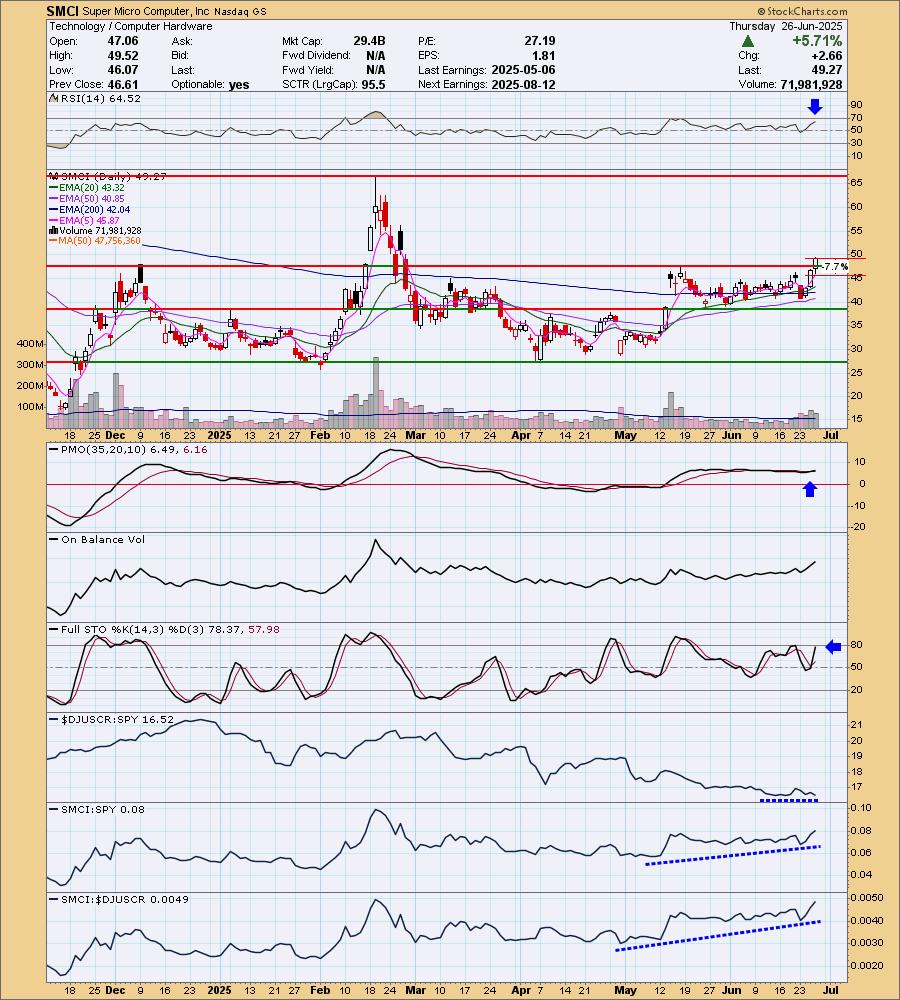
Predefined Scans Triggered: P&F Ascending Triple Top Breakout, P&F Bullish Catapult, P&F Double Top Breakout and Moved Above Upper Keltner Channel.
SMCI is down -0.08% in after-hours trading. It was the breakout that got me on this one combined with incredible upside potential that you'll see on the weekly chart. It is a little risky as the market could turn over now that we've come to all-time highs so adhere to your stop. The RSI is positive and not overbought. The PMO is flat above the signal line so there is strength. The OBV is starting to curl up with price. Stochastics are nearly above 80. The group is performing in line with the SPY which is acceptable. SMCI however, is outperforming both the group and the SPY. The stop is set arbitrarily at 7.7% or $45.47.
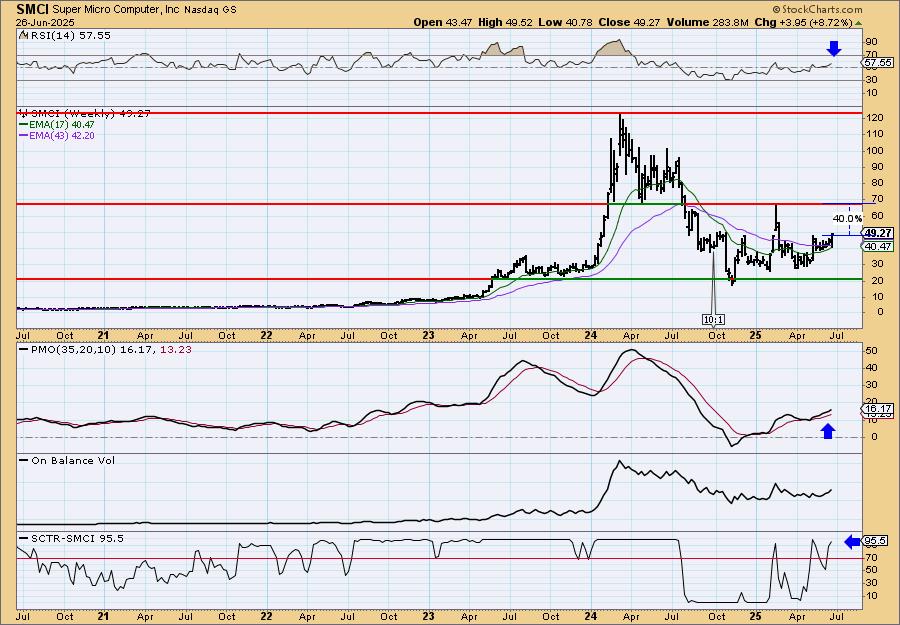
We have a nice bounce that occurred above support and a new rising trend. It looks very much like a rounded bottom. The weekly RSI is positive and not at all overbought. The weekly PMO is rising above the zero line on a Crossover BUY Signal. The SCTR is at the top of the hot zone.
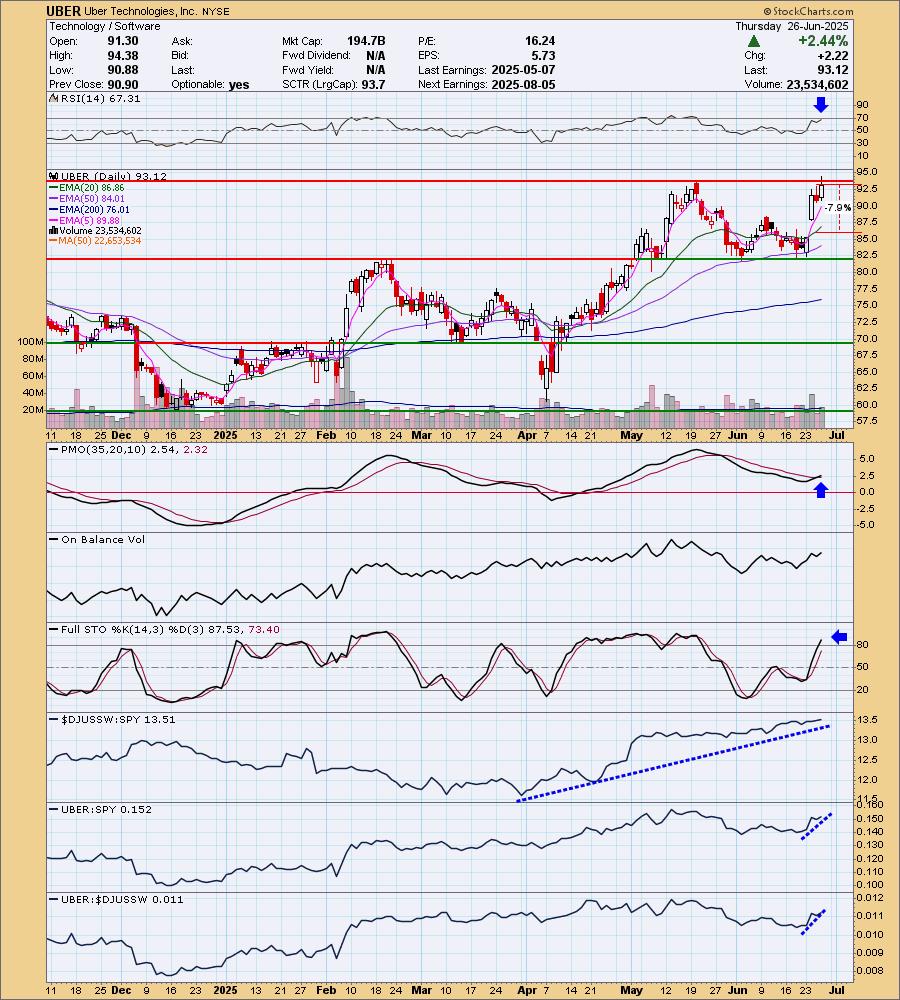
Uber Technologies, Inc. (UBER)
EARNINGS: 2025-08-05 (BMO)
Uber Technologies, Inc. is a technology platform, which engages in the development and operation of technology applications, networks, and product to power movement from point A to point B. The firm offers ride services and merchants delivery service providers for meal preparation, grocery, and other delivery services. It operates through the following segments: Mobility, Delivery, and Freight. The Mobility segment refers to products that connect consumers with Mobility Drivers who provide rides in a variety of vehicles, such as cars, auto rickshaws, motorbikes, minibuses, or taxis. The Delivery segment offers consumers the chance to search for and discover local restaurants, order a meal, and either pick-up at the restaurant or have the meal delivered. The Freight segment focuses on connecting Carriers with Shippers on its platform, and gives Carriers upfront, transparent pricing, and the ability to book a shipment. The company was founded by Oscar Salazar Gaitan, Travis Kalanick, and Garrett Camp in 2009 and is headquartered in San Francisco, CA.
Predefined Scans Triggered: Stocks in a New Uptrend (Aroon), Moved Above Upper Price Channel, P&F Double Top Breakout, Moved Above Upper Keltner Channel and New 52-week Highs.
UBER is up +0.03% in after-hours trading. I wish this had a breakout already. We did see a double bottom, but that has essentially reached its upside target. It does look ready to breakout though given the indicators. The RSI is positive and not overbought yet. The PMO is on a recent Crossover BUY Signal. Stochastics are rising above 80. Relative strength for the group is fantastic. UBER is just now starting to see some outperformance. The stop is set beneath the 20-day EMA at 7.9% or $85.76.
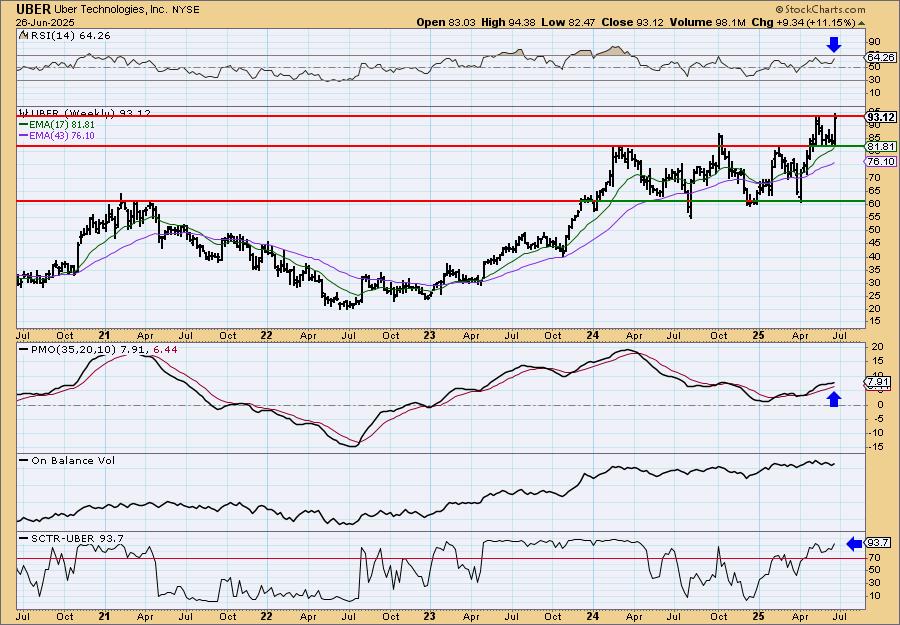
It is in the process of hitting new all-time highs on a breakout from a trading range. The weekly RSI is positive and not overbought. The weekly PMO is rising on a Crossover BUY Signal above the zero line. The SCTR is well within the hot zone. Consider a 17% upside target to about $108.95.
Don't forget, on Thursdays I look at reader-requested symbols, click HERE to send me an email. I read every email I receive and try to answer them all!
Current Market Outlook:
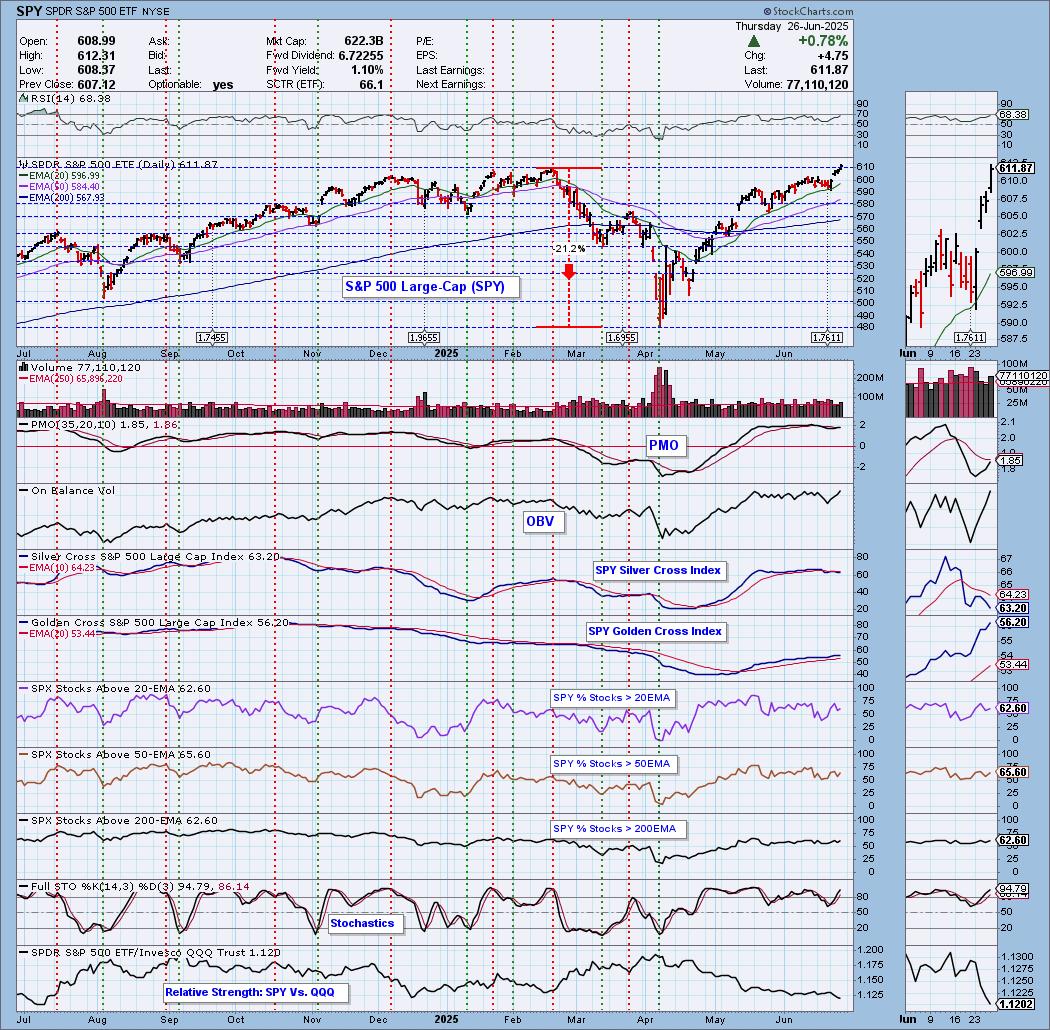
Market Environment: It is important to consider the odds for success by assessing the market tides. The following chart uses different methodologies for objectively showing the depth and trend of participation for intermediate- and long-term time frames.
- The Silver Cross Index (SCI) shows the percentage of SPX stocks on IT Trend Model BUY signals (20-EMA > 50-EMA)
- The Golden Cross Index (GCI) shows the percentage of SPX stocks on LT Trend Model BUY signals (50-EMA > 200-EMA)
Don't forget that as a "Diamonds" member, you have access to our "Under the Hood" curated ChartList on DecisionPoint.com. You'll find it under "Members Only" links on the left side on the Blogs and Links Page.
Here is the current chart:
Full Disclosure: I am 50% long, 0% short.
I'm required to disclose if I currently own a stock I mention and/or may buy/short it within the next 72 hours.
"Technical Analysis is a windsock, not a crystal ball." - Carl Swenlin
(c) Copyright 2025 DecisionPoint.com
NOTE: The stocks reported herein are from mechanical trading model scans that are based upon moving average relationships, momentum and volume. DecisionPoint analysis is then applied to get five selections from the scans. The selections given should prompt readers to do a chart review using their own analysis process. This letter is not a call for a specific action to buy, sell or short any of the stocks provided. There are NO sure things or guaranteed returns on the daily selection of "Diamonds in the Rough."
Regarding BUY/SELL Signals: The signal status reported herein is based upon mechanical trading model signals and crossovers. They define the implied bias of the price index/stock based upon moving average relationships and momentum, but they do not necessarily call for a specific action. They are information flags that should prompt chart review. Further, they do not call for continuous buying or selling during the life of the signal. For example, a BUY signal will probably (but not necessarily) return the best results if action is taken soon after the signal is generated. Additional opportunities for buying may be found as price zigzags higher, but the trader must look for optimum entry points. Conversely, exit points to preserve gains (or minimize losses) may be evident before the model mechanically closes the signal.
Helpful DecisionPoint Links:
Price Momentum Oscillator (PMO)
Swenlin Trading Oscillators (STO-B and STO-V)
For more links, go to DecisionPoint.com