
I found today's results on the ETF scans very interesting. One of the themes was Financials with the SPDR XLF coming up as well as a leveraged ETF for Financials. There were others managed by different companies that were basically the same as XLF. I looked at the charts though and I really didn't think it looked bullish enough to add to the list today, but I wanted you to know it did come up.
Technology also came through. I did select the Telecommunications ETF which is somewhat tech based. I think Technology will do well should the market stay elevated, but it is looking overbought right now.
We saw some foreign ETFs come up and that is where I picked the other two ETFs. One for Emerging Markets and one for Taiwan.
Tomorrow is our last Reader Request Day so get those symbols in to me by 1:00p PT tomorrow. You also might want to sign up for the last Diamond Mine trading room which will be held at the normal time this Friday at 9:00a PT.
Good Luck & Good Trading,
Erin
Today's "Diamonds in the Rough": EEM, EWT and IYZ.
Runner-ups: YINN, SMCY and AAXJ.

Diamond Mine Trading Room:
RECORDING & DOWNLOAD LINK (6/20/2025):
Topic: DecisionPoint Diamond Mine (6/20/2025) LIVE Trading Room
Download & Recording LINK
Passcode: June#20th
REGISTRATION for 6/27/2025:
When: June 27, 2025 09:00 AM Pacific Time (US and Canada)
Topic: DecisionPoint Diamond Mine LIVE Trading Room
Register in advance for this webinar HERE
After registering, you will receive a confirmation email containing information about joining the webinar.
Welcome to DecisionPoint Diamonds, wherein I highlight ten "Diamonds in the Rough" per week. These are selected from the results of my DecisionPoint Scans which search for stocks that could benefit from the trend and condition of the market. Remember, these are not recommendations to buy or sell, but are the most interesting of the stocks that surfaced in my scans. My objective is to save you the work of the initial, tedious culling process, but you need to apply your own analysis to see if these stocks pique your interest as well. There are no guaranteed winners here!
"Predefined Scans Triggered" are taken from StockCharts.com using the "Symbol Summary" option instead of a "SharpChart" on the workbench.
Stop levels are all rounded down.
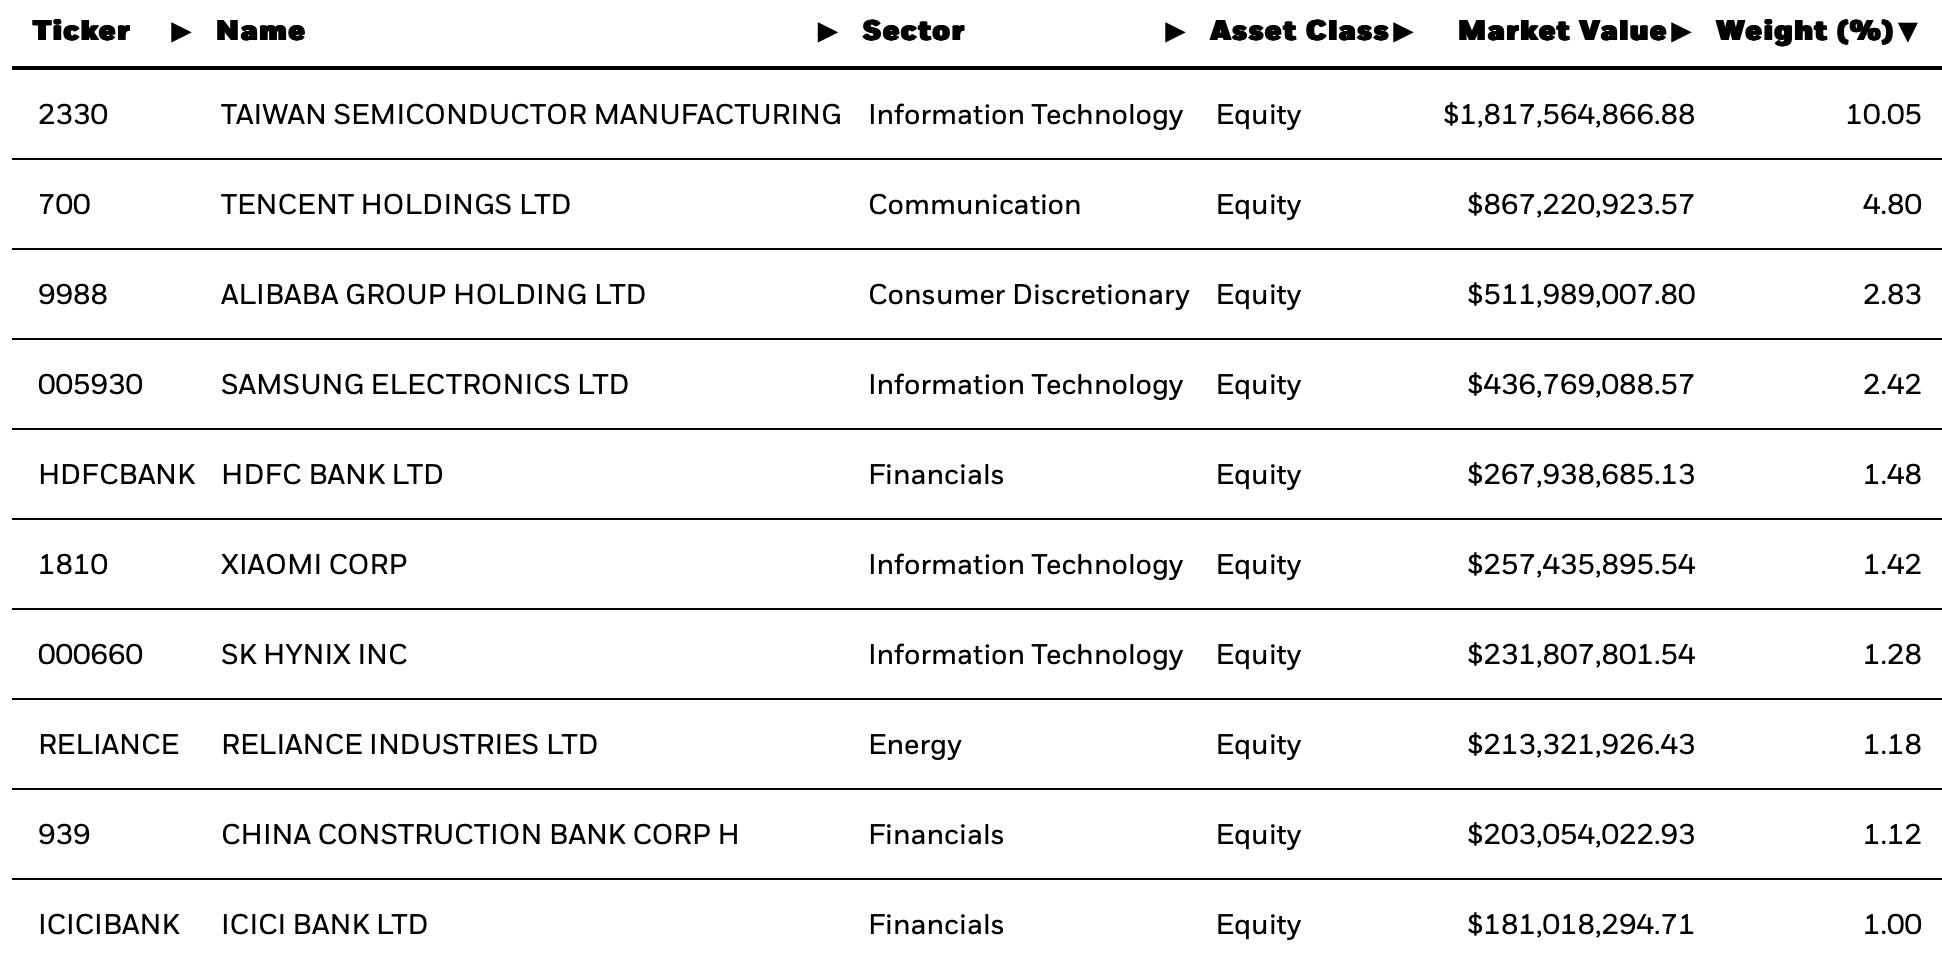
iShares MSCI Emerging Markets ETF (EEM)
EARNINGS: N/A
EEM tracks an index of emerging-market firms weighted by market cap. Click HERE for more information.
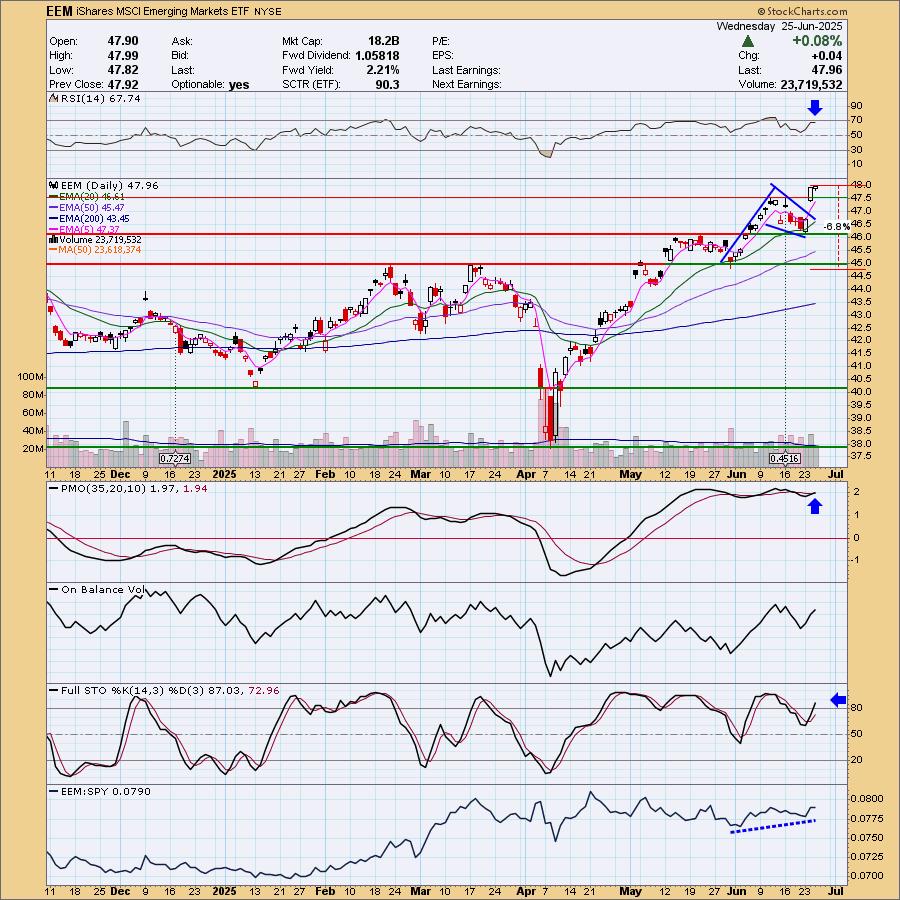
Predefined Scans Triggered: New 52-week Highs and P&F Double Top Breakout.
EEM is up +0.10% in after-hours trading. Two things I liked about this chart are the bull flag formation and the breakout to new 52-week Highs. The RSI is positive and not overbought yet. The PMO is on a new Crossover BUY Signal and is flat above the signal line implying strength. Stochastics have moved above 80 and we can see that relative strength is improving for the ETF against the SPY. The stop doesn't need to be set as deep as I have it if you don't want to as there is another level of support you could use. I chose 6.8% or $44.69.
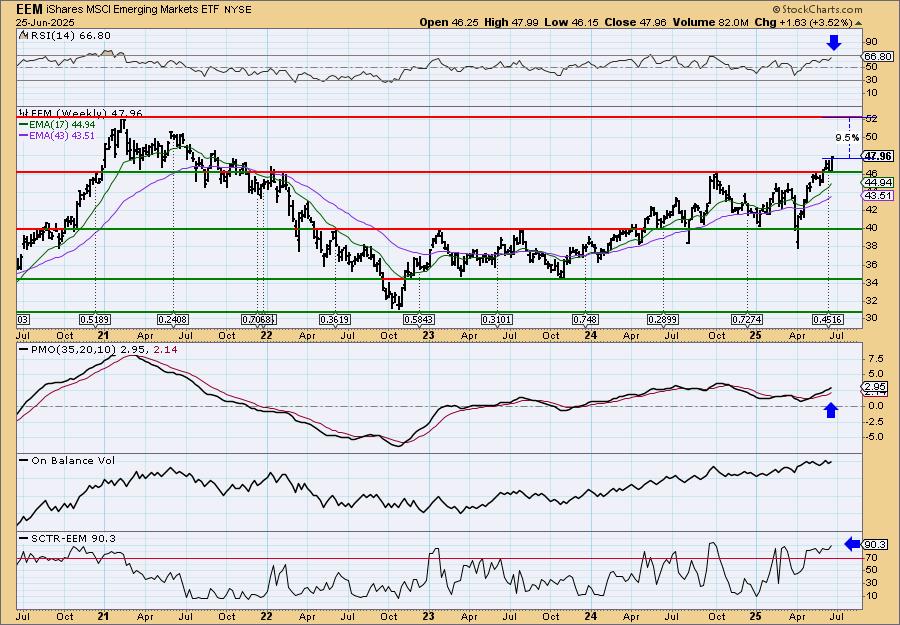
The breakout looks excellent on the weekly chart. The weekly RSI is in positive territory and the weekly PMO is rising on a Crossover BUY Signal. The StockCharts Technical Rank (SCTR) is well within the hot zone* above 70. It is getting close to overhead resistance, but I'm looking for a breakout there. Consider a 17% upside target to $56.11.
*If a stock is in the "hot zone" above 70, it implies that it is stronger than 70% of its universe (large-, mid-, small-caps and ETFs) primarily in the intermediate to long terms.
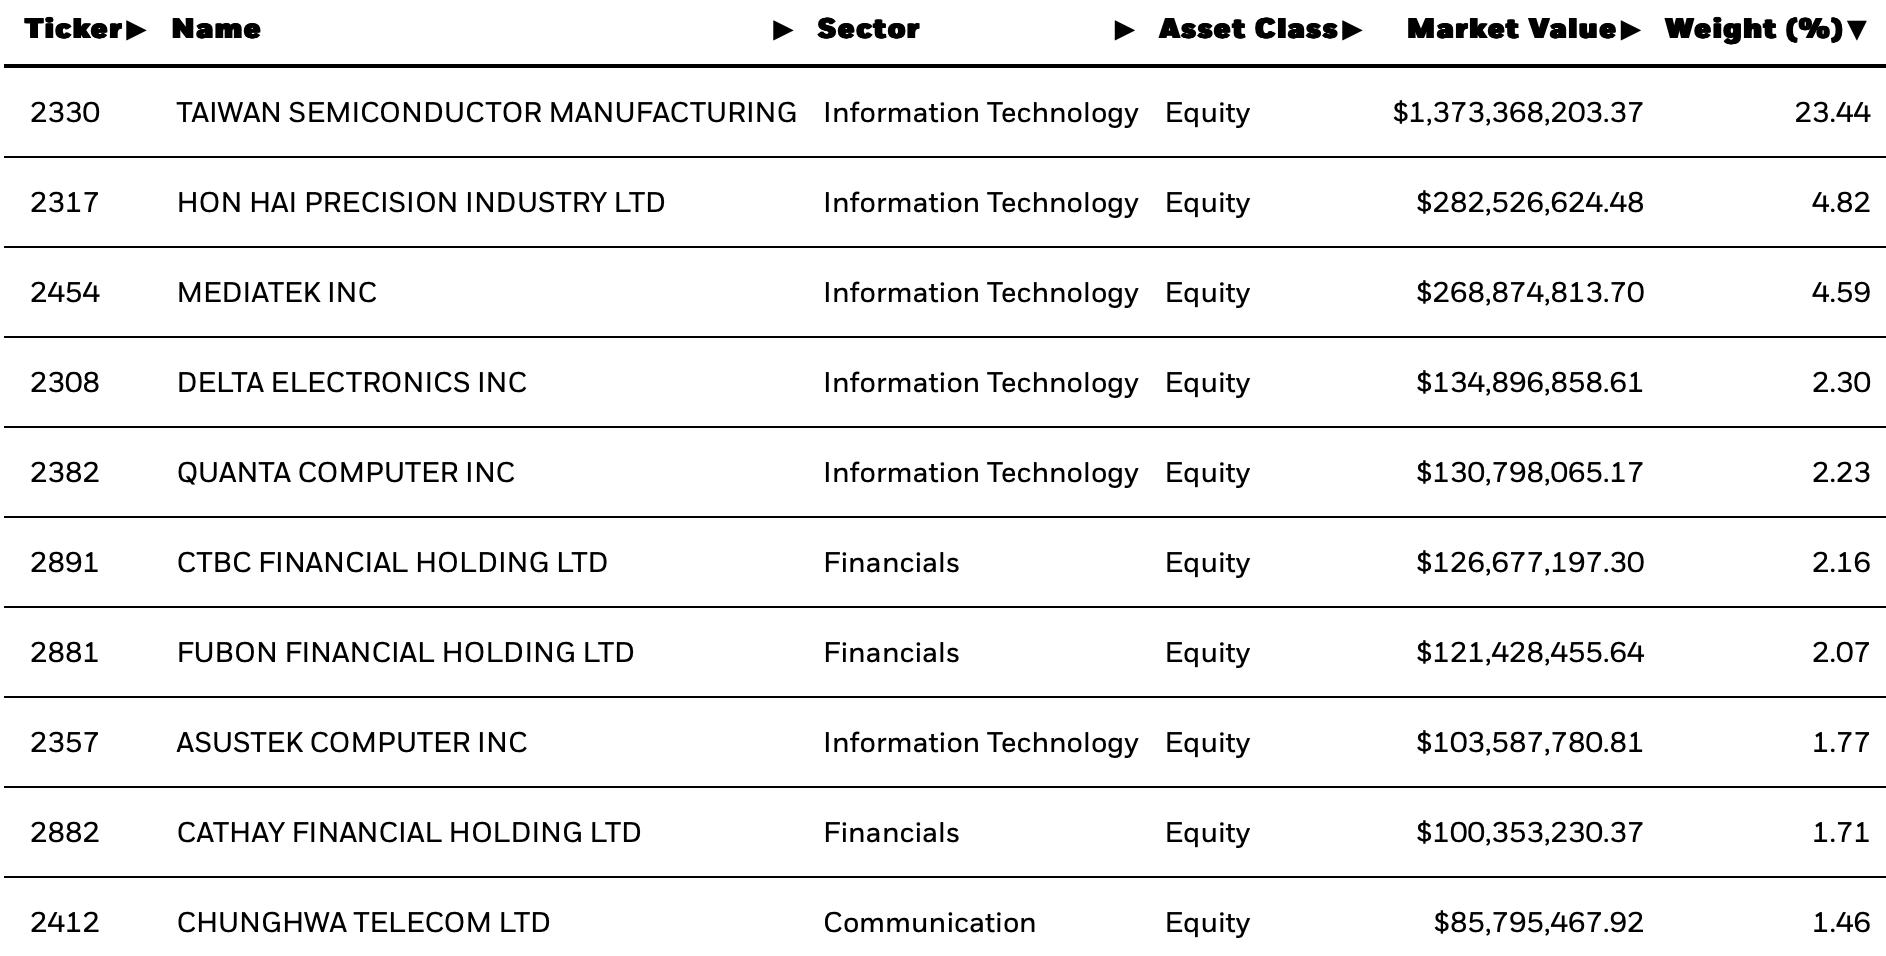
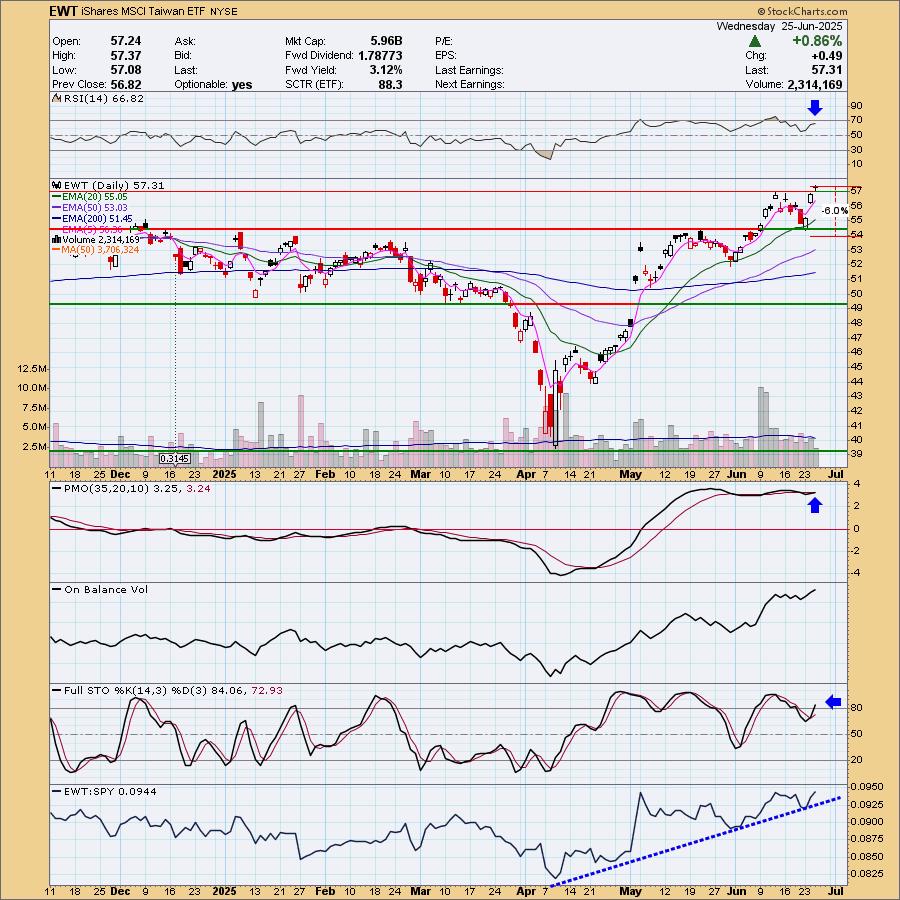
iShares MSCI Taiwan ETF (EWT)
EARNINGS: N/A
EWT tracks an index of Taiwanese firms, covering the top 85% of the market and weighted by market cap subjected to diversification requirements. Click HERE for more information.
Predefined Scans Triggered: Stocks in a New Uptrend (Aroon), Moved Above Upper Price Channel, P&F double Top Breakout and P&F Bearish Signal Reversal and New 52-week Highs.
EWT is down -0.38% in after-hours trading. I didn't annotate it, but we have another bull flag that has been confirmed on the breakout. I liked that price is making new 52-week highs. The RSI is positive and not overbought. The PMO is rising on a Crossover BUY Signal that occurred today. Stochastics are now back above 80. This ETF has been a strong performer since the April low. You don't need a very deep stop. I chose to set it below support at 6% or $53.87.
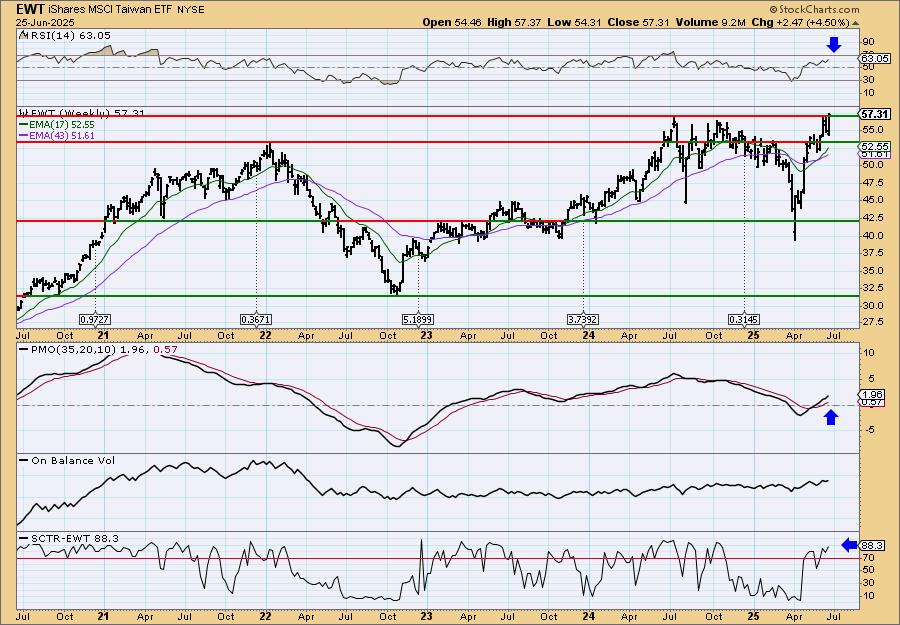
We can see this breakout is taking price to all-time highs. The weekly RSI is positive and not overbought despite the lengthy rally. The weekly PMO is rising above the zero line on a Crossover BUY Signal. The SCTR is in the hot zone. Consider a 17% upside target to $67.05.
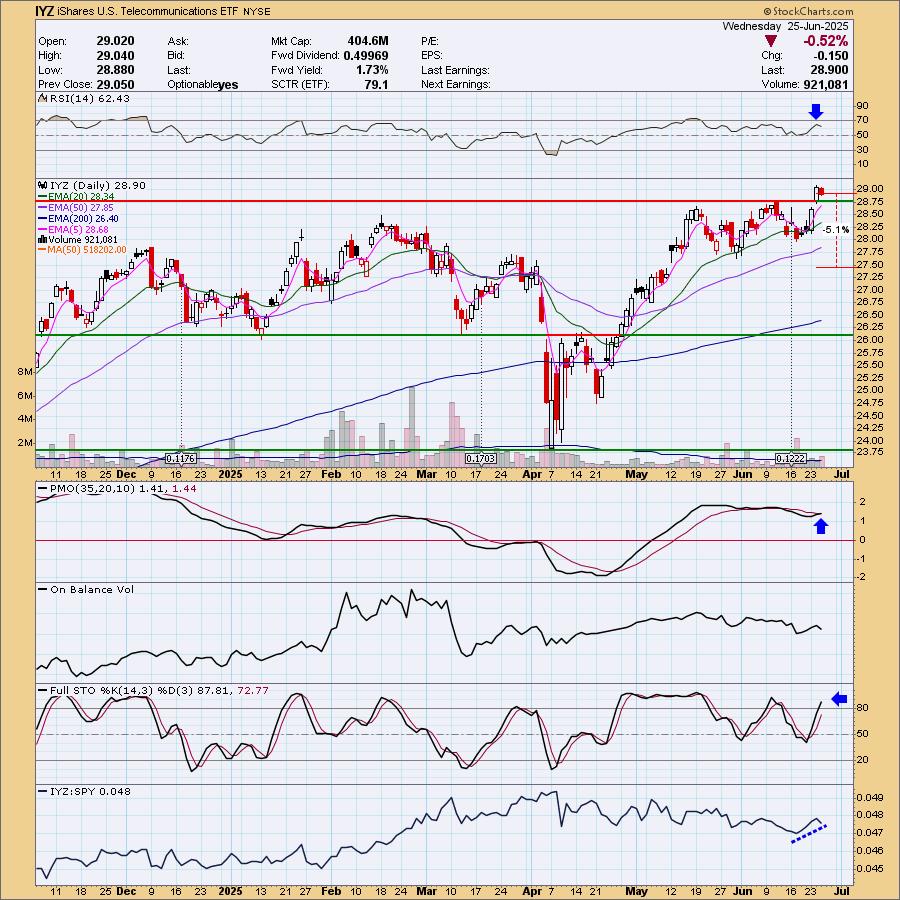
iShares U.S. Telecommunications ETF (IYZ)
EARNINGS: N/A
IYZ tracks a market-cap-weighted index of large-cap US companies involved in the telecommunications industry. Click HERE for more information.

Predefined Scans Triggered: P&F Ascending Triple Top Breakout and P&F Double Top Breakout.
IYZ is unchanged in after-hours trading. Yesterday saw a breakout above resistance. It does look like a bull flag as well where the flag was a bullish ascending triangle (flat top, rising bottoms). The RSI is positive and not at all overbought. The PMO is about to trigger a Crossover BUY Signal. Stochastics have risen above 80. The ETF has been outperforming over the past week. The stop doesn't have to be set very deep. I chose to line it up beneath support at 5.1% or $27.42.
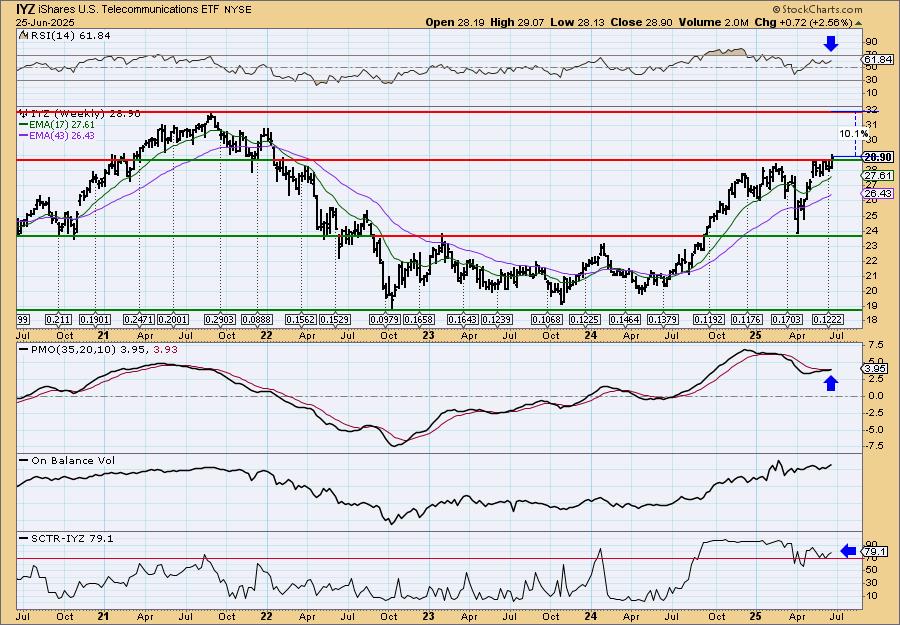
The breakout looks good on the weekly chart. The weekly RSI is positive and not overbought. The weekly PMO is on a Crossover BUY Signal that just came in. The SCTR is in the hot zone. It will come up against resistance on a 10% move, but I would look for a breakout. Consider a 17% upside target to about $33.81.
Don't forget, on Thursdays I look at reader-requested symbols, click HERE to send me an email. I read every email I receive and try to answer them all!
Current Market Outlook:
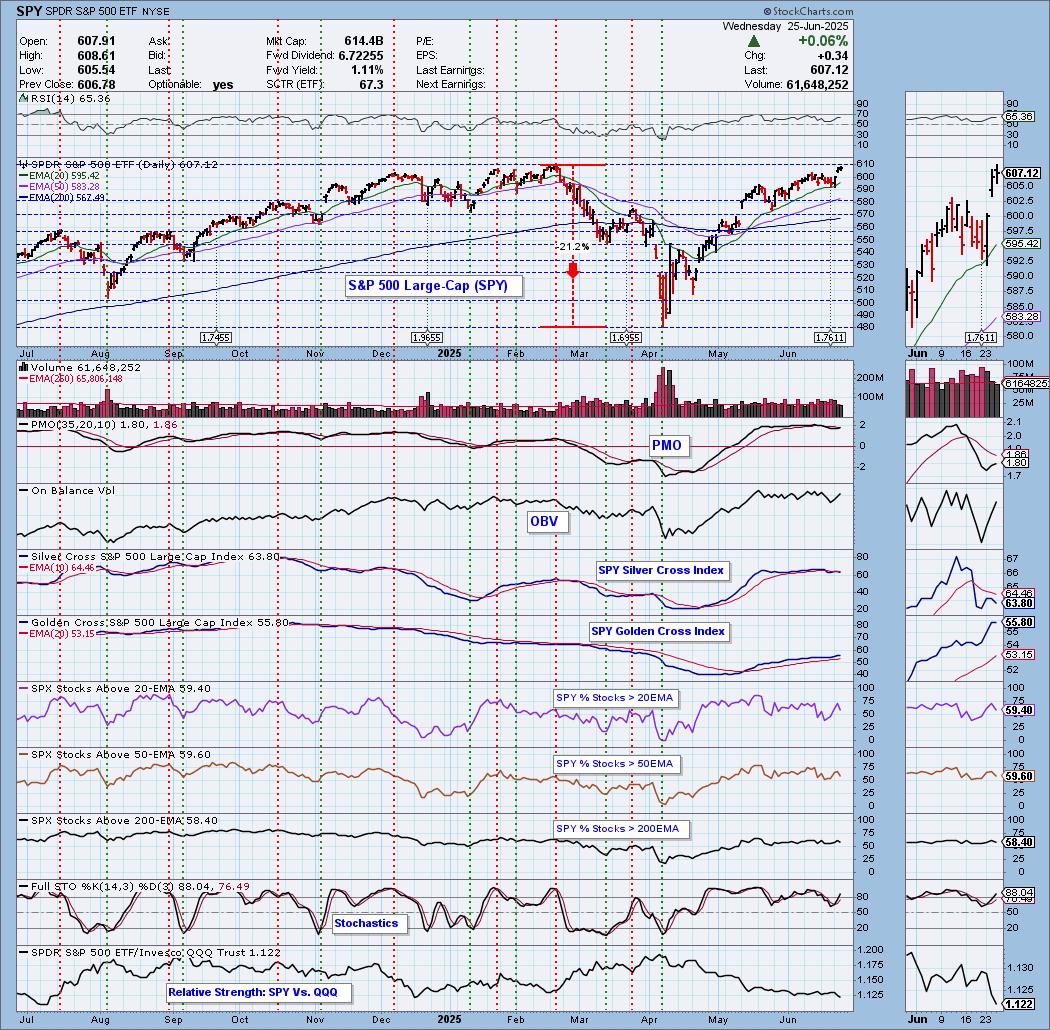
Market Environment: It is important to consider the odds for success by assessing the market tides. The following chart uses different methodologies for objectively showing the depth and trend of participation for intermediate- and long-term time frames.
- The Silver Cross Index (SCI) shows the percentage of SPX stocks on IT Trend Model BUY signals (20-EMA > 50-EMA)
- The Golden Cross Index (GCI) shows the percentage of SPX stocks on LT Trend Model BUY signals (50-EMA > 200-EMA)
Don't forget that as a "Diamonds" member, you have access to our "Under the Hood" curated ChartList on DecisionPoint.com. You'll find it under "Members Only" links on the left side on the Blogs and Links Page.
Here is the current chart:
Full Disclosure: I am 50% long, 0% short.
I'm required to disclose if I currently own a stock I mention and/or may buy/short it within the next 72 hours.
"Technical Analysis is a windsock, not a crystal ball." - Carl Swenlin
(c) Copyright 2025 DecisionPoint.com
NOTE: The stocks reported herein are from mechanical trading model scans that are based upon moving average relationships, momentum and volume. DecisionPoint analysis is then applied to get five selections from the scans. The selections given should prompt readers to do a chart review using their own analysis process. This letter is not a call for a specific action to buy, sell or short any of the stocks provided. There are NO sure things or guaranteed returns on the daily selection of "Diamonds in the Rough."
Regarding BUY/SELL Signals: The signal status reported herein is based upon mechanical trading model signals and crossovers. They define the implied bias of the price index/stock based upon moving average relationships and momentum, but they do not necessarily call for a specific action. They are information flags that should prompt chart review. Further, they do not call for continuous buying or selling during the life of the signal. For example, a BUY signal will probably (but not necessarily) return the best results if action is taken soon after the signal is generated. Additional opportunities for buying may be found as price zigzags higher, but the trader must look for optimum entry points. Conversely, exit points to preserve gains (or minimize losses) may be evident before the model mechanically closes the signal.
Helpful DecisionPoint Links:
Price Momentum Oscillator (PMO)
Swenlin Trading Oscillators (STO-B and STO-V)
For more links, go to DecisionPoint.com