
I didn't plan it this way, but it turns out all four of today's selections display reverse head and shoulders patterns. These bullish patterns tell us to expect lengthy breakouts the height of the pattern. I will say that they aren't the most reliable patterns. We find wedges to be much more accurate. In any case, the setups are bullish especially given the indicators.
I noticed a few Semiconductors making the scans today. I opted to pick one that is showing rising relative strength against the group and holds a nice PMO value. (MKSI)
There were also a number of Financial stocks that hit the scans so I ended up picking three of them. Two of them are in Specialty Finance. It wasn't my intention to pick two from the same group, it just turned out that I liked them most from the bunch.
Do take a look at the runner-ups as I think they too have merit.
Good Luck & Good Trading,
Erin
Today's "Diamonds in the Rough": CG, EWBC, MC and MKSI.
Runner-ups: KLAC, ST, AMAT, TXT, PLUS and CAT.

Diamond Mine Trading Room:
RECORDING & DOWNLOAD LINK (6/20/2025):
Topic: DecisionPoint Diamond Mine (6/20/2025) LIVE Trading Room
Download & Recording LINK
Passcode: June#20th
REGISTRATION for 6/27/2025:
When: June 27, 2025 09:00 AM Pacific Time (US and Canada)
Topic: DecisionPoint Diamond Mine LIVE Trading Room
Register in advance for this webinar HERE
After registering, you will receive a confirmation email containing information about joining the webinar.
Welcome to DecisionPoint Diamonds, wherein I highlight ten "Diamonds in the Rough" per week. These are selected from the results of my DecisionPoint Scans which search for stocks that could benefit from the trend and condition of the market. Remember, these are not recommendations to buy or sell, but are the most interesting of the stocks that surfaced in my scans. My objective is to save you the work of the initial, tedious culling process, but you need to apply your own analysis to see if these stocks pique your interest as well. There are no guaranteed winners here!
"Predefined Scans Triggered" are taken from StockCharts.com using the "Symbol Summary" option instead of a "SharpChart" on the workbench.
Stop levels are all rounded down.
Carlyle Group LP (CG)
EARNINGS: 2025-08-05 (AMC)
The Carlyle Group, Inc. is a global investment firm. It operates through the following segments: Global Private Equity (GPE), Global Credit (GC), and Global Investment Solutions (GIS). The GPE segment focuses on buyout and growth capital funds, which pursue a variety of corporate investments of different sizes and growth potentials. The GC segment includes funds and vehicles that pursue investment strategies including loans and structured credit, direct lending, opportunistic credit, distressed credit, aircraft financing and servicing, infrastructure debt, insurance solutions, and global capital markets. The GIS segment provides comprehensive investment opportunities and resources for investors and clients to build private equity portfolios through fund of funds, secondary purchases or financings of existing portfolios, and managed co-investment programs. The company was founded by William Elias Conway Jr., Daniel Anthony D'Aniello, and David Mark Rubenstein in 1987 and is headquartered in Washington, DC.
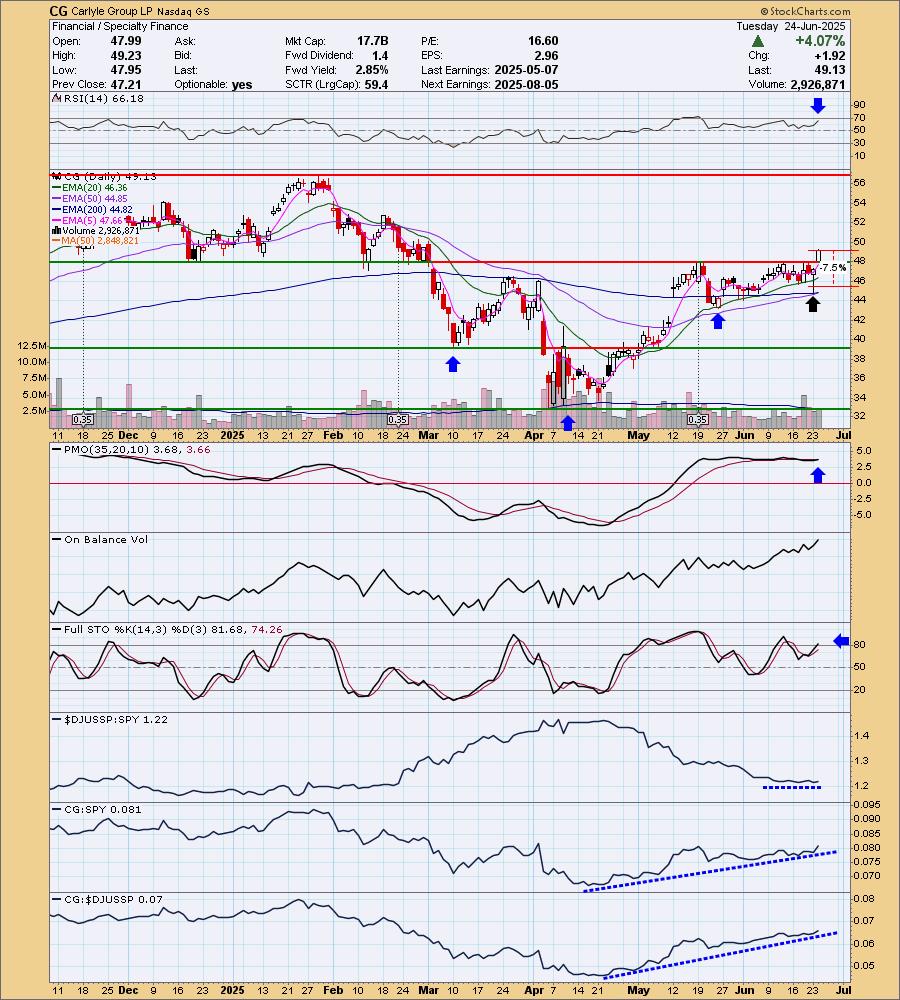
Predefined Scans Triggered: Moved Above Upper Bollinger Band, Moved Above Upper Price Channel, Parabolic SAR Buy Signals, P&F Ascending Triple Top Breakout, New CCI Buy Signals and P&F Double Top Breakout.
CG is unchanged in after-hours trading. Here's our first reverse head and shoulders. We saw a breakout that essentially confirmed the pattern today. I note that there is a new Golden Cross of the 50/200-day EMAs. The RSI is positive and not overbought. The PMO is on a new Crossover BUY Signal and is flat above the zero line implying pure strength. Stochastics just popped above 80. The group is performing in line with the SPY which works for me given the SPY is bullish right now. CG is outperforming the group and the SPY and has been for some time. The minimum upside target of the reverse head and shoulders pattern would put price around $64. Not sure it will get that far, but it is a great looking target. The stop is set between the 20/50-day EMAs at 7.5% or $45.44.
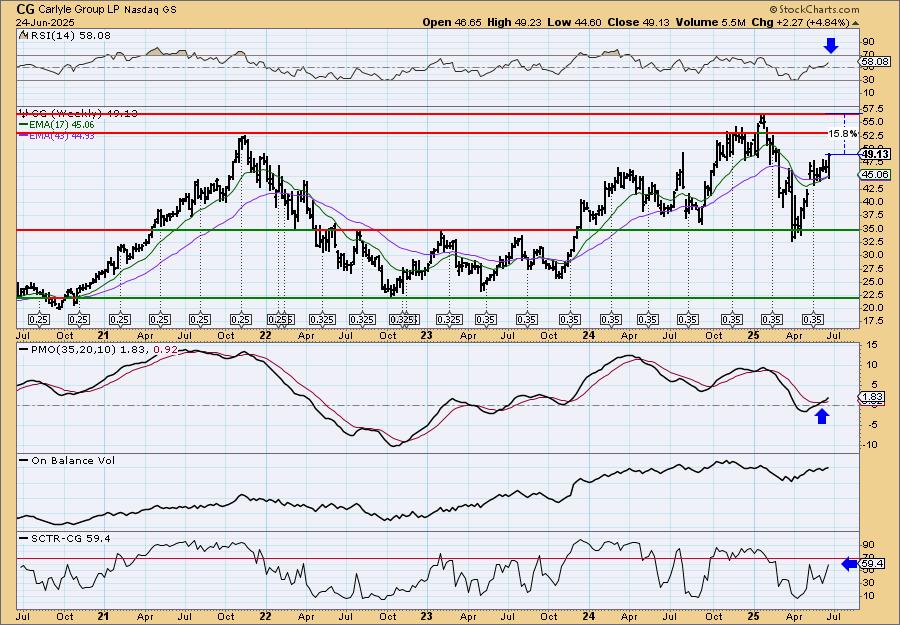
We got a strong bounce off support on the weekly chart. While upside potential looks limited, we know from the chart pattern above that upside potential is far greater than 15%. The weekly RSI is positive and not overbought. The weekly PMO is rising on a Crossover BUY Signal above the zero line indicating strength. The StockCharts Technical Rank (SCTR) isn't in the hot zone* yet, but it is quickly on its way.
*If a stock is in the "hot zone" above 70, it implies that it is stronger than 70% of its universe (large-, mid-, small-caps and ETFs) primarily in the intermediate to long terms.
East West Bancorp, Inc. (EWBC)
EARNINGS: 2025-07-22 (AMC)
East West Bancorp, Inc. is a bank holding company, which engages in the provision of financial services. It operates through the following business segments: Consumer and Business Banking, Commercial Banking, and Other. The Consumer and Business Banking segment provides financial service products and services to consumer and commercial customers through the company's branch network in the U.S. The Commercial Banking segment primarily focuses on commercial loans and deposits. The Other segment includes treasury activities of the company and elimination of inter-segment amounts. The company was founded on August 26, 1998 and is headquartered in Pasadena, CA.
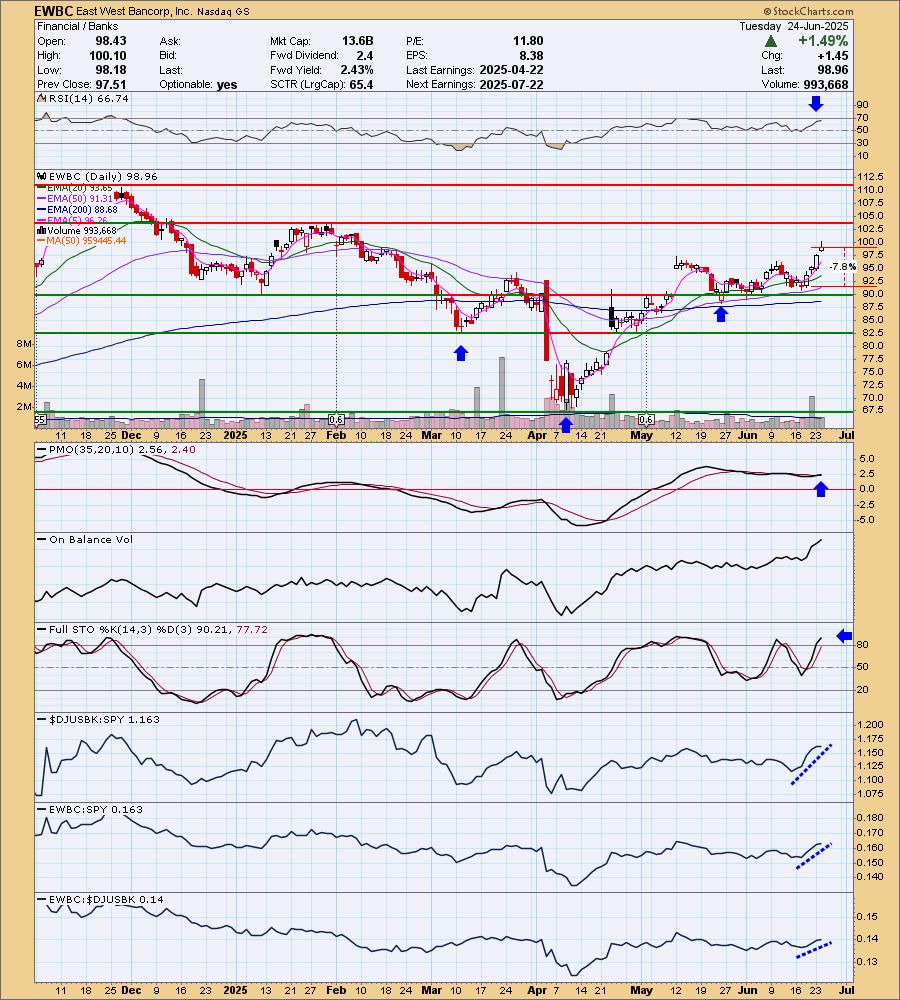
Predefined Scans Triggered: Moved Above Upper Keltner Channel, P&F Ascending Triple Top Breakout and P&F Double Top Breakout.
EWBC is up +1.05% in after hours trading. I really liked today's breakout that confirmed the bullish reverse head and shoulders. EMAs are also configured very positively. The RSI is positive and not overbought. The PMO is on a new Crossover BUY Signal and is running flat above the zero line implying strength. Stochastics have moved above 80. Relative strength shows the Banks are outperforming. EWBC is outperforming the group already and consequently is outperforming the SPY. The minimum upside target of the reverse head and shoulders pattern is around $127.50. The stop is set near the 50-day EMA at 7.8% or $91.24.
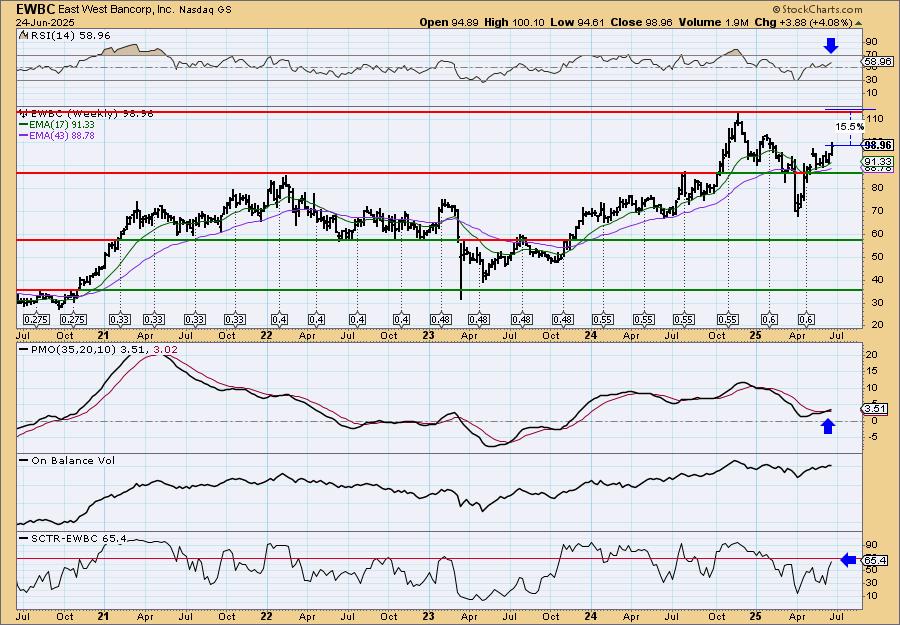
Upside potential looks somewhat limited, but based on the reverse head and shoulders, we know it could break out to all-time highs. The weekly RSI is positive and not overbought. The weekly PMO is rising on a Crossover BUY Signal above the zero line. The SCTR is just about in the hot zone.
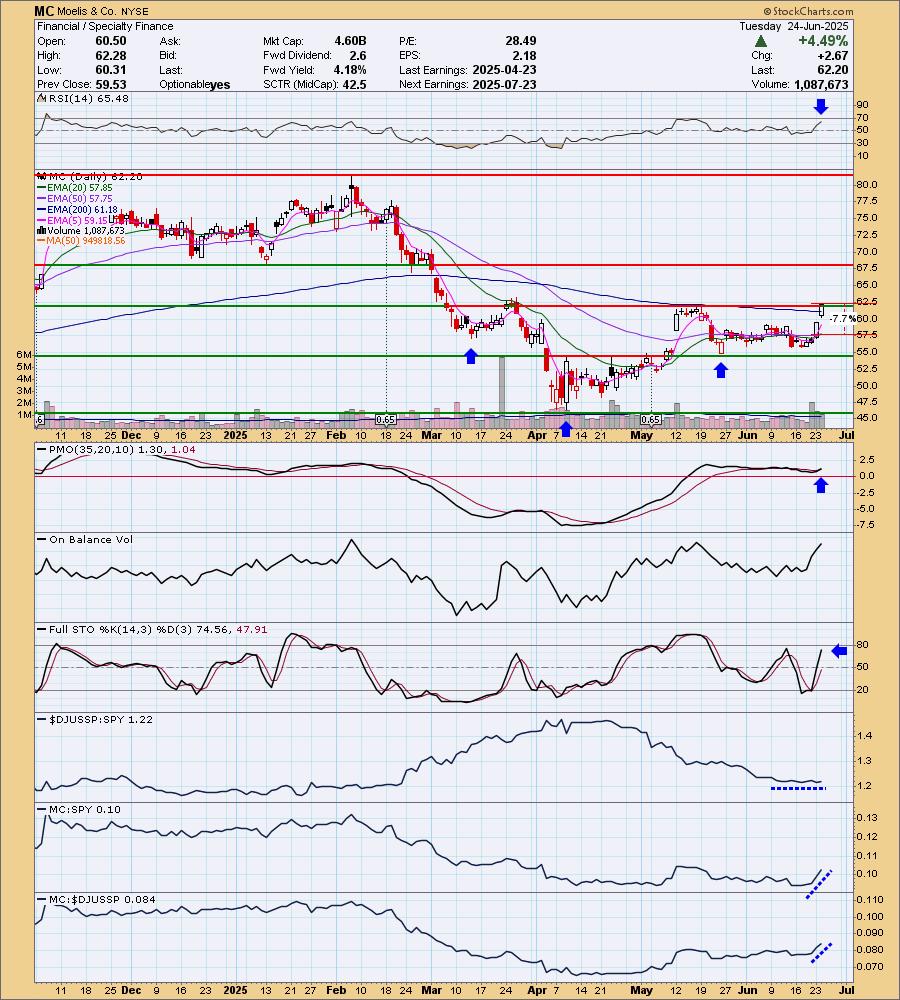
Moelis & Co. (MC)
EARNINGS: 2025-07-23 (AMC)
Moelis & Co. operates as a holding company. It engages in the provision of financial advisory, capital raising and asset management services to a client base including corporations, governments, sovereign wealth funds and financial sponsors. The firm focuses on clients including large public multinational corporations, middle market private companies, financial sponsors, entrepreneurs and governments. The company was founded by Kenneth David Moelis, Navid Mahmoodzadegan, Jeffrey Raich and Elizabeth Ann Crain in July 2007 and is headquartered in New York, NY.
Predefined Scans Triggered: Stocks in a New Uptrend (Aroon), P&F Double Top Breakout, P&F Bullish Triangle and Moved Above Upper Keltner Channel.
MC is unchanged in after-hours trading. Here is another reverse head and shoulders. The neckline is down sloping so this breakout move does confirm the pattern. I liked the breakout above the 200-day EMA too. The RSI is positive and not overbought. The PMO is rising on a new Crossover BUY Signal above the zero line. Stochastics are rising strongly toward 80. Relative strength is in line with the SPY as we noted earlier. MC is outperforming now against the group and the SPY. The stop is set around the 50-day EMA at 7.7% or $57.41.
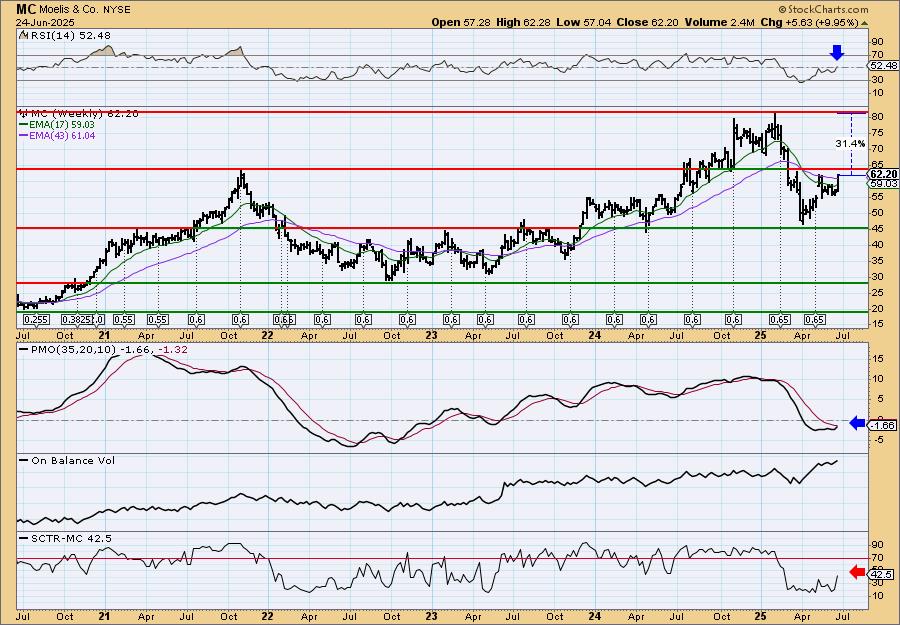
Resistance is arriving, but this looks like a solid rally off support at $45. I'm looking for a breakout based on the reverse head and shoulders pattern. The weekly RSI is now in positive territory and the weekly PMO is nearing a Crossover BUY Signal. The SCTR is not in the hot zone, but it is headed that direction rapidly. The upside target of the reverse head and shoulders pattern would put price at all-time highs.
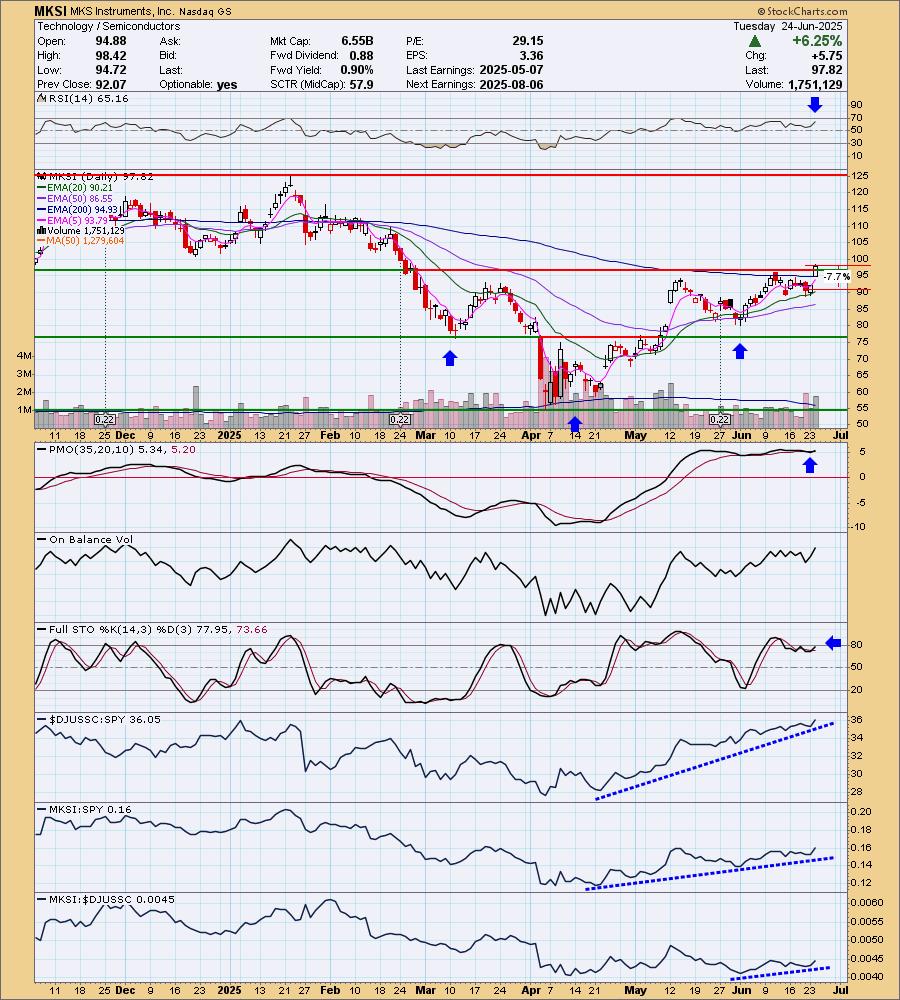
MKS Instruments, Inc. (MKSI)
EARNINGS: 2025-08-06 (AMC)
MKS, Inc. provides instruments, systems, subsystems and process control solutions to measure, control, power, monitor, and analyze parameters of manufacturing processes to improve process performance and productivity for its customers. It operates through the following segments: VSD (Vacuum Solutions Division), PSD (Photonics Solutions Division), and MSD (Materials Solutions Division). The VSD segment delivers foundational technology solutions to semiconductor manufacturing, electronics and packaging and specialty industrial applications. The PSD Segment provides a range of instruments, components and subsystems to edge semiconductor manufacturing, electronics and packaging and specialty industrial applications. The MSD segment develops process and manufacturing technologies for advanced surface modification, electroless and electrolytic plating, and surface finishing. The company was founded in 1961 and is headquartered in Andover, MA.
Predefined Scans Triggered: Elder Bar Turned Green, New CCI Buy Signals, Gap Ups, Moved Above Upper Bollinger Band, Stocks in a New Uptrend (Aroon), Moved Above Upper Price Channel, Parabolic SAR Buy Signals, Runaway Gap Ups and P&F Double Top Breakout.
MKSI is unchanged in after-hours trading. Today's breakout gap up confirmed the reverse head and shoulders pattern. This was also breakout above the 200-day EMA. The RSI is positive and not overbought. The PMO is on a new Crossover BUY Signal. Stochastics are rising and should get above 80 soon. Relative strength for Semiconductors is incredible right now. MKSI is showing some outperformance against the group and the SPY. The stop is set near the 20-day EMA at 7.7% or $90.28. The minimum upside target of the pattern is around $135.
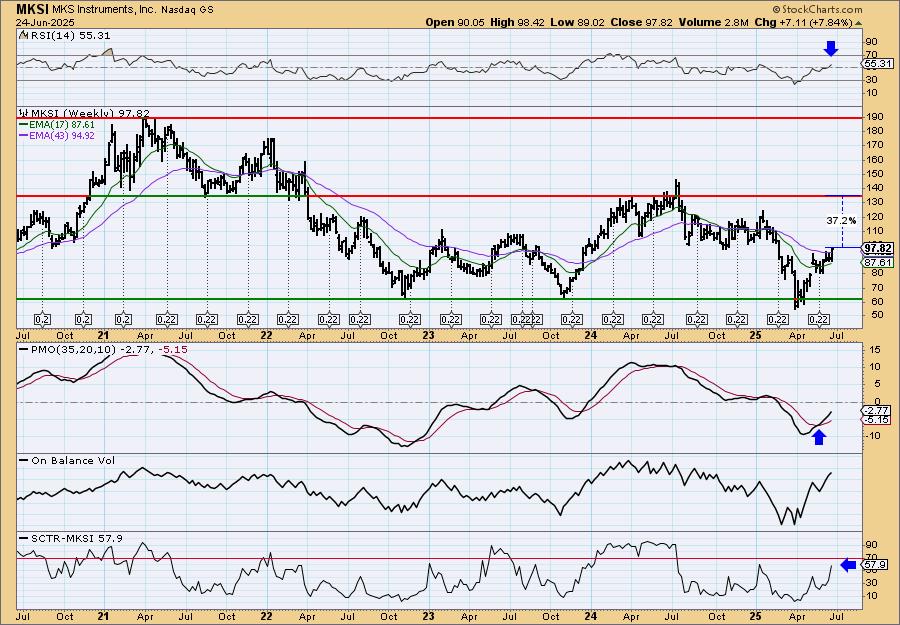
Interestingly the upside target of the pattern is around $135 and it is also showing as horizontal resistance on the weekly chart. The weekly RSI is now in positive territory. The weekly PMO is rising on a Crossover BUY Signal. The SCTR is nearing the hot zone.
Don't forget, on Thursdays I look at reader-requested symbols, click HERE to send me an email. I read every email I receive and try to answer them all!
Current Market Outlook:
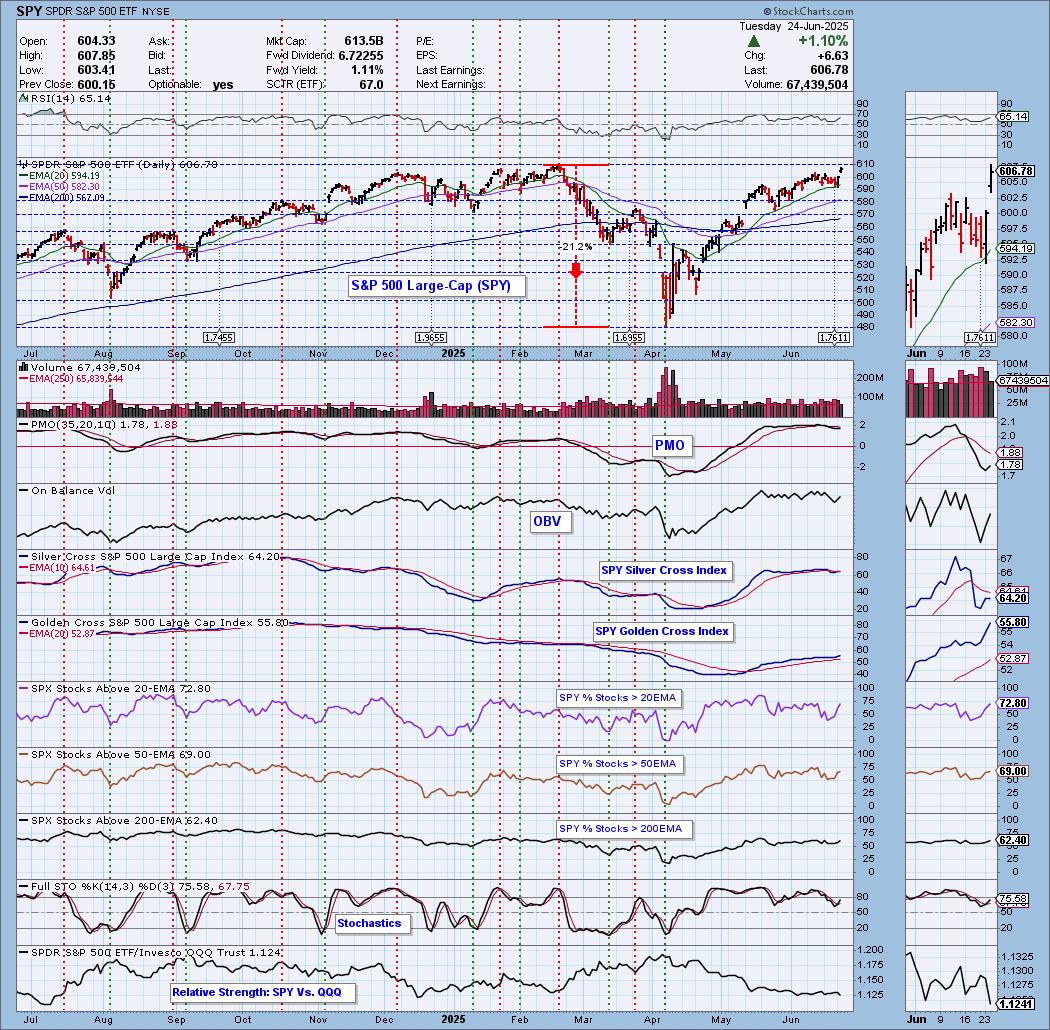
Market Environment: It is important to consider the odds for success by assessing the market tides. The following chart uses different methodologies for objectively showing the depth and trend of participation for intermediate- and long-term time frames.
- The Silver Cross Index (SCI) shows the percentage of SPX stocks on IT Trend Model BUY signals (20-EMA > 50-EMA)
- The Golden Cross Index (GCI) shows the percentage of SPX stocks on LT Trend Model BUY signals (50-EMA > 200-EMA)
Don't forget that as a "Diamonds" member, you have access to our "Under the Hood" curated ChartList on DecisionPoint.com. You'll find it under "Members Only" links on the left side on the Blogs and Links Page.
Here is the current chart:
Full Disclosure: I am 50% long, 0% short.
I'm required to disclose if I currently own a stock I mention and/or may buy/short it within the next 72 hours.
"Technical Analysis is a windsock, not a crystal ball." - Carl Swenlin
(c) Copyright 2025 DecisionPoint.com
NOTE: The stocks reported herein are from mechanical trading model scans that are based upon moving average relationships, momentum and volume. DecisionPoint analysis is then applied to get five selections from the scans. The selections given should prompt readers to do a chart review using their own analysis process. This letter is not a call for a specific action to buy, sell or short any of the stocks provided. There are NO sure things or guaranteed returns on the daily selection of "Diamonds in the Rough."
Regarding BUY/SELL Signals: The signal status reported herein is based upon mechanical trading model signals and crossovers. They define the implied bias of the price index/stock based upon moving average relationships and momentum, but they do not necessarily call for a specific action. They are information flags that should prompt chart review. Further, they do not call for continuous buying or selling during the life of the signal. For example, a BUY signal will probably (but not necessarily) return the best results if action is taken soon after the signal is generated. Additional opportunities for buying may be found as price zigzags higher, but the trader must look for optimum entry points. Conversely, exit points to preserve gains (or minimize losses) may be evident before the model mechanically closes the signal.
Helpful DecisionPoint Links:
Price Momentum Oscillator (PMO)
Swenlin Trading Oscillators (STO-B and STO-V)
For more links, go to DecisionPoint.com