
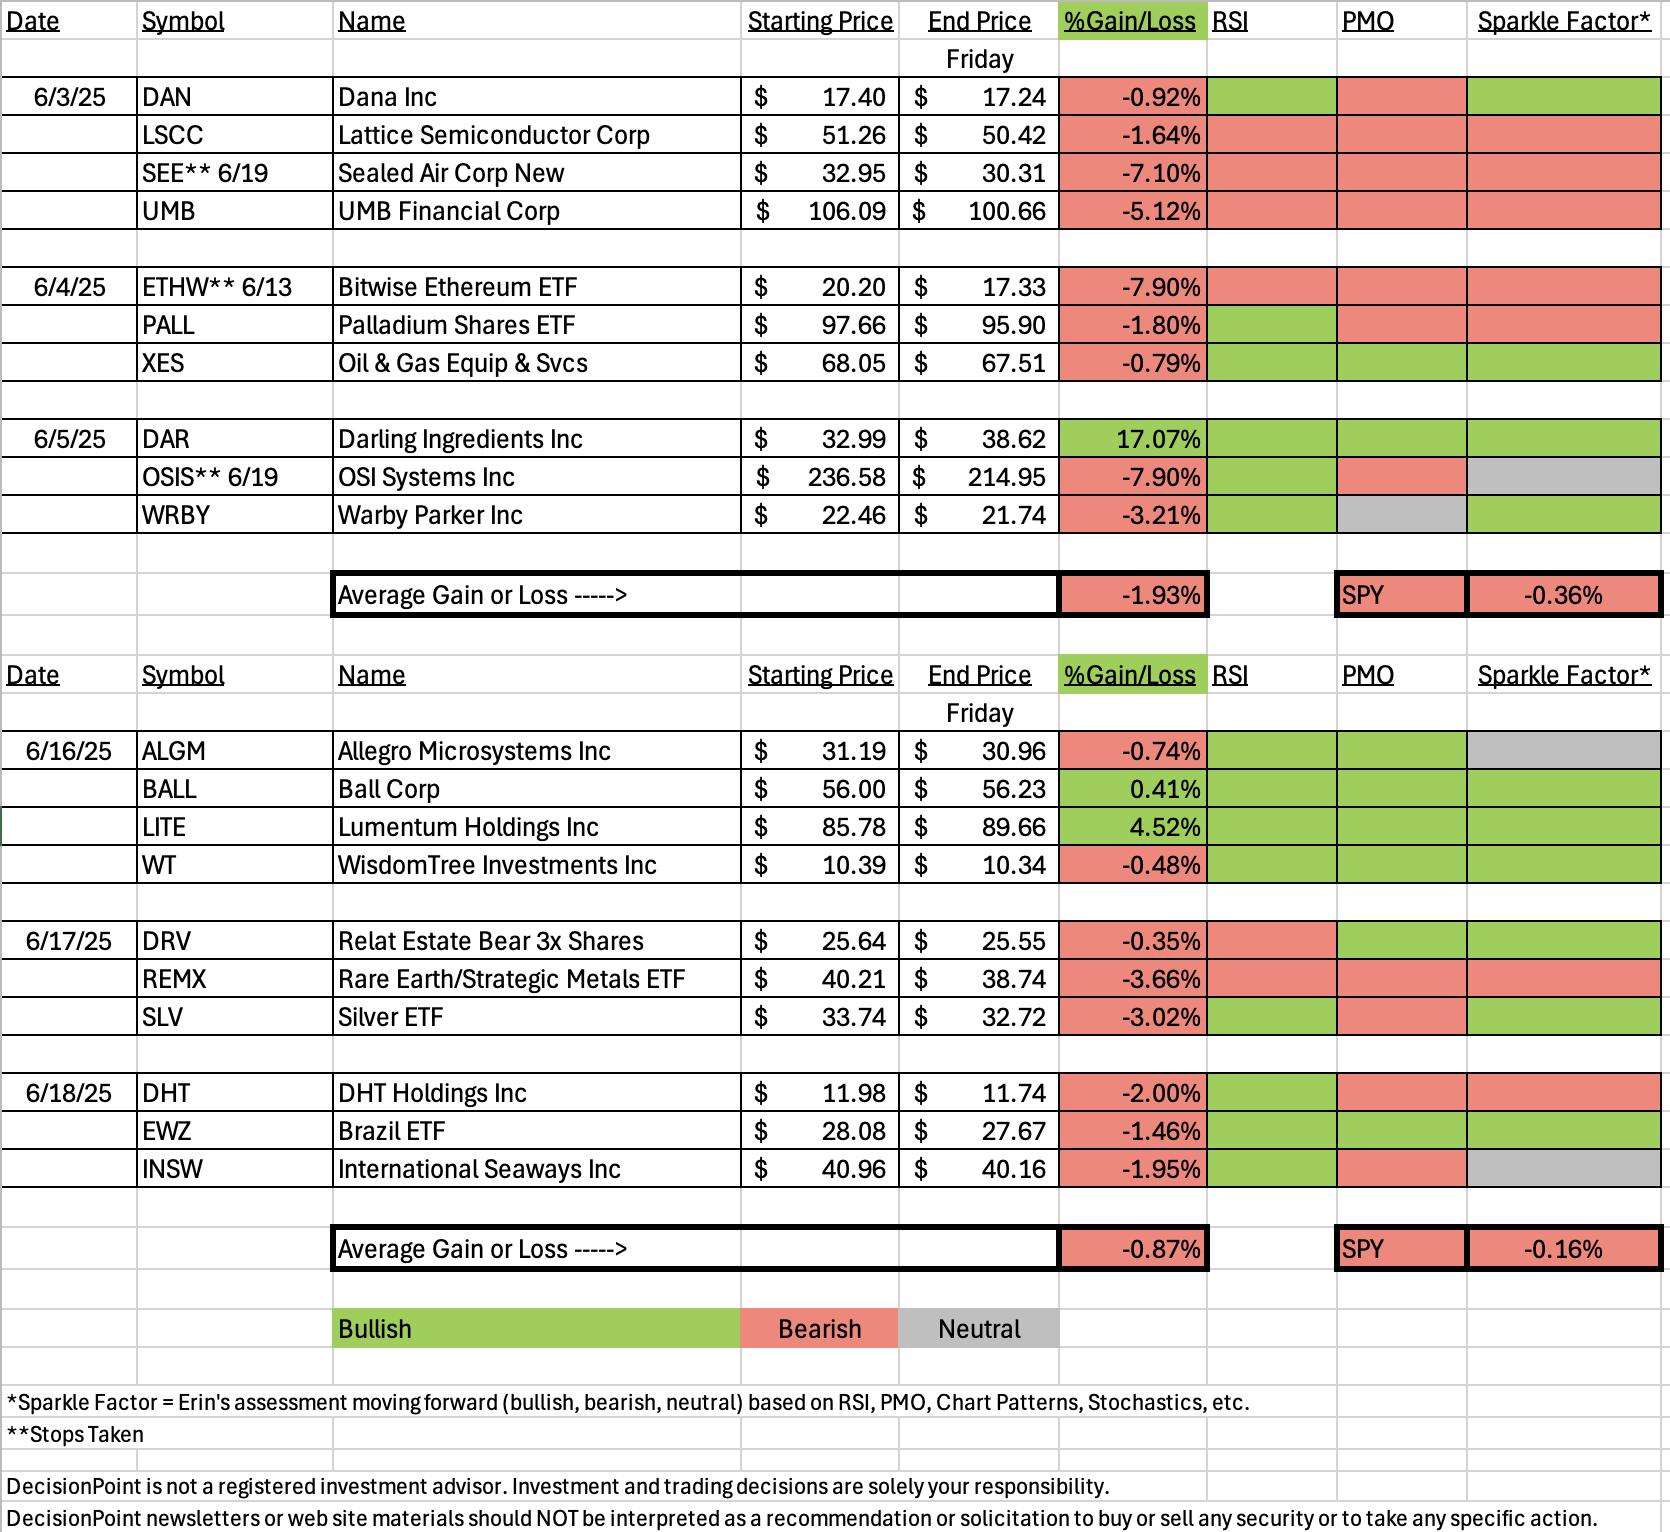
The spreadsheet could definitely look better. We had two stops hit yesterday on positions from last week. The market is weakening and that is going to put downside pressure on most positions. It may be wise to avoid the more aggressive growth stocks for now. The market could be correcting internally and could therefore continue to make its way higher, but given the lack of participation and PMO BUY Signals within the index, it seems more likely that we will make our way lower.
A caveat on the symbols I'm providing you this week. Many are overbought, particularly those in our Sector to Watch so go in with eyes wide open and be nimble.
The Sector to Watch was easy to pick this week as Energy (XLE) was the only sector with a rising PMO. Technology (XLK) looked interesting with its flat PMO above the zero line, but ultimately the PMO is in decline and I'm looking for weakness in the market and consequently the sector.
The Industry Group to Watch was Integrated Oil & Gas, but we could have gone with Exploration & Production which also looks bullish. We picked that industry group last week so I opted to go with this one today. Coal also looked good, but when we dipped inside to find stocks we saw that most were down by a lot and so we could be seeing a pullback beginning on Coal. The symbols I found of interest in the group are: NGL, SSL, PSX, XOM, PBR and BRY.
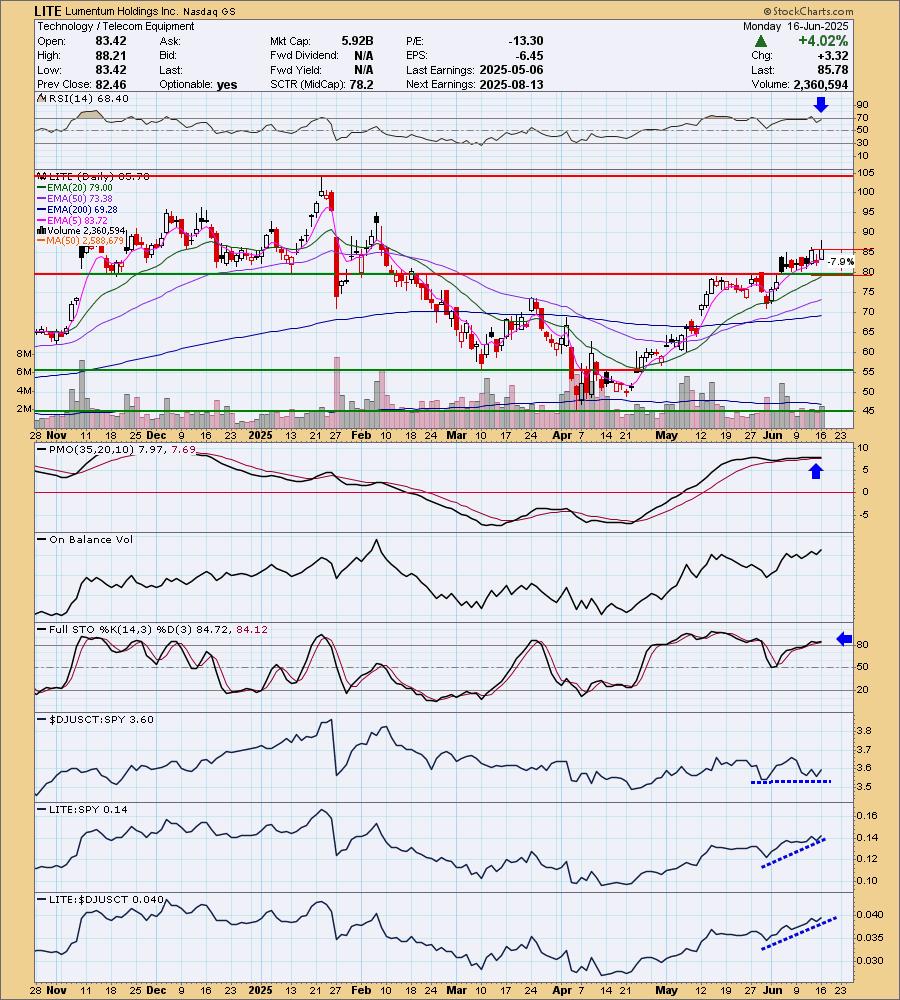
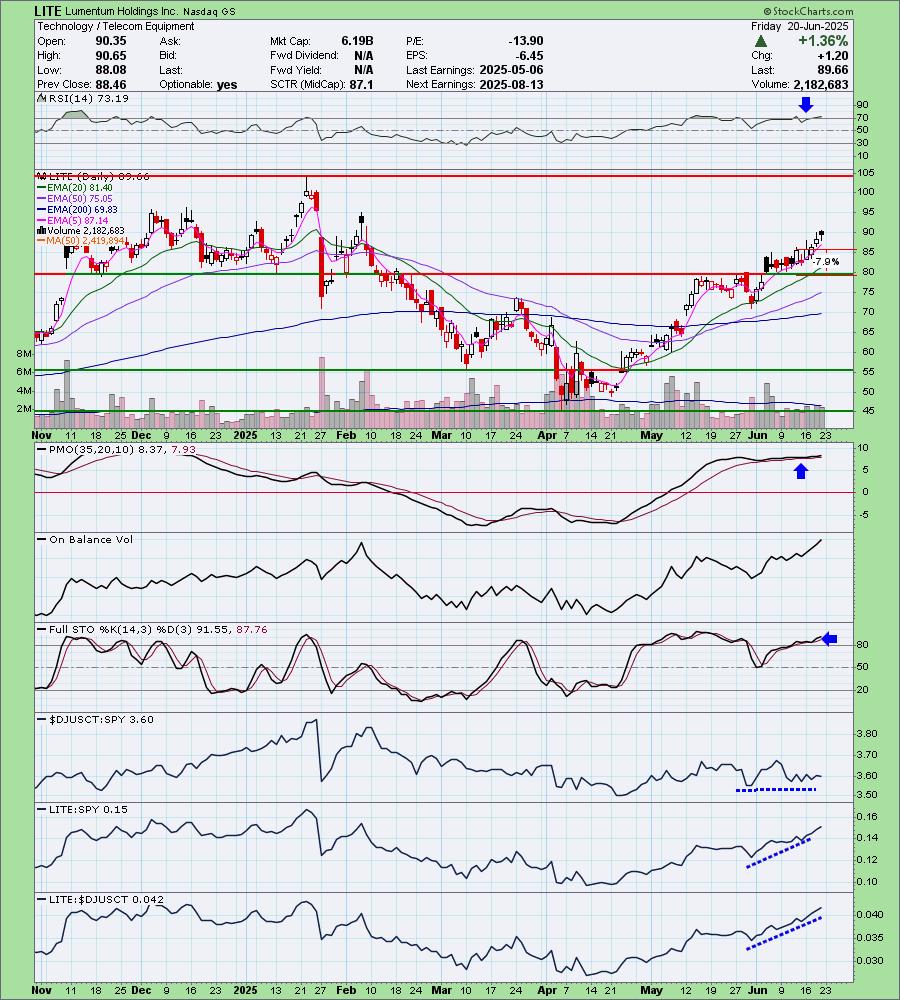
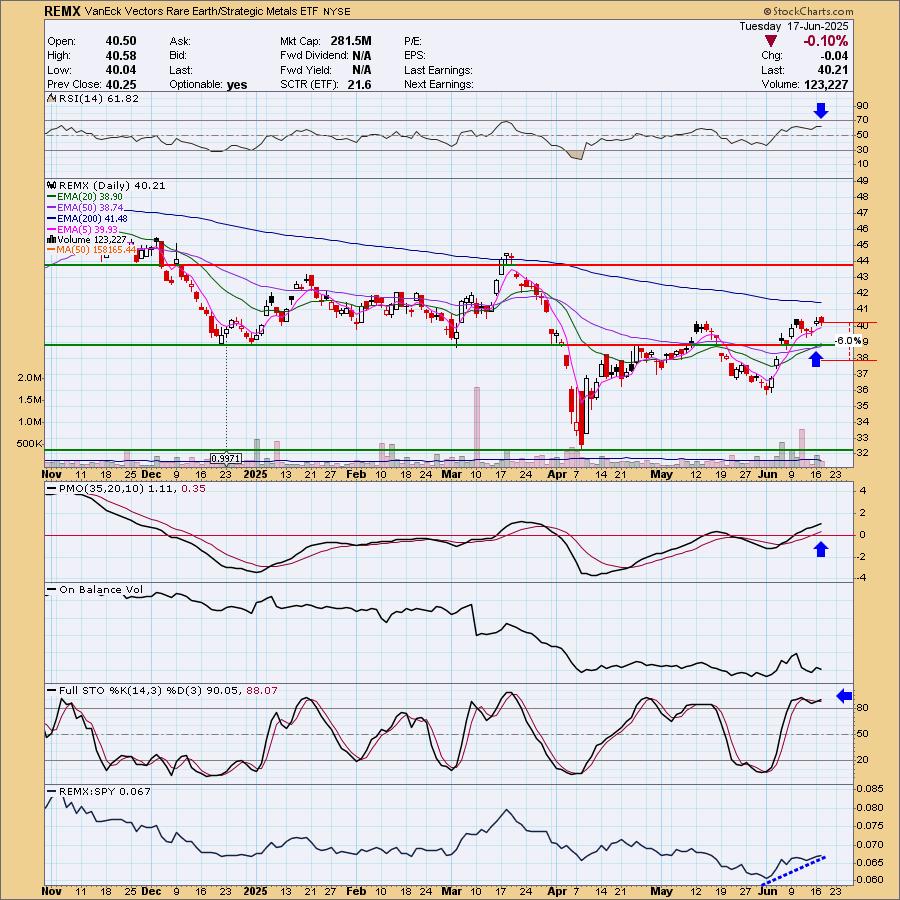
The "Darling" this week was Lumentum (LITE) which was up +4.52% this week. The "Dud" was the Rare Earth/Strategic Metals ETF (REMX). I was surprised by this Dud as I did like that chart quite a bit. We'll talk about what may've gone wrong later on.
I had time to run a couple of scans at the end of the trading room. Again we do have some overbought symbols that I found so we do have to be mindful when trading them. Some of the symbols are from sectors I'm not thrilled with, but the chart look awfully bullish right now: EXE, SITM, FLEX, SMTC, COOP, WCC and REXR. EXE was actually a requested symbol today, but it was a very favorable chart and deserves your attention.
Have a great weekend! See you next week for our final reports and trading room.
Good Luck & Good Trading,
Erin

Diamond Mine Trading Room:
RECORDING & DOWNLOAD LINK (6/20/2025):
Topic: DecisionPoint Diamond Mine (6/20/2025) LIVE Trading Room
Download & Recording LINK
Passcode: June#20th
REGISTRATION for 6/27/2025:
When: June 27, 2025 09:00 AM Pacific Time (US and Canada)
Topic: DecisionPoint Diamond Mine LIVE Trading Room
Register in advance for this webinar HERE
After registering, you will receive a confirmation email containing information about joining the webinar.
A few items about the spreadsheet: I've put on the spreadsheet whether the RSI is positive (green) or negative (red). The PMO column tells you if it is rising (green) or falling (red). Finally I've added my own "Sparkle Factor" that gives you my assessment going forward, bullish (green), bearish (red) or neutral (gray). The Sparkle Factor is basically my thoughts on whether I expect it to rise or fall. A neutral means it could really go either way so it could be added to a watch list. If you're in a stock I consider "neutral" going forward, the ball is in your court.
Darling:
Lumentum Holdings Inc. (LITE)
EARNINGS: 2025-08-13 (AMC)
Lumentum Holdings, Inc. engages in the provision of optical and photonic products. It operates through the Cloud and Networking, and Industrial Tech segments. The Cloud and Networking segment refers to a portfolio of optical and photonic components, modules, and subsystems. The Industrial Tech segment includes solid-state lasers, kilowatt-class fiber lasers, ultrafast lasers, diode lasers, and gas lasers. The company was founded on February 10, 2015 and is headquartered in San Jose, CA.
Predefined Scans Triggered: Elder Bar Turned Green, P&F Ascending Triple Top Breakout and P&F Double Top Breakout.
Below are the commentary & chart from Monday, 6/16:
"LITE is down -0.24% in after-hours trading. I liked the breakout and follow-through rally. It is also nice that it is holding a short- and intermediate-term rising trend. The RSI is not yet overbought. The PMO has surged (bottomed) above the signal line (hard to see so take my word for it). Stochastics are holding above 80 and have started to rise again. The group is performing alright, could be better. LITE is outperforming both the SPY and the group. The stop is set beneath support at 7.9% or $79.00."
Here is today's chart:
The chart is maturing well with an acceleration of the rally. We did get a bearish filled black candlestick so we may get a pause next week. The RSI is also overbought, another reason we could see a pause. Past that I would look for higher prices as price is making its way toward resistance and indicators are favorable. The PMO is flat above the zero line signifying pure strength. Stochastics are holding above 80. Relative strength continues to rise for the group and LITE.
Don't forget, on Thursdays I look at reader-requested symbols, so shoot me an email at erin@decisionpoint.com. I read every email I receive and try to answer them all!
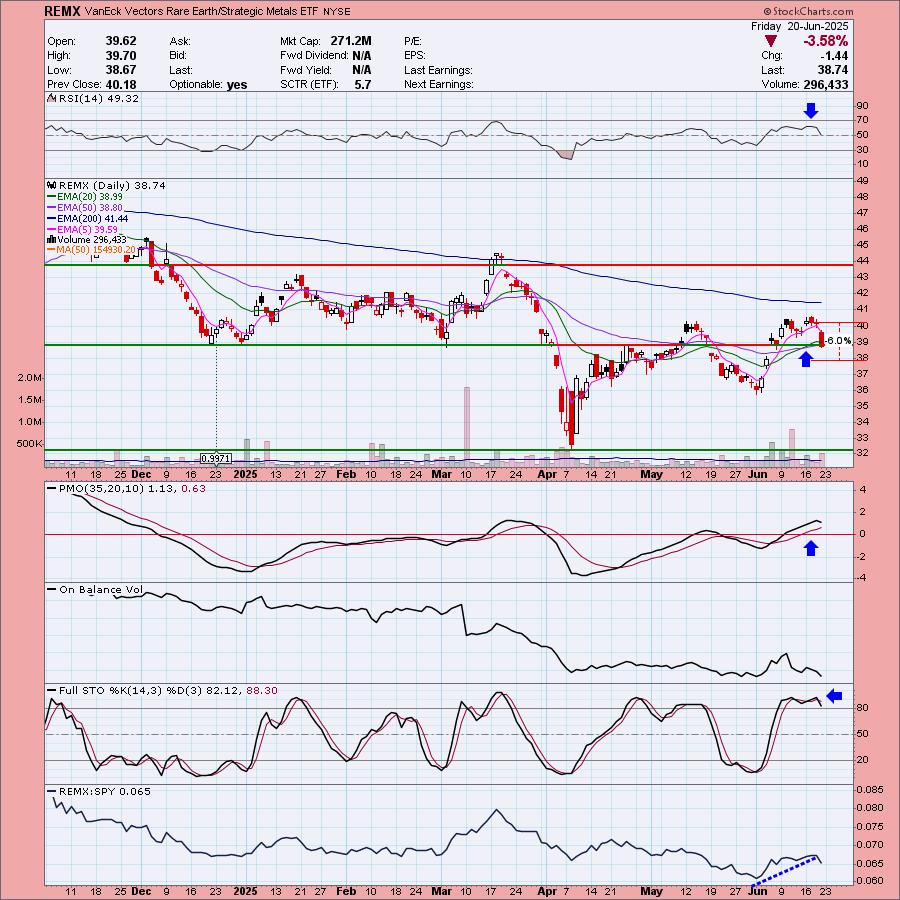
Dud:
VanEck Vectors Rare Earth/Strategic Metals ETF (REMX)
EARNINGS: N/A
REMX tracks an index of global companies that mine, refine, or recycle rare earth and strategic metals. Click HERE for more information.
Predefined Scans Triggered: Stocks in a New Uptrend (ADX).
Below are the commentary & chart from Tuesday, 6/17:
"REMX is down -0.21% in after-hours trading. We are in the process of getting a breakout. It looks like a tiny bull flag. We also have a new Silver Cross of the 20/50-day EMAs giving us an IT Trend Model BUY Signal. The RSI is holding in positive territory and is not overbought. The PMO is rising and has overcome its previous top. It is also on a Crossover BUY Signal. Stochastics look very bullish holding above 80. Relative strength is working in its favor. The stop doesn't have to be that deep, I chose 6% or $37.79."
Here is today's chart:
This one went south right after we picked it. If I had to point to something to blame, I would say that price was below the 200-day EMA. We can also see that relative strength was beginning to flatten out near term. I picked this one by eyeballing the ETF Tracker. It didn't come through on a scan. That could be the other problem. I was surprised by this move. We now have a confirmed bearish double top so I would avoid this one as it is likely to pull back further from here.
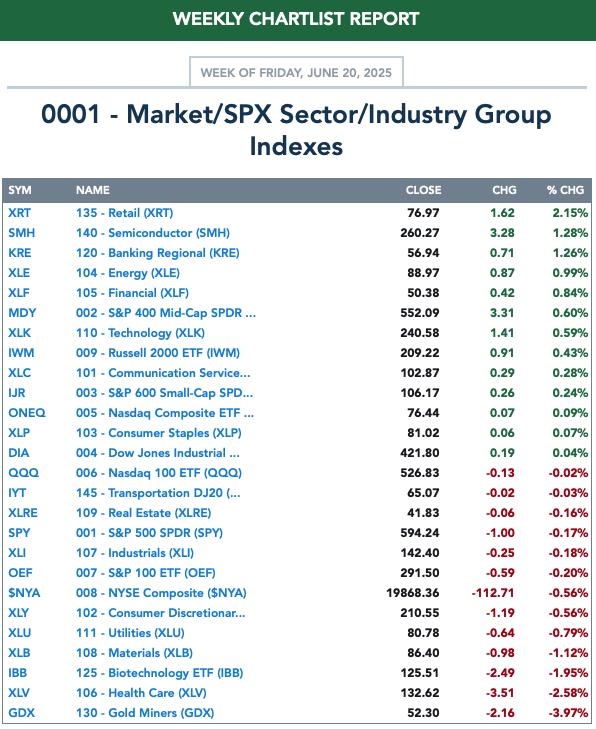
THIS WEEK's Performance:
DecisionPoint Market Scoreboard (Mechanical Trend Model Signals):
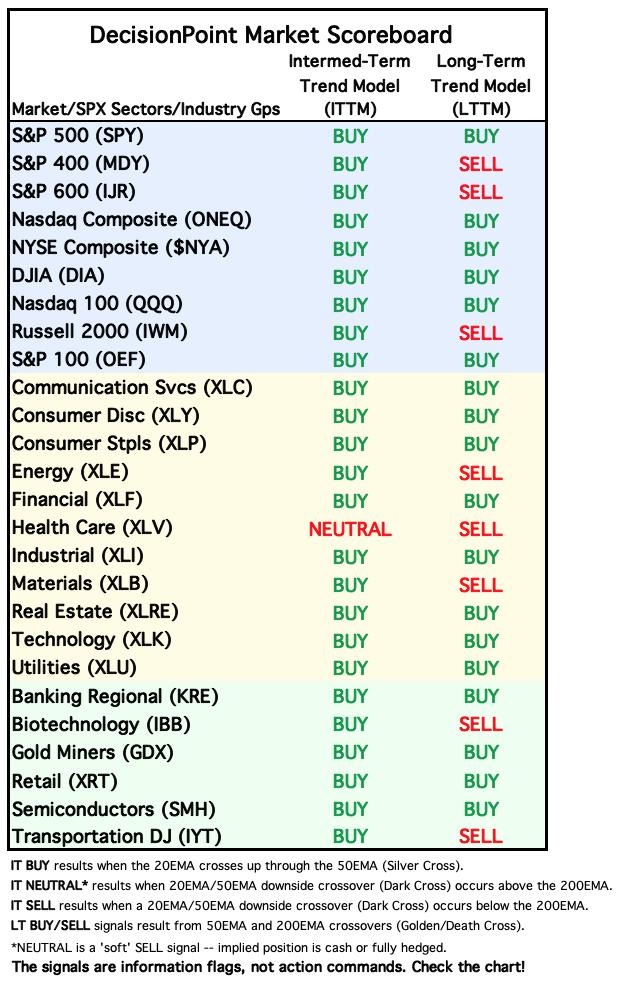
Friday signal changes are outlined in purple.
Click Here to view Carl's annotated "Under the Hood" ChartList!
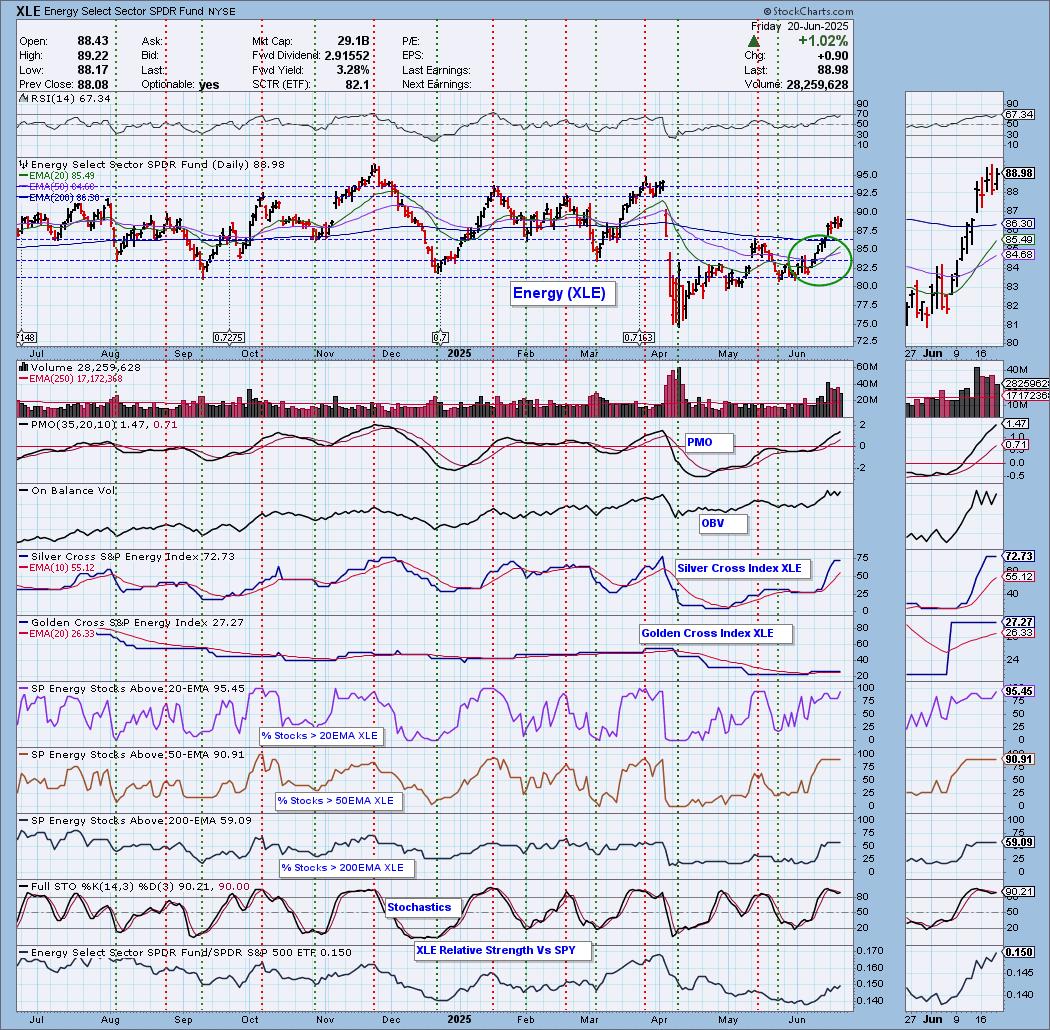
Sector to Watch: Energy (XLE)
XLE is the only sector holding a rising PMO. This speaks to market weakness right now and does seem to imply we'll get lower prices. This is a strong area of the market and we could see more rotation into this sector should the other sectors begin to see more damage. The RSI is not overbought yet despite this lengthy rally. The PMO is rising strongly on a Crossover BUY Signal. The Silver Cross Index is at a very high 73% reading and it is above its signal line giving us a BULLISH IT Bias. The Golden Cross Index is above it signal line so we have a BULLISH LT Bias as well. Participation is quite robust reading in the 90's for %Stocks > 20/50EMAs. Stochastics are rising again and they are above 80. Relative strength is of course excellent right now. Crude is getting close to overhead resistance, but we do think we'll see more upside out of XLE regardless.
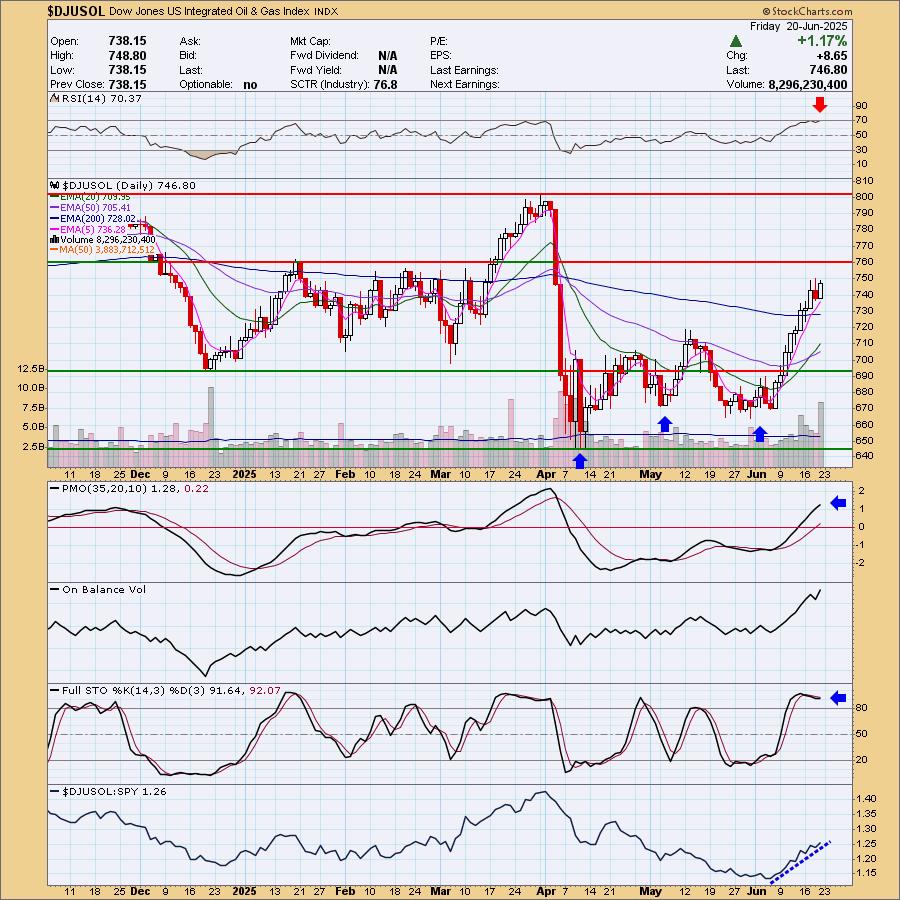
Industry Group to Watch: Integrated Oil & Gas ($DJUSOL)
If you want to trade this industry group, you could use the proxy XOP. Resistance is nearing and it is overbought so it isn't the most perfect chart ever. Still I see more upside ahead given the positive indicators. The PMO is rising strongly above the zero line on a Crossover BUY Signal. Stochastics are rising again and of course relative strength is off the charts right now. I did find some symbols to review. They too are mostly overbought, but I think that condition will persist longer: NGL, SSL, PSX, XOM, PBR and BRY.
Go to our Under the Hood ChartList on DecisionPoint.com to get an in-depth view of all the sectors. On StockCharts.com you can find the Industry Summary.
Good Luck & Good Trading!
- Erin
erin@decisionpoint.com
Full Disclosure: I'm 25% long, 0% short.
Watch the latest episode of the DecisionPoint Trading Room with Carl & Erin Swenlin HERE!
Technical Analysis is a windsock, not a crystal ball. --Carl Swenlin
NOTE: The stocks reported herein are from mechanical trading model scans that are based upon moving average relationships, momentum and volume. DecisionPoint analysis is then applied to get selections from the scans. The selections given should prompt readers to do a chart review using their own analysis process. This letter is not a call for a specific action to buy, sell or short any of the stocks provided. There are NO sure things or guaranteed returns on the selection of "diamonds in the rough."
Helpful DecisionPoint Links:
DecisionPoint Shared ChartList and DecisionPoint Chart Gallery
Price Momentum Oscillator (PMO)
Swenlin Trading Oscillators (STO-B and STO-V)
(c) Copyright 2025 DecisionPoint.com