
We had one reader send in symbols, but I also have been paying attention to an email group that I am in and they have presented various symbols over this week. I have two from the reader's submission and one from the subscriber email group (EWZ).
Yesterday it appeared that we might want to put on some hedges. I don't think it is a bad idea. The market looks very toppy right now. Be sure you have your stops set!
Thank you to the reader who sent in some requests. I'm covering DHT and INSW for you. Only one more Reader Request Day left, so take advantage and send your symbols in before next Thursday at 1p PT.
Tomorrow is a holiday, but the following morning is the Diamond Mine trading room. Be sure to sign up now!
Good Luck & Good Trading,
Erin
Today's "Diamonds in the Rough": DHT, EWZ and INSW.
Other requested symbols: EWJ, UMAC, PRZO, SEZL, AMD, NVGS and KNOP.

Diamond Mine Trading Room:
RECORDING & DOWNLOAD LINK (6/13/2025):
Topic: DecisionPoint Diamond Mine (6/13/2025) LIVE Trading Room
Download & Recording LINK
Passcode: June#13th
REGISTRATION for 6/20/2025:
When: June 20, 2025 09:00 AM Pacific Time (US and Canada)
Topic: DecisionPoint Diamond Mine LIVE Trading Room
Register in advance for this webinar HERE
After registering, you will receive a confirmation email containing information about joining the webinar.
Welcome to DecisionPoint Diamonds, wherein I highlight ten "Diamonds in the Rough" per week. These are selected from the results of my DecisionPoint Scans which search for stocks that could benefit from the trend and condition of the market. Remember, these are not recommendations to buy or sell, but are the most interesting of the stocks that surfaced in my scans. My objective is to save you the work of the initial, tedious culling process, but you need to apply your own analysis to see if these stocks pique your interest as well. There are no guaranteed winners here!
"Predefined Scans Triggered" are taken from StockCharts.com using the "Symbol Summary" option instead of a "SharpChart" on the workbench.
Stop levels are all rounded down.
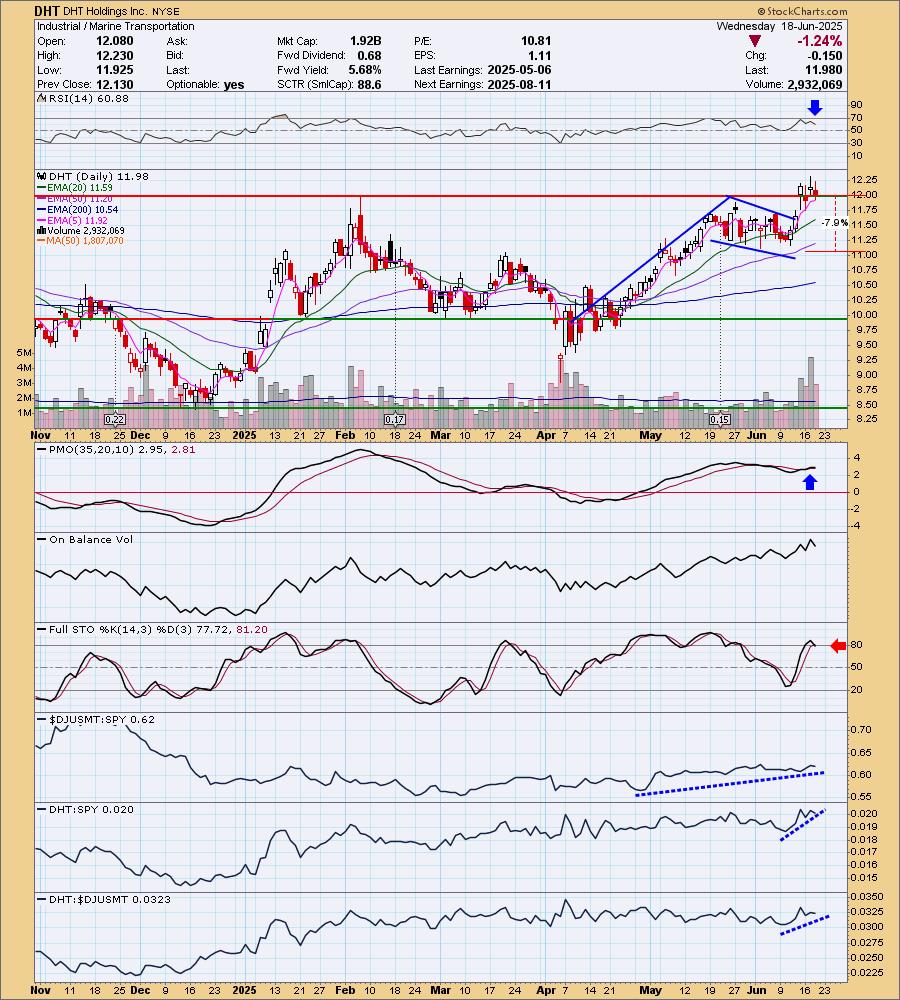
DHT Holdings Inc. (DHT)
EARNINGS: 2025-08-11 (AMC)
DHT Holdings, Inc. engages in the operation of a fleet of crude oil tankers. It operates through its integrated management companies in Monaco, Singapore, and Oslo, Norway. The company was founded in 2005 and is headquartered in Hamilton, Bermuda.
Predefined Scans Triggered: Elder Bar Turned Blue, P&F Double Top Breakout, P&F Triple Top Breakout and P&F Quadruple Top Breakout.
DHT is down -0.59% in after-hours trading. I liked the bull flag formation that was confirmed on the breakout above resistance. The RSI is not at all overbought and is in positive territory. The PMO is rising on a Crossover BUY Signal above the zero line. Stochastics did drop below 80, but price still looks strong enough to rally further. The group is outperforming the SPY. DHT is already outperforming both the group and the SPY. The stop is set beneath support at 7.9% or $11.03.
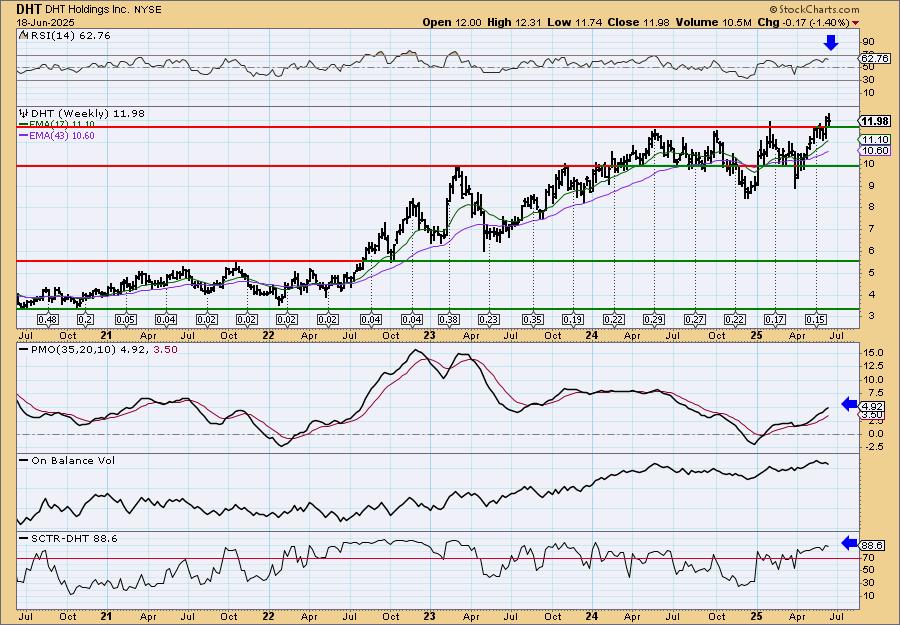
The weekly chart is very bullish right now. We have a strong breakout move. This is combined with a positive and not overbought weekly RSI and a rising weekly PMO on a Crossover BUY Signal above the zero line. The StockCharts Technical Rank (SCTR) is inside the hot zone*. Consider a 17% upside target to $14.02.
*If a stock is in the "hot zone" above 70, it implies that it is stronger than 70% of its universe (large-, mid-, small-caps and ETFs) primarily in the intermediate to long terms.
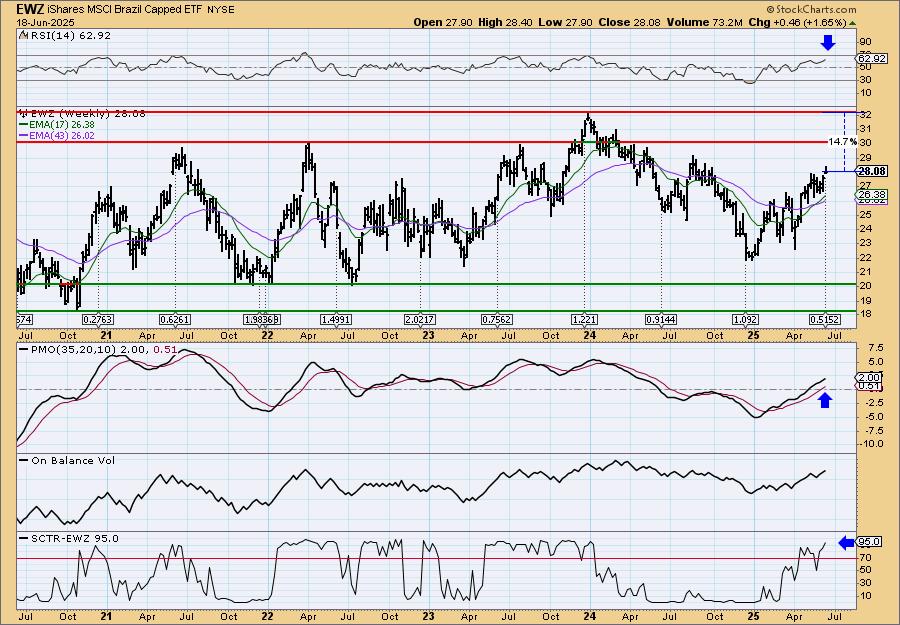
iShares MSCI Brazil Capped ETF (EWZ)
EARNINGS: N/A
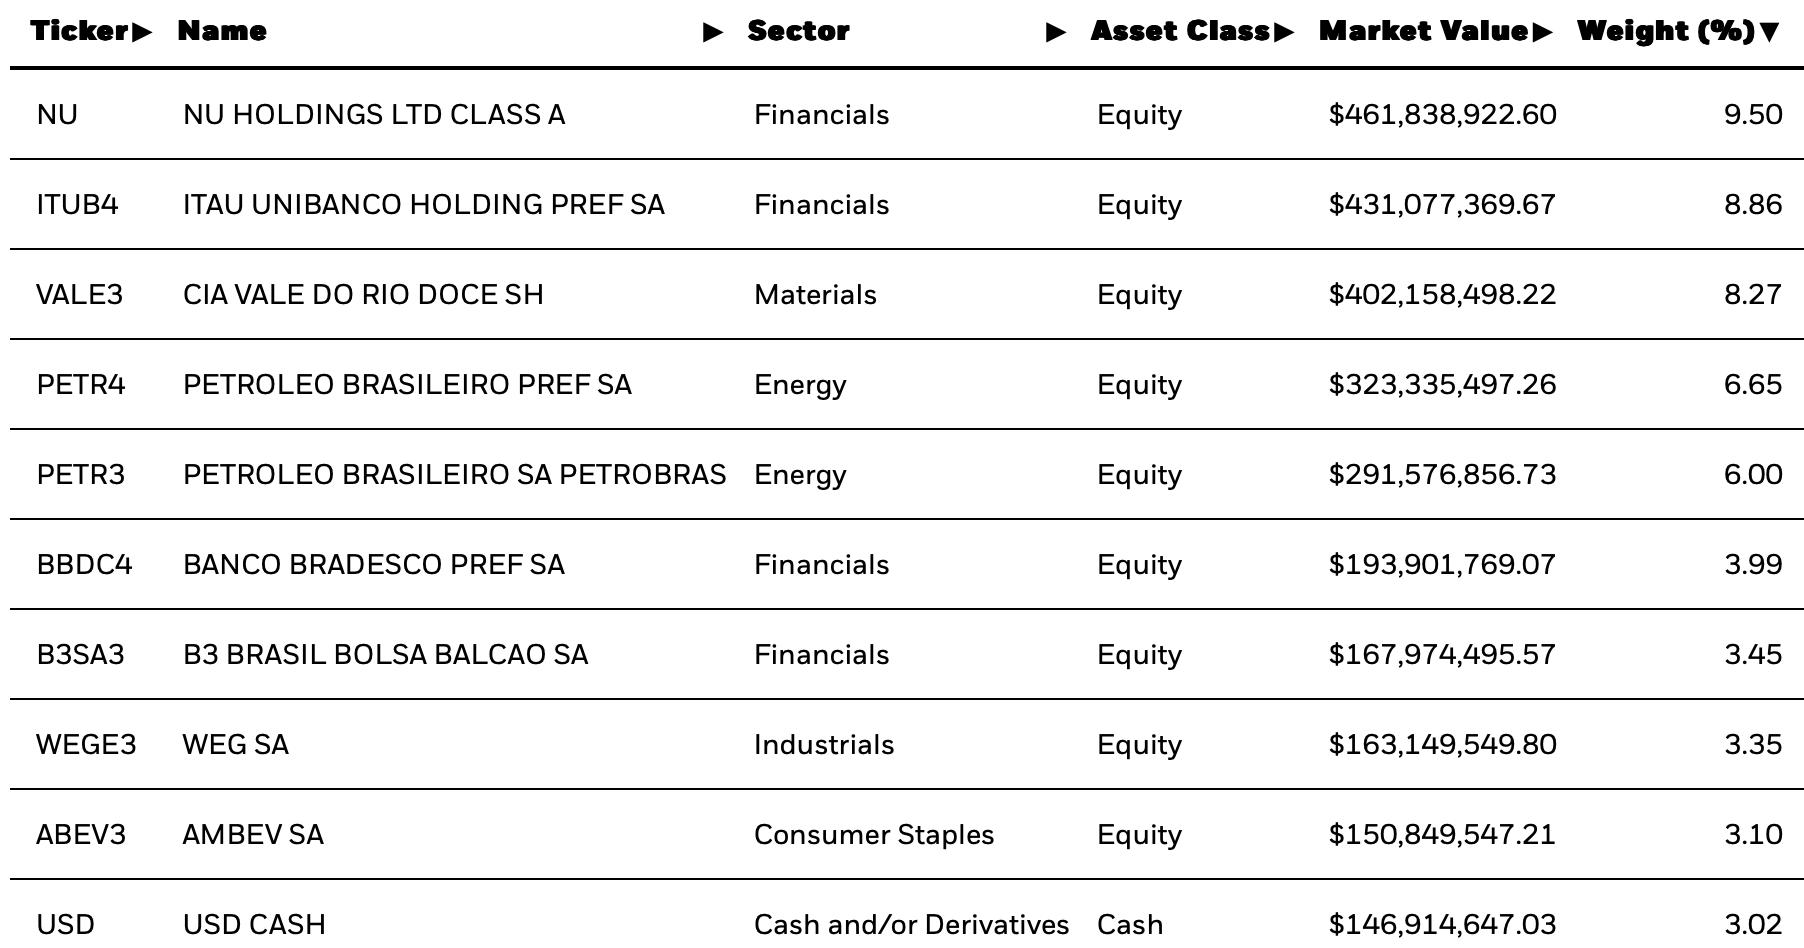
EWZ tracks a market-cap-weighted index of Brazilian firms covering the entire market-cap spectrum. Click HERE for more information.
Predefined Scans Triggered: P&F Double Top Breakout.
EWZ is up +0.11% in after-hours trading. I liked the breakout from the prior trading range. It is also in a nice rising trend well above all key moving averages. The RSI is positive and not overbought. The PMO is rising on a Crossover BUY Signal well above the zero line. Stochastics are holding above 80. The ETF is outperforming the SPY. The stop is set below support at 6.9% or $26.14.
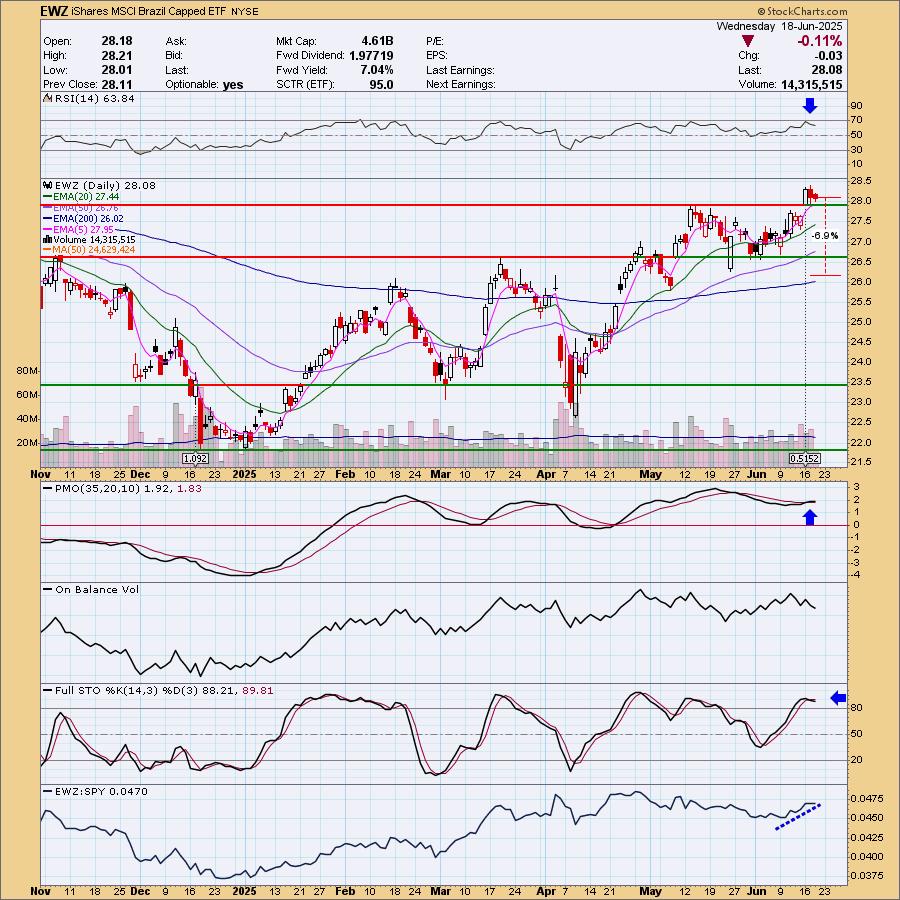
It's in a very large trading range right now. If it can get back to the top of the range, it would be a nice 14.7% gain, but I do think we could get a breakout there. The weekly RSI is positive and not at all overbought. The weekly PMO is rising above the zero line on a Crossover BUY Signal. The SCTR is at the top of the hot zone so this does have a nice intermediate-term look to it.
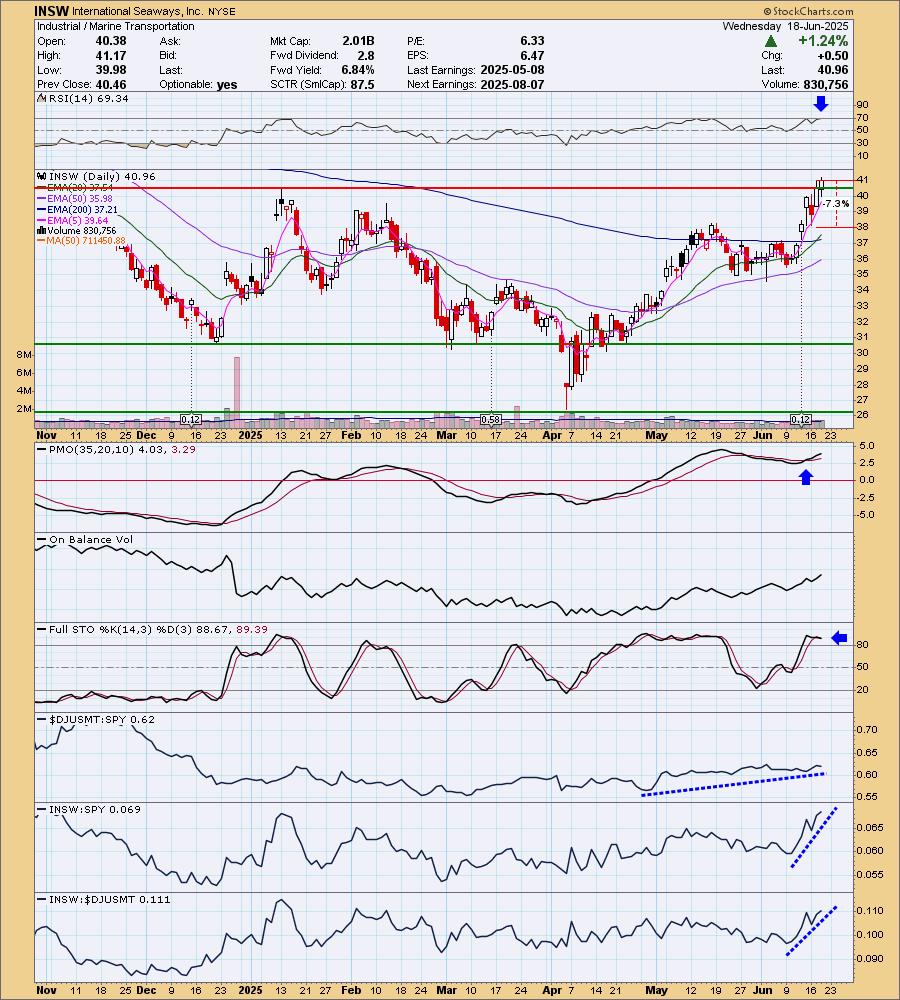
International Seaways, Inc. (INSW)
EARNINGS: 2025-08-07 (BMO)
International Seaways, Inc. engages in the transportation of crude oil and petroleum products. It operates through the following segments: Crude Tankers and Product Carriers. The Crude Tankers segment consists of a fleet of vessels that transport unrefined petroleum. The Product Carriers segment focuses on crude and refined petroleum products. The company was founded on December 6, 1999 and is headquartered in New York, NY.
Predefined Scans Triggered: Stocks in a New Uptrend and P&F Double Top Breakout.
INSW is up +0.20% in after-hours trading. I liked the strong rally that has led to a breakout move. It is getting a little overbought so it may pause here soon. The PMO is on a Crossover BUY Signal that occurred well above the zero line suggesting strength. Stochastics are holding above 80 signifying internal strength. The group has been outperforming for some time. INSW is outperforming the group and the SPY in a big way. I've set the stop below the May top at 7.3% or $37.96.
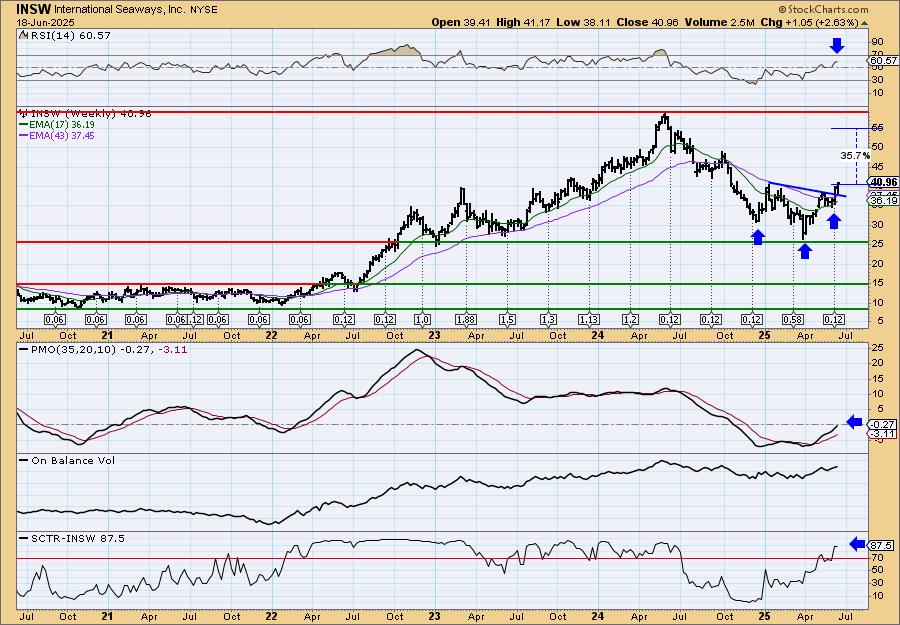
I spotted a reverse head and shoulders on the weekly chart. The pattern has been confirmed with a breakout above the downward sloping neckline. The weekly RSI is positive and not at all overbought. The weekly PMO is rising on a Crossover BUY Signal and should get above the zero line soon. The SCTR is inside the hot zone. I've set upside potential at the minimum upside target of the reverse head and shoulders pattern.
Don't forget, on Thursdays I look at reader-requested symbols, click HERE to send me an email. I read every email I receive and try to answer them all!
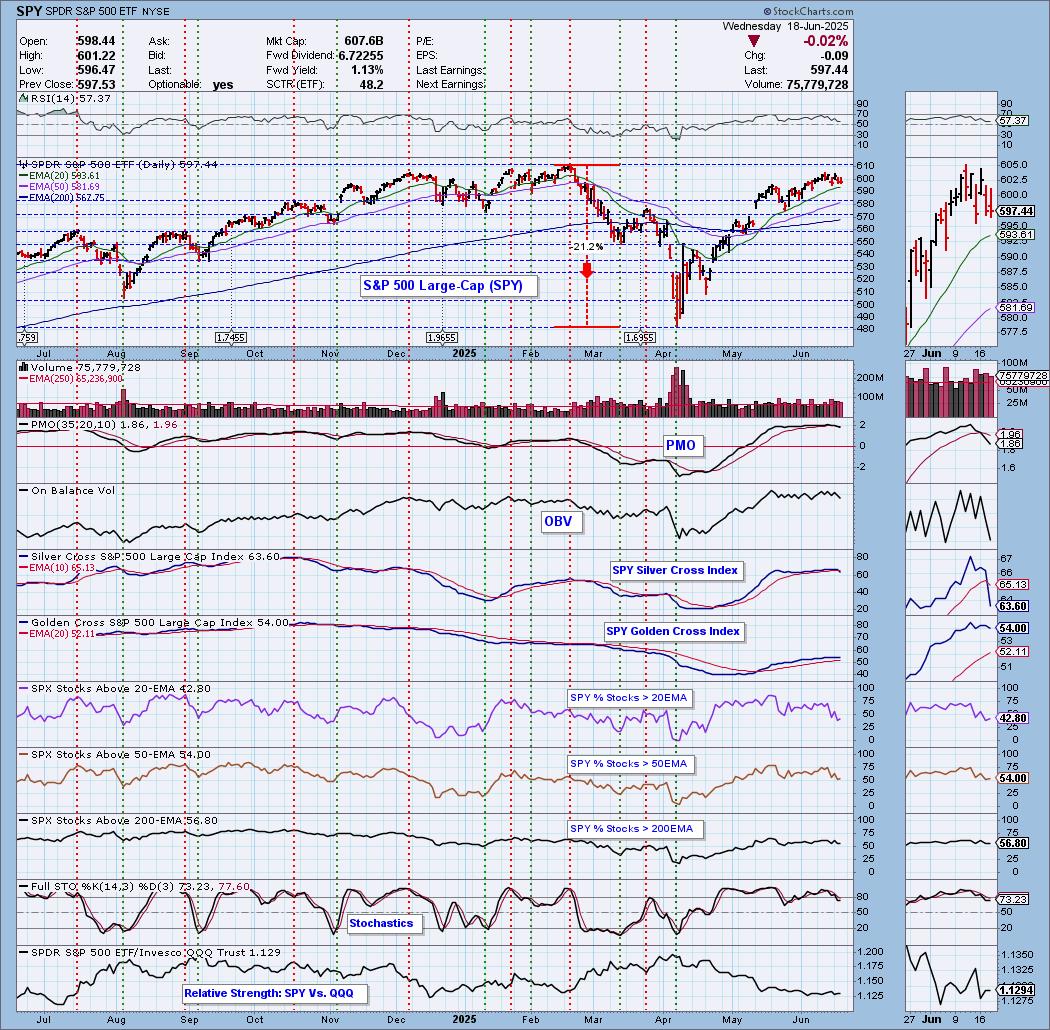
Current Market Outlook:
Market Environment: It is important to consider the odds for success by assessing the market tides. The following chart uses different methodologies for objectively showing the depth and trend of participation for intermediate- and long-term time frames.
- The Silver Cross Index (SCI) shows the percentage of SPX stocks on IT Trend Model BUY signals (20-EMA > 50-EMA)
- The Golden Cross Index (GCI) shows the percentage of SPX stocks on LT Trend Model BUY signals (50-EMA > 200-EMA)
Don't forget that as a "Diamonds" member, you have access to our "Under the Hood" curated ChartList on DecisionPoint.com. You'll find it under "Members Only" links on the left side on the Blogs and Links Page.
Here is the current chart:
Full Disclosure: I am 60% long, 0% short.
I'm required to disclose if I currently own a stock I mention and/or may buy/short it within the next 72 hours.
"Technical Analysis is a windsock, not a crystal ball." - Carl Swenlin
(c) Copyright 2025 DecisionPoint.com
NOTE: The stocks reported herein are from mechanical trading model scans that are based upon moving average relationships, momentum and volume. DecisionPoint analysis is then applied to get five selections from the scans. The selections given should prompt readers to do a chart review using their own analysis process. This letter is not a call for a specific action to buy, sell or short any of the stocks provided. There are NO sure things or guaranteed returns on the daily selection of "Diamonds in the Rough."
Regarding BUY/SELL Signals: The signal status reported herein is based upon mechanical trading model signals and crossovers. They define the implied bias of the price index/stock based upon moving average relationships and momentum, but they do not necessarily call for a specific action. They are information flags that should prompt chart review. Further, they do not call for continuous buying or selling during the life of the signal. For example, a BUY signal will probably (but not necessarily) return the best results if action is taken soon after the signal is generated. Additional opportunities for buying may be found as price zigzags higher, but the trader must look for optimum entry points. Conversely, exit points to preserve gains (or minimize losses) may be evident before the model mechanically closes the signal.
Helpful DecisionPoint Links:
Price Momentum Oscillator (PMO)
Swenlin Trading Oscillators (STO-B and STO-V)
For more links, go to DecisionPoint.com