
It was an interesting ETF Day. The scans did not produce much at all, but what they did send was plenty of inverse ETFs for the major indexes. We could be a turning point in the market given the appearance of all of these inverse ETFs. I didn't include an index inverse, but I did include the leveraged inverse for Real Estate. I was tempted to do SDOW or RWM, but ultimately I decided that Real Estate didn't look that good and could fall even if the market inches its way higher.
The other two ETFs I picked were from visual inspection of our ETF Tracker. Silver broke out today and does look poised to move higher from here. The Rare Earth ETF also looked bullish to me. Many of those in our ETF Tracker show declining PMOs, another reason to be especially cautious right now.
Reader Request Day is tomorrow! Be sure to send in some symbols when you can. I'm always happy to find stocks from the scans, but it is always fun to see what symbols are interesting to you.
Good Luck & Good Trading,
Erin
Today's "Diamonds in the Rough": DRV, REMX and SLV.
Runner-ups: SDOW and RWM.

Diamond Mine Trading Room:
RECORDING & DOWNLOAD LINK (6/13/2025):
Topic: DecisionPoint Diamond Mine (6/13/2025) LIVE Trading Room
Download & Recording LINK
Passcode: June#13th
REGISTRATION for 6/20/2025:
When: June 20, 2025 09:00 AM Pacific Time (US and Canada)
Topic: DecisionPoint Diamond Mine LIVE Trading Room
Register in advance for this webinar HERE
After registering, you will receive a confirmation email containing information about joining the webinar.
Welcome to DecisionPoint Diamonds, wherein I highlight ten "Diamonds in the Rough" per week. These are selected from the results of my DecisionPoint Scans which search for stocks that could benefit from the trend and condition of the market. Remember, these are not recommendations to buy or sell, but are the most interesting of the stocks that surfaced in my scans. My objective is to save you the work of the initial, tedious culling process, but you need to apply your own analysis to see if these stocks pique your interest as well. There are no guaranteed winners here!
"Predefined Scans Triggered" are taken from StockCharts.com using the "Symbol Summary" option instead of a "SharpChart" on the workbench.
Stop levels are all rounded down.
Direxion Daily Real Estate Bear 3x Shares (DRV)
EARNINGS: N/A
DRV provides 3x leveraged inverse exposure to an index that captures large cap equities of the US real estate segment. Click HERE for more information.
Predefined Scans Triggered: Elder Bar Turned Green.
DRV is up +0.78% in after-hours trading. In this case, we are playing the trading range. Price is just coming off a reversal that occurred above support. It looks headed to the top of the range now. The RSI is not positive yet so this is early. The PMO is nearing a Crossover BUY Signal. Stochastics are rising strongly toward positive territory. This one came through on one of the scans. Relative strength does appear to be picking up slightly. The stop doesn't have to be that deep even though this is an inverse. Basically, we won't want it if it breaks support. So I set the stop at 7.8% or $23.64.
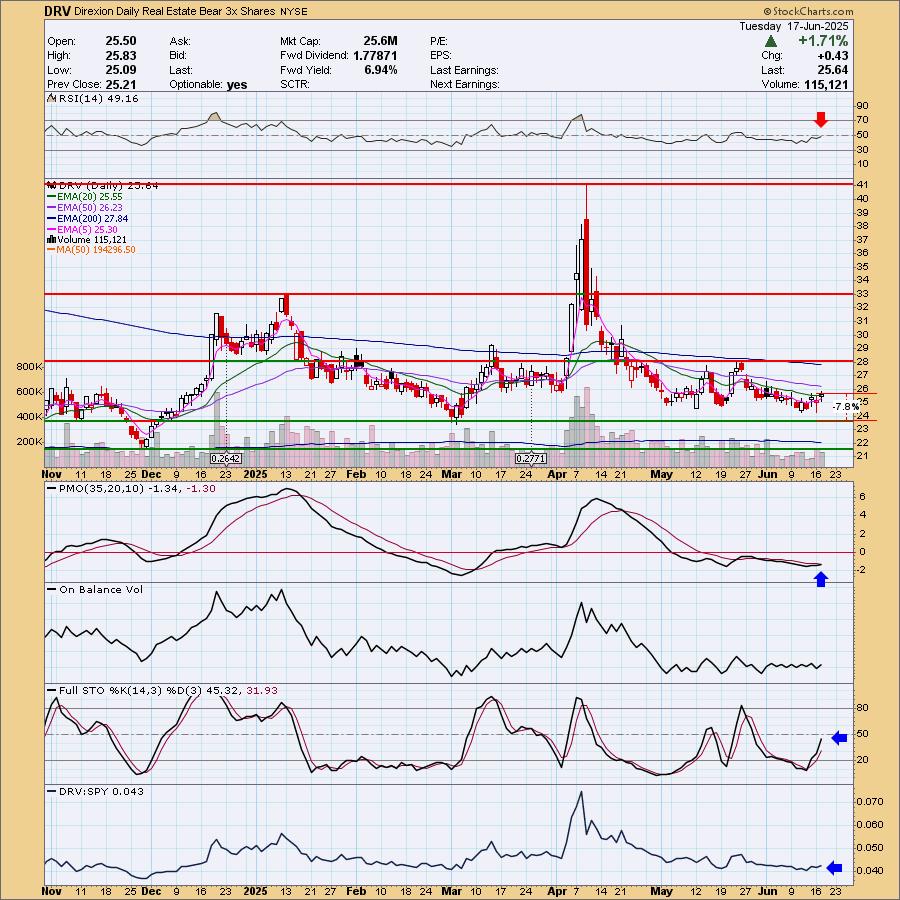
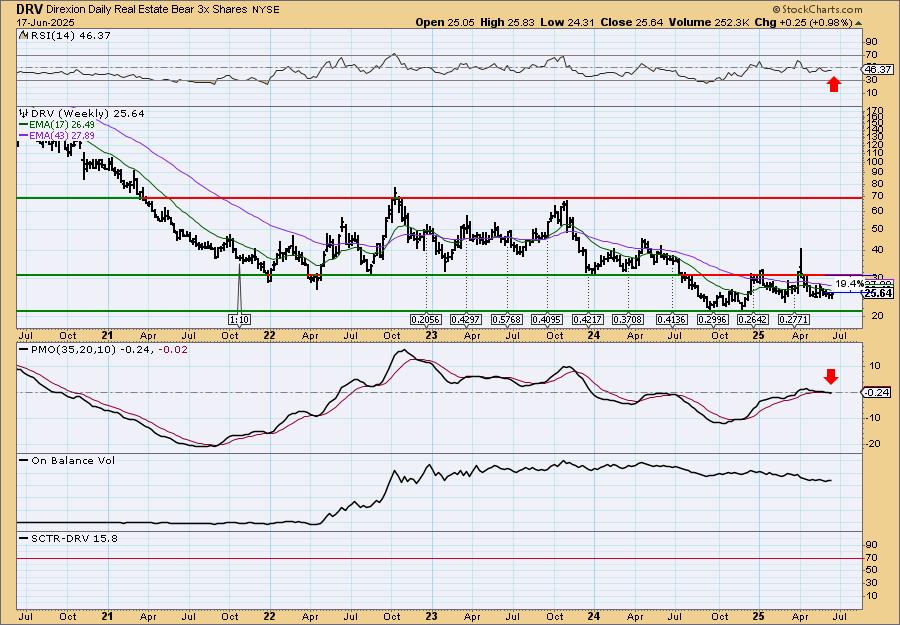
The weekly chart doesn't look good at all, but leveraged investments should be very short-term anyway. I wouldn't hold this too long. It's a hedge against a weak market. The weekly RSI is negative. The weekly PMO is falling on a Crossover SELL Signal. There is no StockCharts Technical Rank (SCTR) available to look at, but I could guarantee that it would not be in the hot zone*.
*If a stock is in the "hot zone" above 70, it implies that it is stronger than 70% of its universe (large-, mid-, small-caps and ETFs) primarily in the intermediate to long terms.
VanEck Vectors Rare Earth/Strategic Metals ETF (REMX)
EARNINGS: N/A
REMX tracks an index of global companies that mine, refine, or recycle rare earth and strategic metals. Click HERE for more information.
Predefined Scans Triggered: Stocks in a New Uptrend (ADX).
REMX is down -0.21% in after-hours trading. We are in the process of getting a breakout. It looks like a tiny bull flag. We also have a new Silver Cross of the 20/50-day EMAs giving us an IT Trend Model BUY Signal. The RSI is holding in positive territory and is not overbought. The PMO is rising and has overcome its previous top. It is also on a Crossover BUY Signal. Stochastics look very bullish holding above 80. Relative strength is working in its favor. The stop doesn't have to be that deep, I chose 6% or $37.79.
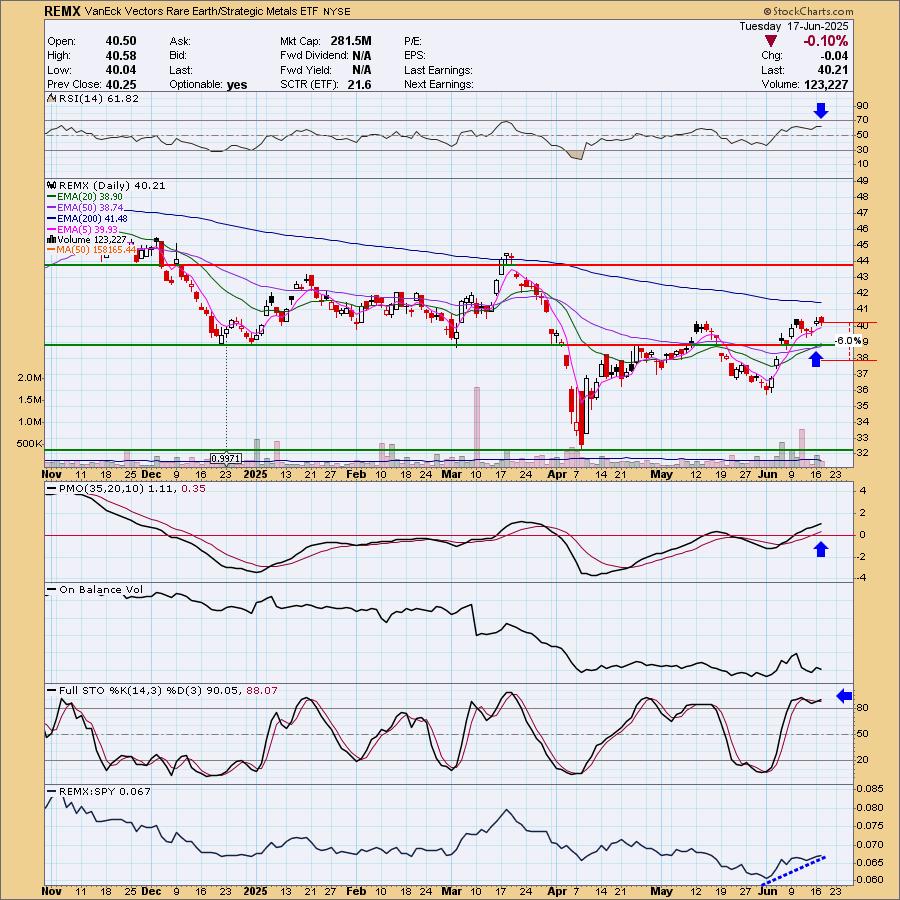
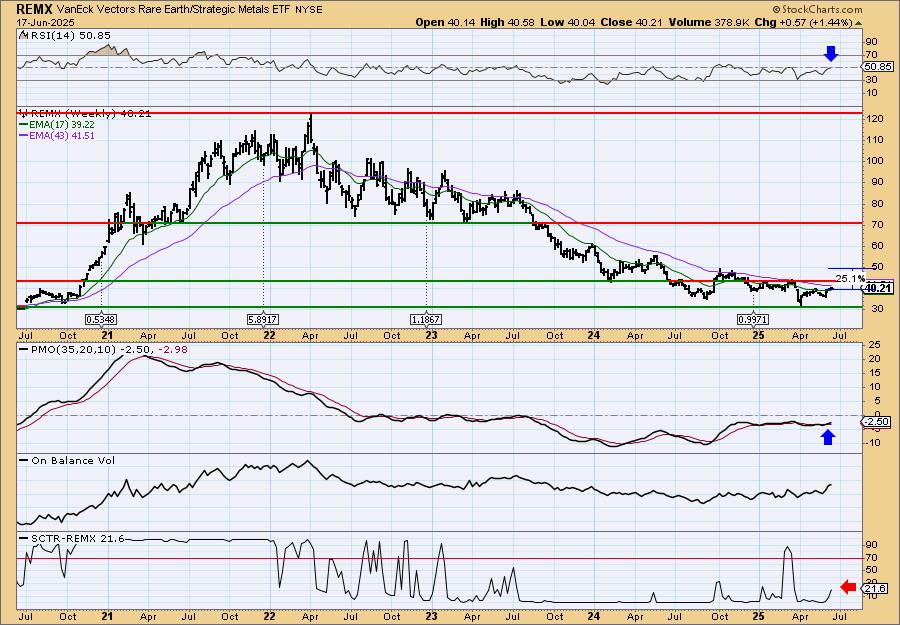
We still see a declining trend on the weekly chart so we're looking for a breakout. The weekly RSI just hit positive territory. The weekly PMO is rising on a Crossover BUY Signal. The SCTR is not in the hot zone, but is traveling very quickly higher. I'm looking for a move to the late 2024 high.
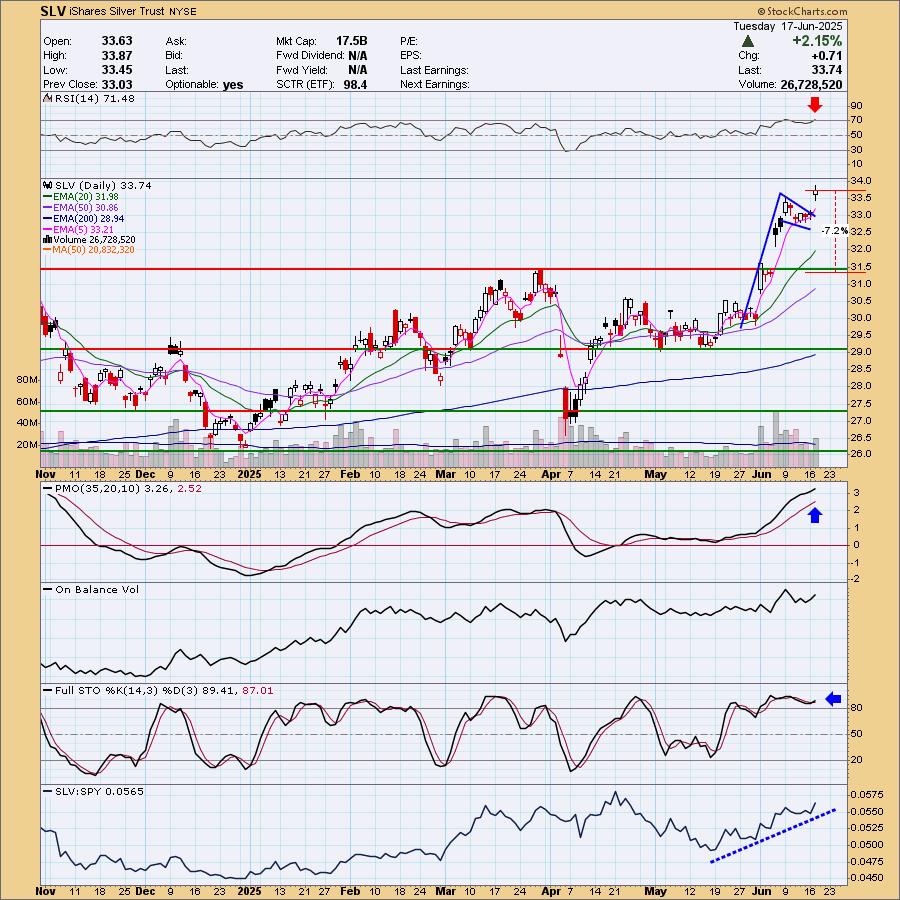
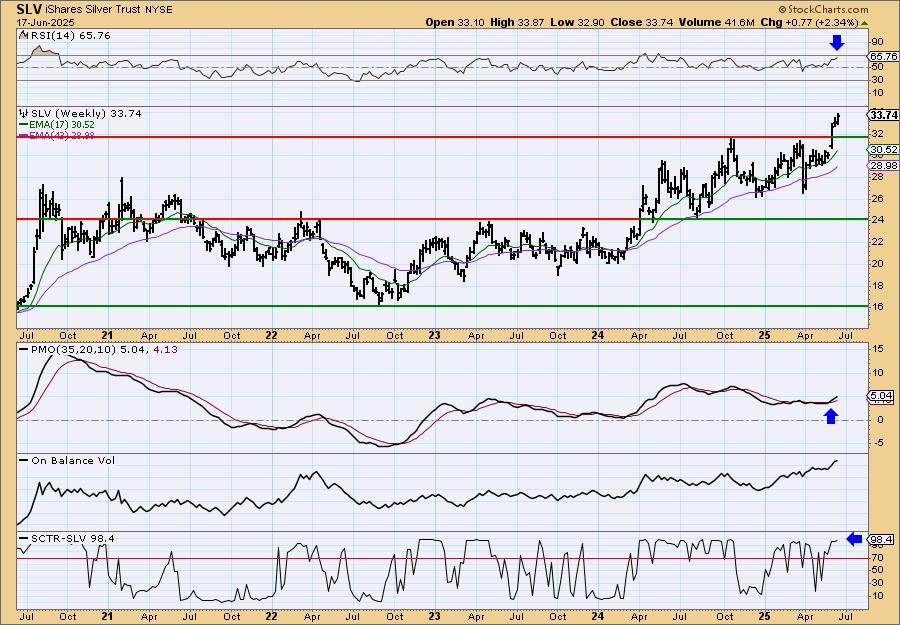
iShares Silver Trust (SLV)
EARNINGS: N/A
SLV tracks the silver spot price, less expenses and liabilities, using silver bullion held in London. Click HERE for more information.
Predefined Scans Triggered: Elder Bar Turned Green, Moved Above Upper Price Channel, New CCI Buy Signals, P&F Double Top Breakout, P&F Triple Top Breakout and New 52-week Highs.
SLV is up +0.06% in after-hours trading. The breakout from the bull flag caught my eye. I remain bearish on the Dollar so we should see more upside for both Gold and Silver. Silver seems to really be catching up to Gold. Unfortunately we do have an overbought RSI so we could see some consolidation ahead. The PMO is rising strongly well above the zero line. Stochastics have reversed higher above 80. Relative strength is working in its favor right now. The stop is set beneath strong support at 7.2% or $31.31.
The breakout is very bullish on the weekly chart. We have a solid rising trend and a breakout. The weekly RSI is not overbought. The weekly PMO is rising on a Crossover BUY Signal above the zero line. There is a lot of internal strength. The SCTR is at the top of the hot zone. Consider a 17% upside target to $39.47.
Don't forget, on Thursdays I look at reader-requested symbols, click HERE to send me an email. I read every email I receive and try to answer them all!
Current Market Outlook:
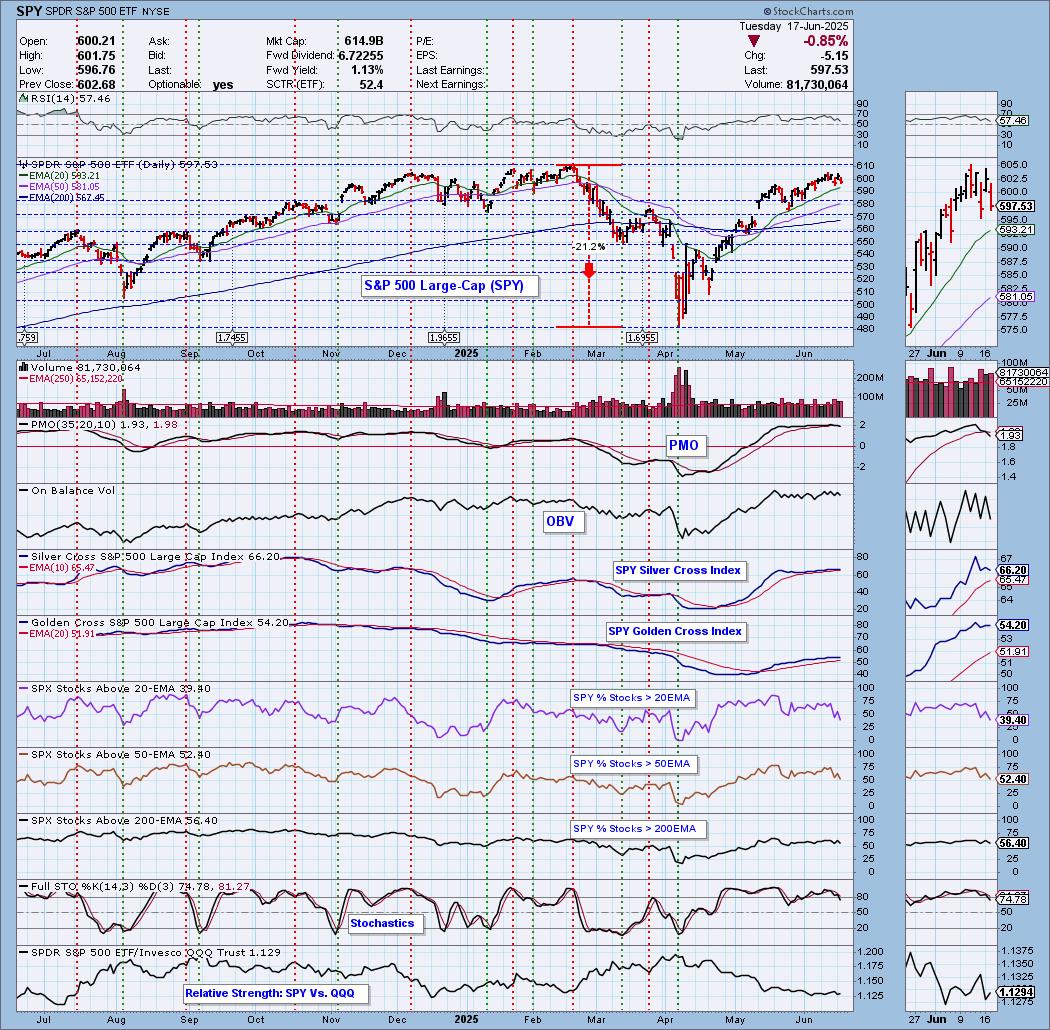
Market Environment: It is important to consider the odds for success by assessing the market tides. The following chart uses different methodologies for objectively showing the depth and trend of participation for intermediate- and long-term time frames.
- The Silver Cross Index (SCI) shows the percentage of SPX stocks on IT Trend Model BUY signals (20-EMA > 50-EMA)
- The Golden Cross Index (GCI) shows the percentage of SPX stocks on LT Trend Model BUY signals (50-EMA > 200-EMA)
Don't forget that as a "Diamonds" member, you have access to our "Under the Hood" curated ChartList on DecisionPoint.com. You'll find it under "Members Only" links on the left side on the Blogs and Links Page.
Here is the current chart:
Full Disclosure: I am 60% long, 0% short. Contemplating adding DRV as a hedge.
I'm required to disclose if I currently own a stock I mention and/or may buy/short it within the next 72 hours.
"Technical Analysis is a windsock, not a crystal ball." - Carl Swenlin
(c) Copyright 2025 DecisionPoint.com
NOTE: The stocks reported herein are from mechanical trading model scans that are based upon moving average relationships, momentum and volume. DecisionPoint analysis is then applied to get five selections from the scans. The selections given should prompt readers to do a chart review using their own analysis process. This letter is not a call for a specific action to buy, sell or short any of the stocks provided. There are NO sure things or guaranteed returns on the daily selection of "Diamonds in the Rough."
Regarding BUY/SELL Signals: The signal status reported herein is based upon mechanical trading model signals and crossovers. They define the implied bias of the price index/stock based upon moving average relationships and momentum, but they do not necessarily call for a specific action. They are information flags that should prompt chart review. Further, they do not call for continuous buying or selling during the life of the signal. For example, a BUY signal will probably (but not necessarily) return the best results if action is taken soon after the signal is generated. Additional opportunities for buying may be found as price zigzags higher, but the trader must look for optimum entry points. Conversely, exit points to preserve gains (or minimize losses) may be evident before the model mechanically closes the signal.
Helpful DecisionPoint Links:
Price Momentum Oscillator (PMO)
Swenlin Trading Oscillators (STO-B and STO-V)
For more links, go to DecisionPoint.com