
Well, we've finally reached the end of an era. DecisionPoint.com will close its doors after our last reports today. You will have an opportunity to view the reports up until June 30th. At that time all subscriptions will be canceled. For annual subscribers, you will receive an email with confirmation that your account is closed. If your email shows a "CREDIT" for your prorated refund, be aware that we will be sending you a check. Otherwise the email will note that your credit card has been refunded.
You may want to download some of the charts in our ChartLists on the website. StockCharts members can click on the charts from our list and they will come up in the charting workbench. From there you can save the charts to your own account. We plan on making some of the charts public on StockCharts.com. We'll announce that in the free DecisionPoint blog on StockCharts if it happens.
Be sure to sign up to receive notifications when our StockCharts.com DecisionPoint blog publishes. If you click on the DecisionPoint blog on StockCharts, you'll find a box to put your email address in to get notifications. We won't publish there very often, but when we do, you'll want to be notified.
It has been our distinct pleasure to have served you over the years. Thank you for your messages of thanks and encouragement on our retirement. We are very proud of what we have accomplished since we opened our doors in the 1990's. We especially thank you for your kind support over the years. Thank you again for being a part of our journey. -- Erin
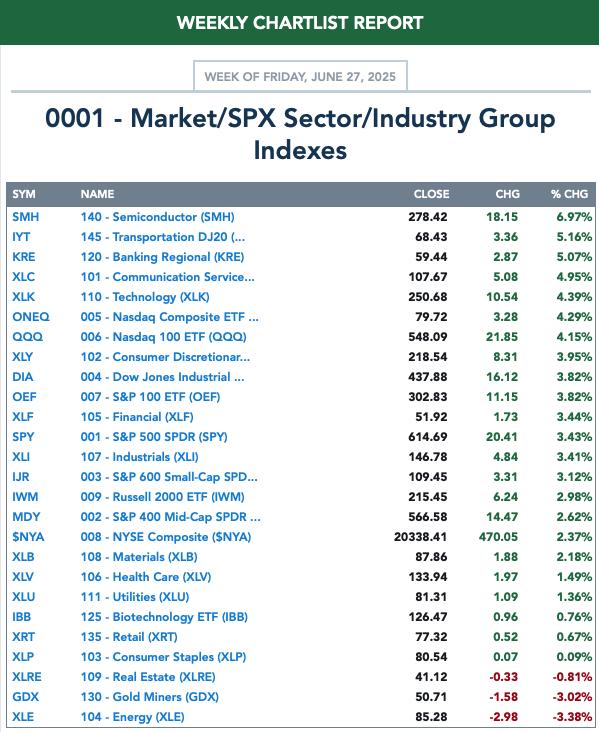
It was a good week for "Diamonds in the Rough", a nice swan song. All but reader requests were up on the week with our "Darling" up +4.15% since being picked. The "Dud" for the week was yesterday's SMCI pick which was down -3.43% today. All of the stocks/ETFs I picked this week look good moving forward. I would just say that you may not want to enter those that are overbought on the RSI right now.
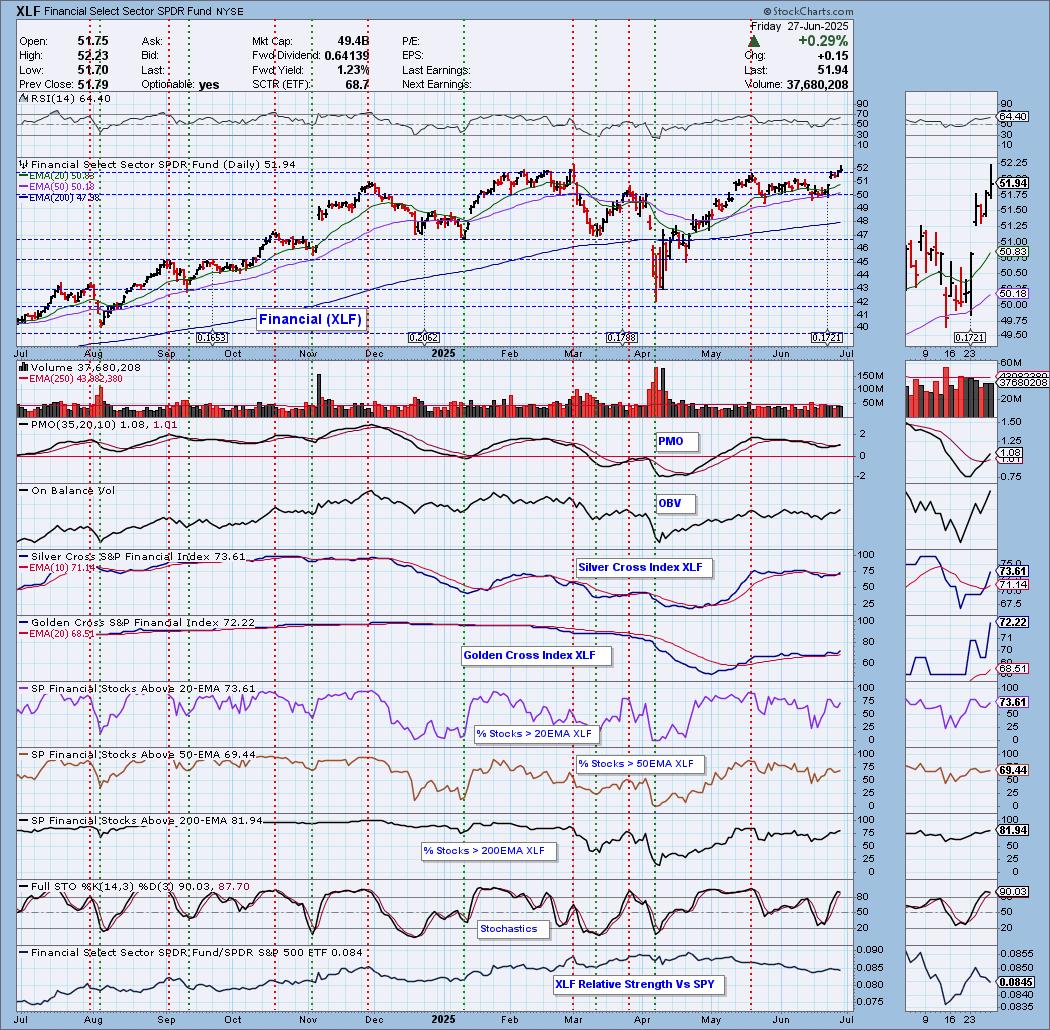
The Sector to Watch is Financials (XLF). On ETF day this and other Financials ETFs came up in the scans. We also have new momentum. Close second was Industrials (XLI).
The Industry Group to Watch is Life Insurance. I like how this group is shaping up. I found some symbols that might interest you from the group: ING, MFC, VOYA, PFG, MET and PRI.
I had time to run a few scans at the end of the program and I found some very interesting symbols for you to look at going into next week: MPWR, KD, SLM, FLR, CAKE and IRDM.
Thank you again for being Diamonds subscribers! Onward and upward!
Good Luck & Good Trading,
Erin

Diamond Mine Trading Room:
RECORDING & DOWNLOAD LINK (6/20/2025):
Topic: DecisionPoint Diamond Mine (6/20/2025) LIVE Trading Room
Download & Recording LINK
Passcode: June#27th
A few items about the spreadsheet: I've put on the spreadsheet whether the RSI is positive (green) or negative (red). The PMO column tells you if it is rising (green) or falling (red). Finally I've added my own "Sparkle Factor" that gives you my assessment going forward, bullish (green), bearish (red) or neutral (gray). The Sparkle Factor is basically my thoughts on whether I expect it to rise or fall. A neutral means it could really go either way so it could be added to a watch list. If you're in a stock I consider "neutral" going forward, the ball is in your court.
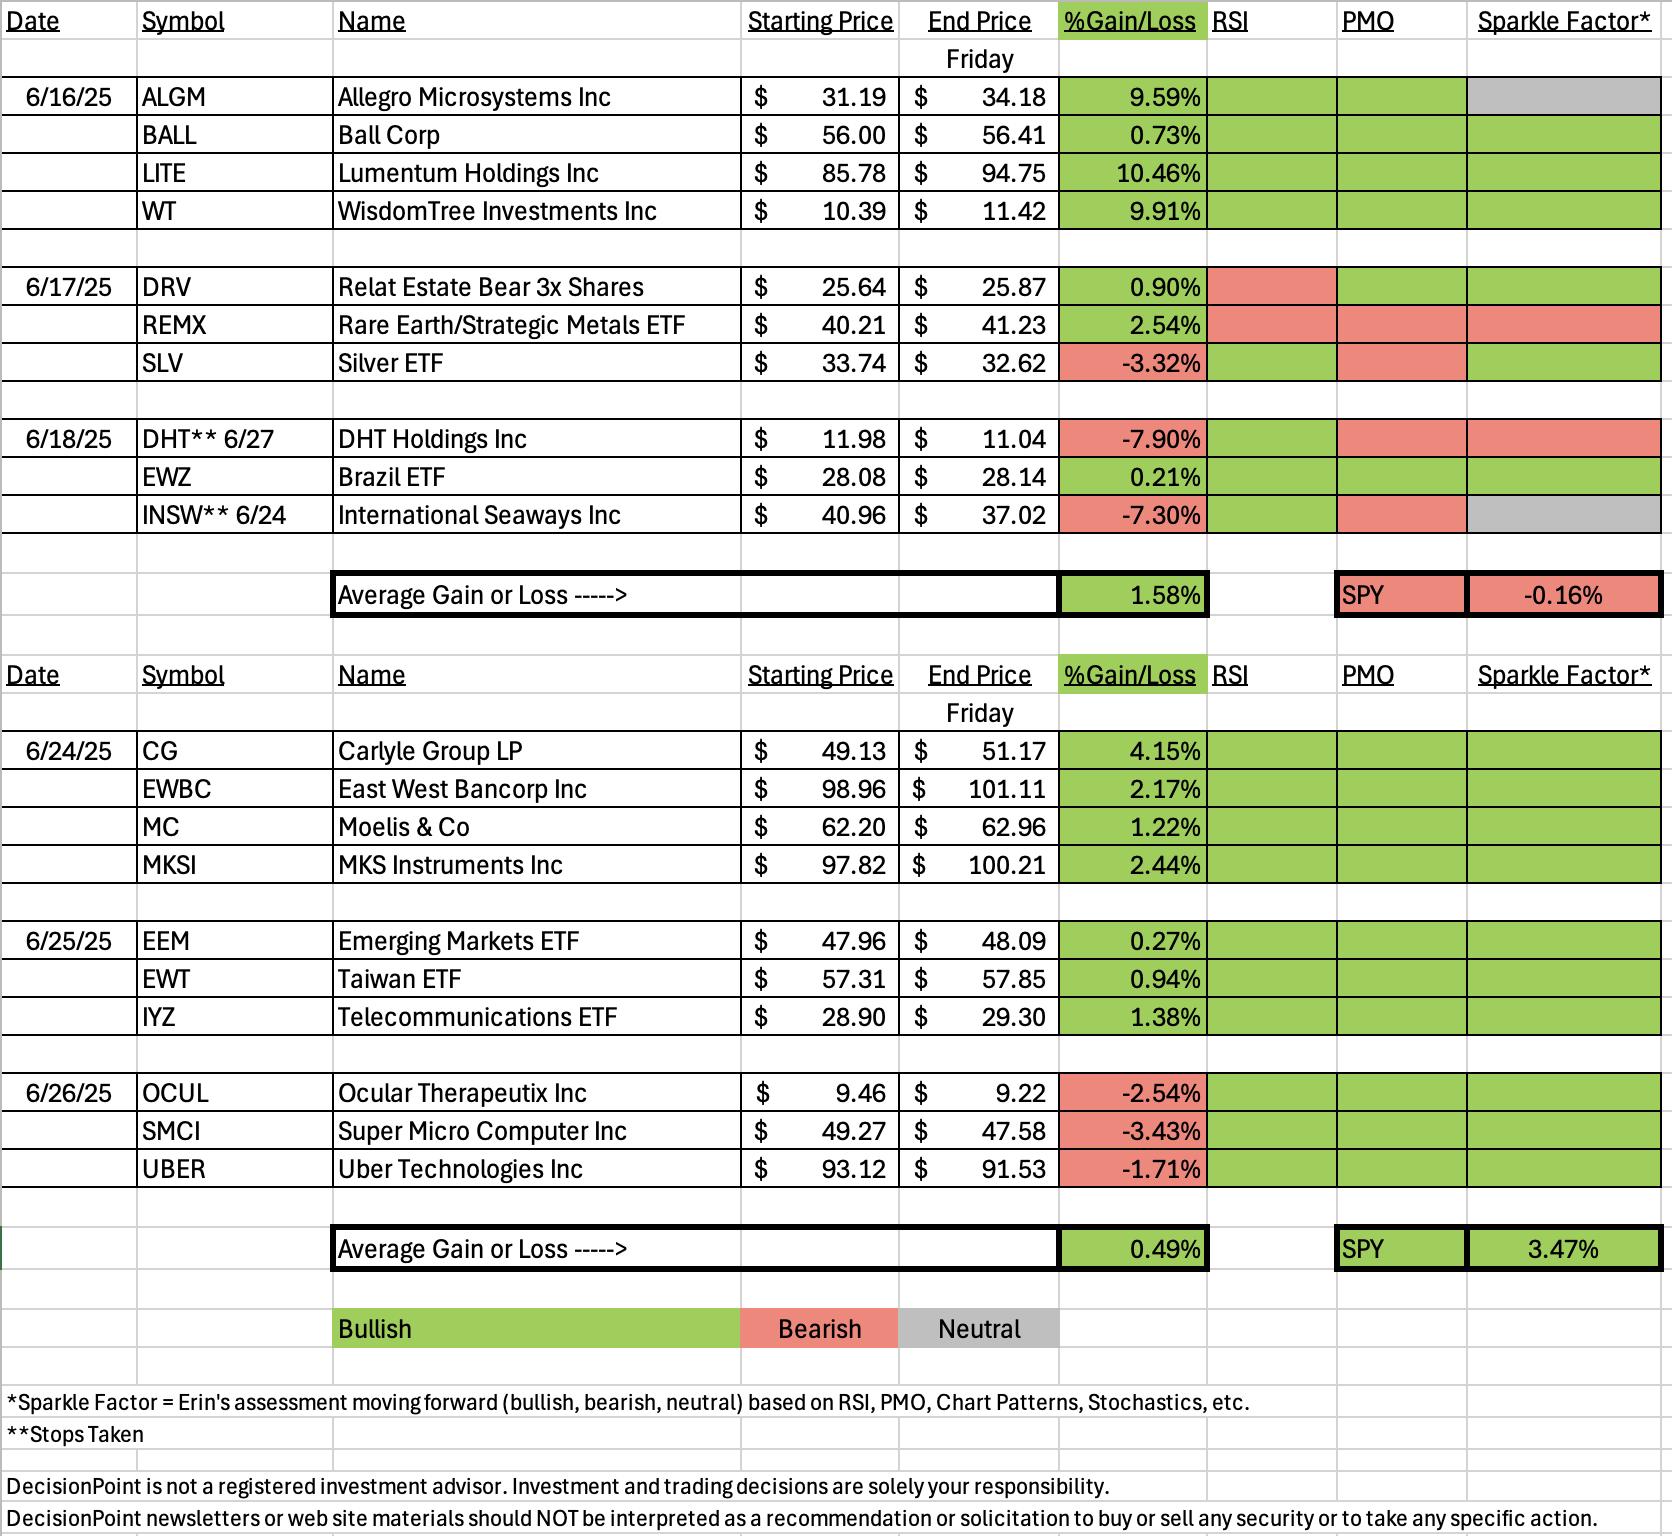
Darling:
Carlyle Group LP (CG)
EARNINGS: 2025-08-05 (AMC)
The Carlyle Group, Inc. is a global investment firm. It operates through the following segments: Global Private Equity (GPE), Global Credit (GC), and Global Investment Solutions (GIS). The GPE segment focuses on buyout and growth capital funds, which pursue a variety of corporate investments of different sizes and growth potentials. The GC segment includes funds and vehicles that pursue investment strategies including loans and structured credit, direct lending, opportunistic credit, distressed credit, aircraft financing and servicing, infrastructure debt, insurance solutions, and global capital markets. The GIS segment provides comprehensive investment opportunities and resources for investors and clients to build private equity portfolios through fund of funds, secondary purchases or financings of existing portfolios, and managed co-investment programs. The company was founded by William Elias Conway Jr., Daniel Anthony D'Aniello, and David Mark Rubenstein in 1987 and is headquartered in Washington, DC.
Predefined Scans Triggered: Moved Above Upper Bollinger Band, Moved Above Upper Price Channel, Parabolic SAR Buy Signals, P&F Ascending Triple Top Breakout, New CCI Buy Signals and P&F Double Top Breakout.
Below are the commentary and chart from Tuesday, 6/24:
"CG is unchanged in after-hours trading. Here's our first reverse head and shoulders. We saw a breakout that essentially confirmed the pattern today. I note that there is a new Golden Cross of the 50/200-day EMAs. The RSI is positive and not overbought. The PMO is on a new Crossover BUY Signal and is flat above the zero line implying pure strength. Stochastics just popped above 80. The group is performing in line with the SPY which works for me given the SPY is bullish right now. CG is outperforming the group and the SPY and has been for some time. The minimum upside target of the reverse head and shoulders pattern would put price around $64. Not sure it will get that far, but it is a great looking target. The stop is set between the 20/50-day EMAs at 7.5% or $45.44."
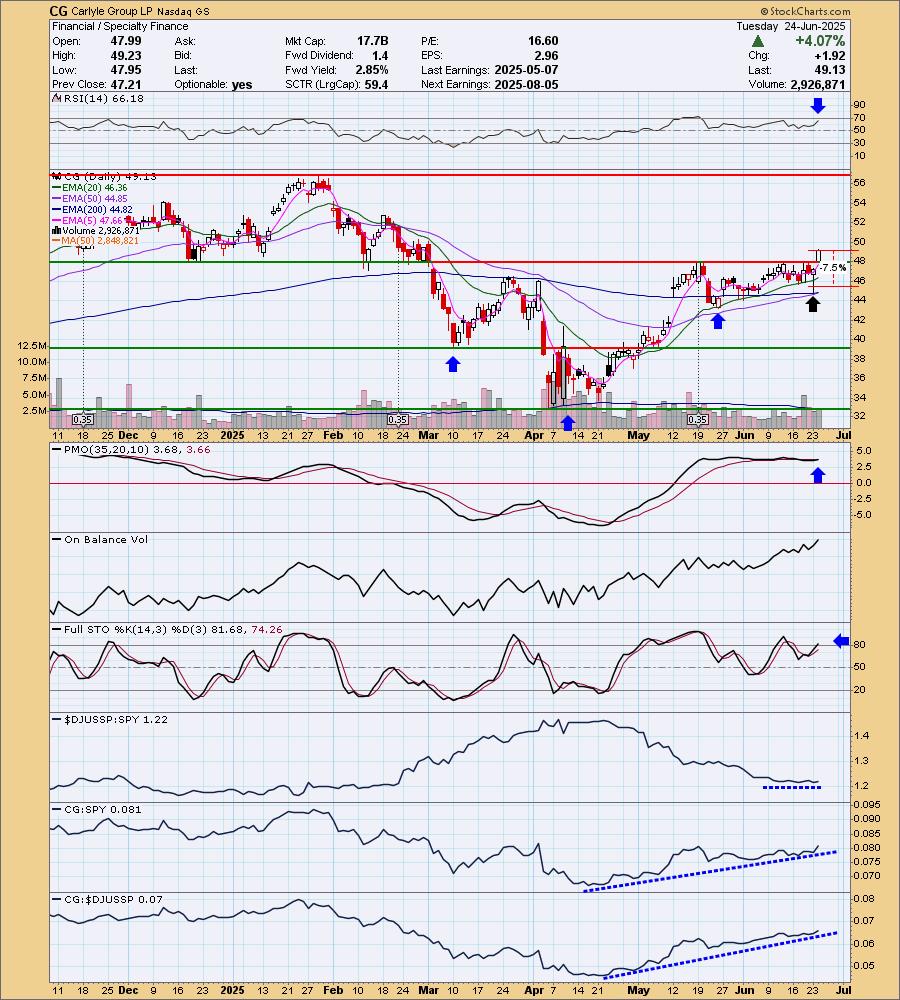
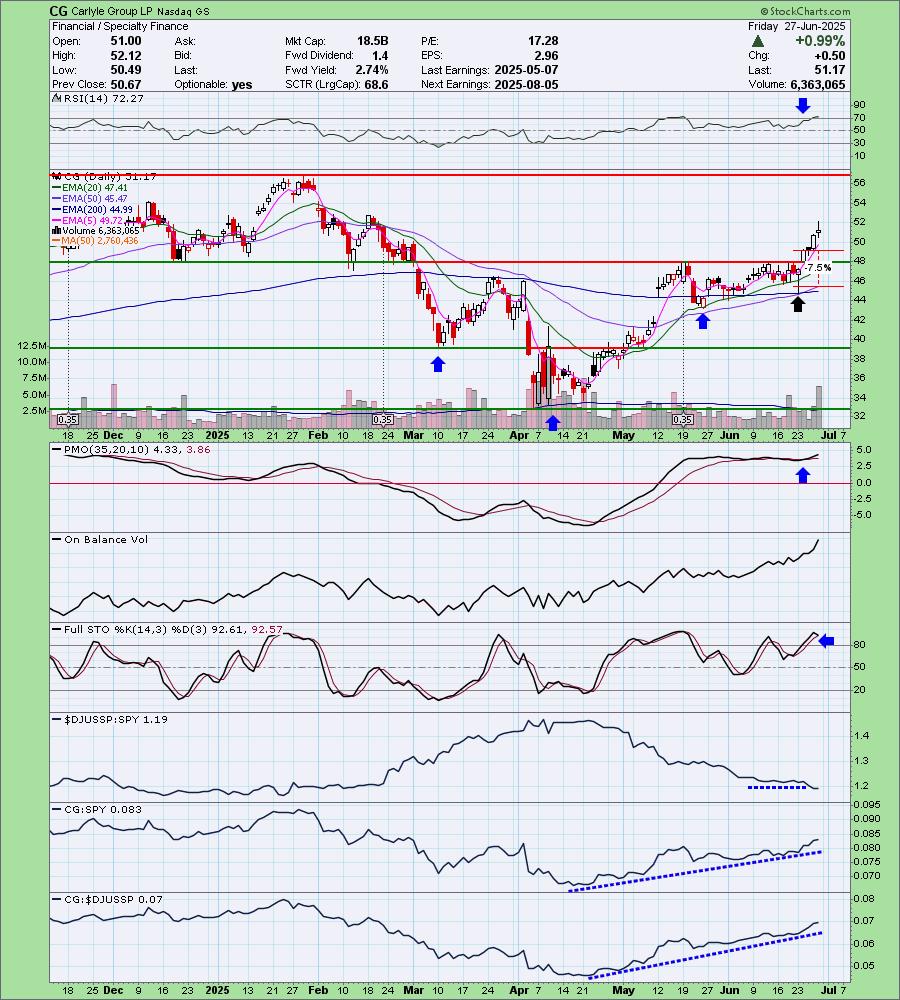
Here is today's chart:
It was a really nice setup. The rally had not gotten overheated when it was picked, leaving it plenty of upside. The RSI is now overbought so this may not be a good entry. It does look like it will make its way back up to resistance and that is an excellent gain. Stochastics did top, but they are comfortably above 80 so I think it has more upside to go before turning back. The reverse head and shoulders has been confirmed.
Don't forget, on Thursdays I look at reader-requested symbols, so shoot me an email at erin@decisionpoint.com. I read every email I receive and try to answer them all!
Dud:
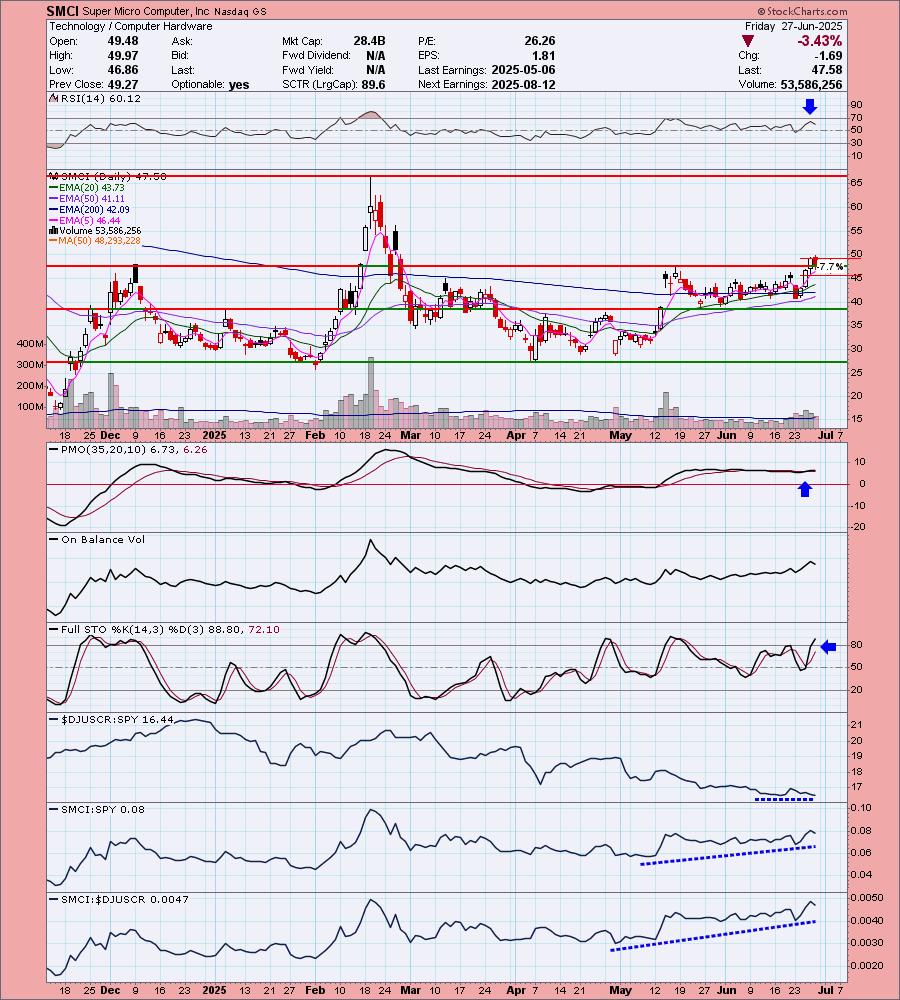
Super Micro Computer, Inc (SMCI)
EARNINGS: 2025-08-12 (AMC)
Super Micro Computer, Inc. engages in the distribution and manufacture of information technology solutions and other computer products. Its products include twin solutions, MP servers, GPU and coprocessor, MicroCloud, AMD solutions, power supplies, SuperServer, storage, motherboards, chassis, super workstations, accessories, SuperRack and server management products. The company was founded by Charles Liang, Yih-Shyan Liaw, Sara Liu, and Chiu-Chu Liu Liang in September 1993 and is headquartered in San Jose, CA.
Predefined Scans Triggered: P&F Ascending Triple Top Breakout, P&F Bullish Catapult, P&F Double Top Breakout and Moved Above Upper Keltner Channel.
Below are the commentary and chart from Thursday, 6/26:
"SMCI is down -0.08% in after-hours trading. It was the breakout that got me on this one combined with incredible upside potential that you'll see on the weekly chart. It is a little risky as the market could turn over now that we've come to all-time highs so adhere to your stop. The RSI is positive and not overbought. The PMO is flat above the signal line so there is strength. The OBV is starting to curl up with price. Stochastics are nearly above 80. The group is performing in line with the SPY which is acceptable. SMCI however, is outperforming both the group and the SPY. The stop is set arbitrarily at 7.7% or $45.47."
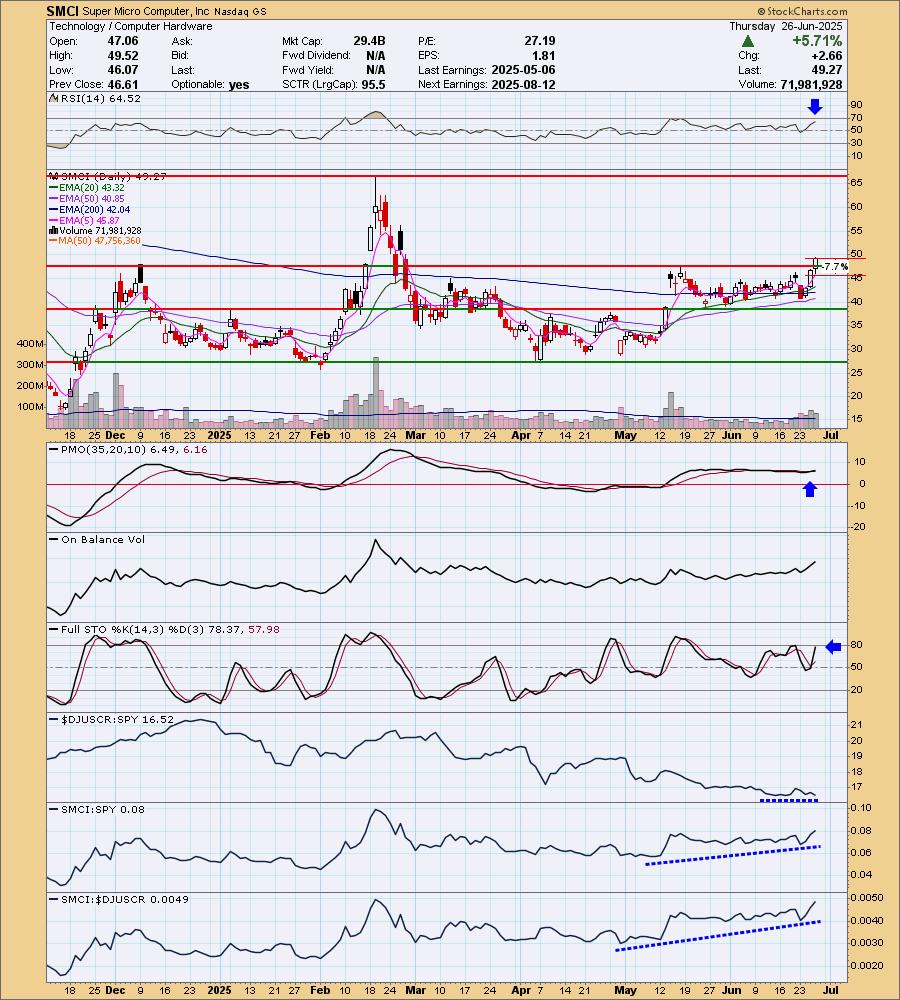
Here is today's chart:
I did hesitate to include this one given its penchant for volatility, but the breakout just looked too good. Today saw a pullback, but price essentially stayed above support which is why I still give it a bullish Sparkle Factor. The PMO is still on the rise despite today's decline. The PMO is flat above the zero line implying pure strength so we should see the rally get going again. It was a "Dud" based on percent change, but I don't think the chart is a "dud" right now.
THIS WEEK's Performance:
DecisionPoint Market Scoreboard (Mechanical Trend Model Signals):
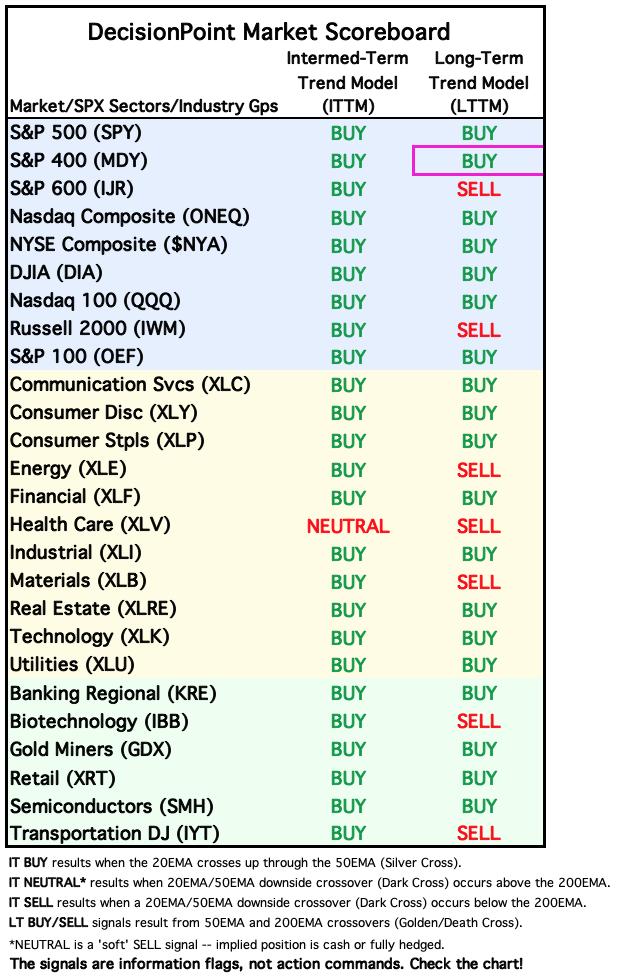
Friday signal changes are outlined in purple.
Click Here to view Carl's annotated "Under the Hood" ChartList!
Sector to Watch: Financials (XLF)
There was one tie breaker for picking XLF over XLI and that was the Silver Cross Index. In XLF's case it is rising above the signal line. In the case of XLI, it had topped beneath the signal line. I like that the RSI is not overbought and the PMO is on a new Crossover BUY Signal. Participation is healthy and offers opportunity for improvement as the rest of the sector kicks it into gear. Stochastics are above 80. Relative Strength is beginning to fade somewhat but it is still in a rising trend.
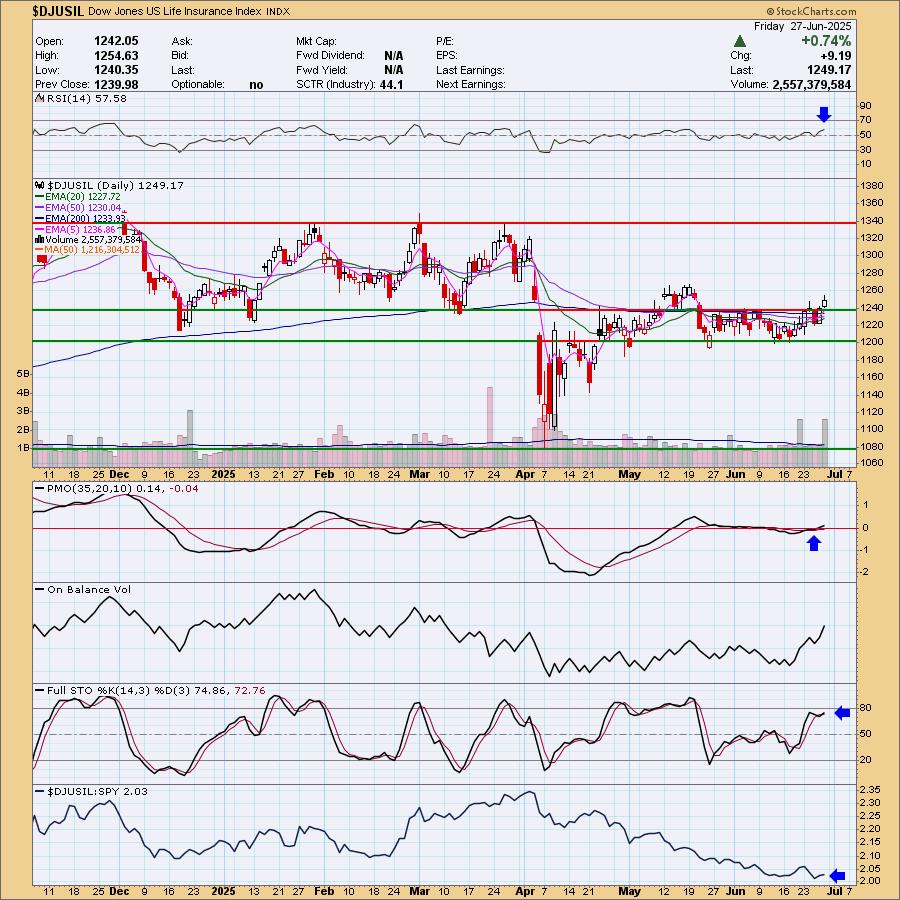
Industry Group to Watch: Life Insurance ($DJUSIL)
If you want to trade this industry group or at least a part of it, you could use the Insurance ETF (KIE). This chart does look slightly better than that one, but it certainly could be used. We see a new breakout today. Overhead resistance is near, but I'm liking the indicators that suggest we'll see some more upside. The RSI is not at all overbought. The PMO is rising above the zero line on a Crossover BUY Signal so we have new strength entering the picture. Stochastics have turned back up and are headed toward 80. It hasn't been performing particularly well, but within the last few days we see rising relative strength. The stocks I liked within this industry group were: ING, MFC, VOYA, PFG, MET and PRI.
Go to our Under the Hood ChartList on DecisionPoint.com to get an in-depth view of all the sectors. On StockCharts.com you can find the Industry Summary.
Good Luck & Good Trading! Wishing you all the best in your trading endeavors! Signing off...
- Erin
erin@decisionpoint.com
Full Disclosure: I'm 50% long, 0% short.
Watch the latest episode of the DecisionPoint Trading Room with Carl & Erin Swenlin HERE!
Technical Analysis is a windsock, not a crystal ball. --Carl Swenlin
NOTE: The stocks reported herein are from mechanical trading model scans that are based upon moving average relationships, momentum and volume. DecisionPoint analysis is then applied to get selections from the scans. The selections given should prompt readers to do a chart review using their own analysis process. This letter is not a call for a specific action to buy, sell or short any of the stocks provided. There are NO sure things or guaranteed returns on the selection of "diamonds in the rough."
Helpful DecisionPoint Links:
DecisionPoint Shared ChartList and DecisionPoint Chart Gallery
Price Momentum Oscillator (PMO)
Swenlin Trading Oscillators (STO-B and STO-V)
(c) Copyright 2025 DecisionPoint.com