
* * * * * * * * * * * * * *
Carl has decided to retire, and Erin will be joining him in retirement. We will continue publication until June 27th, and we will be contacting you soon via email as to how this will affect your subscriptions.
* * * * * * * * * * * * * *
Thank you to the two readers who sent in requests today. We note that the rally wasn't that broad today so I'm not that surprised that we didn't get more requests. The scans haven't been returning too many quality symbols so I can see why some of you aren't finding candidates.
The three I'm presenting today look good. They fill all the squares and should see some upside follow-through. It is also getting tough to pick now that earnings season has kicked off. There may be good charts, but do make sure they aren't reporting earnings that quickly. You can hold through them, but it is always a gamble.
Tomorrow is the Diamond Mine trading room. Registration info is below. These will likely end in the first part of June so get in there and experience the camaraderie of our friendly group now!
Good Luck & Good Trading,
Erin
Today's "Diamonds in the Rough": FULC, IDT and WM.
Other requests: TVTX and SUI.

Diamond Mine Trading Room:
RECORDING & DOWNLOAD LINK (4/25/2025):
Topic: DecisionPoint Diamond Mine (4/25/2025) LIVE Trading Room
Download & Recording LINK
Passcode: April#25
REGISTRATION for 5/2/2025:
When: May 2, 2025 09:00 AM Pacific Time (US and Canada)
Topic: DecisionPoint Diamond Mine LIVE Trading Room
Register in advance for this webinar HERE
After registering, you will receive a confirmation email containing information about joining the webinar.
Below is our last free DecisionPoint Trading Room recording from 4/28.
Welcome to DecisionPoint Diamonds, wherein I highlight ten "Diamonds in the Rough" per week. These are selected from the results of my DecisionPoint Scans which search for stocks that could benefit from the trend and condition of the market. Remember, these are not recommendations to buy or sell, but are the most interesting of the stocks that surfaced in my scans. My objective is to save you the work of the initial, tedious culling process, but you need to apply your own analysis to see if these stocks pique your interest as well. There are no guaranteed winners here!
"Predefined Scans Triggered" are taken from StockCharts.com using the "Symbol Summary" option instead of a "SharpChart" on the workbench.
Stop levels are all rounded down.
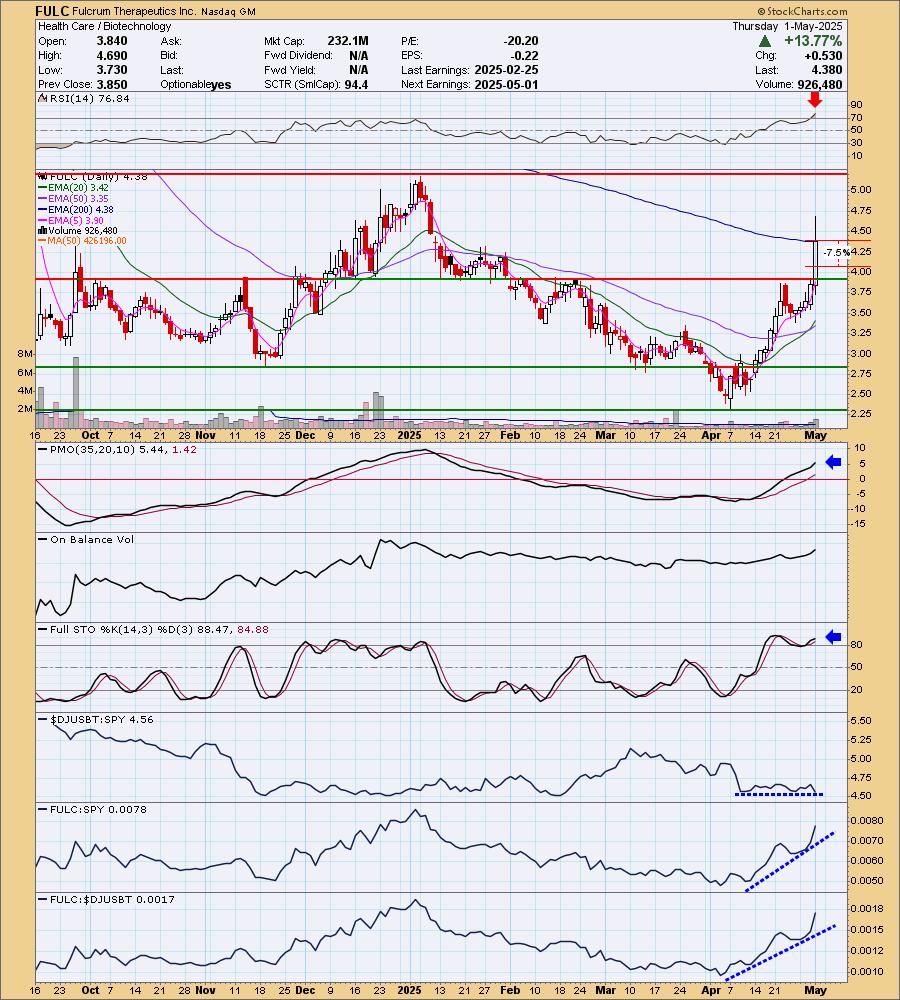
Fulcrum Therapeutics Inc. (FULC)
EARNINGS: 2025-05-01 (BMO) ** Reported Today **
Fulcrum Therapeutics, Inc. is a clinical stage biopharmaceutical company, which develops new medicines and focuses on unlocking gene control mechanisms to develop small molecule therapies. Its product candidate includes Losmapimod and FTX-HbF. The company was founded by Michael R. Green, Danny Reinberg, Rudolf Jaenisch, Jeannie T. Lee, and Bradley E. Bernstein on August 18, 2015, and is headquartered in Cambridge, MA.
Predefined Scans Triggered: Moved Above Upper Bollinger Band, Moved Above Ichimoku Cloud and Moved Above Upper Price Channel.
FULC is down -0.01% in after hours trading. I hesitated on this one given its explosive move today on earnings, but ultimately strong earnings do lead to higher prices. We just may have to deal with a pullback first given the RSI is now overbought. At the same time, this could see strong follow-through as we did have a bull flag that led into this rally. There is a new Silver Cross of the 20/50-day EMAs. The PMO is accelerating higher above the zero line on a Crossover BUY Signal. Stochastics are above 80. Relative strength for the group hasn't really kicked in, but this one is outperforming both the SPY and the group. The stop was tricky given today's big rally, but ultimately I did it at 7.5% or $4.05. Be careful with this one as it is low-priced.
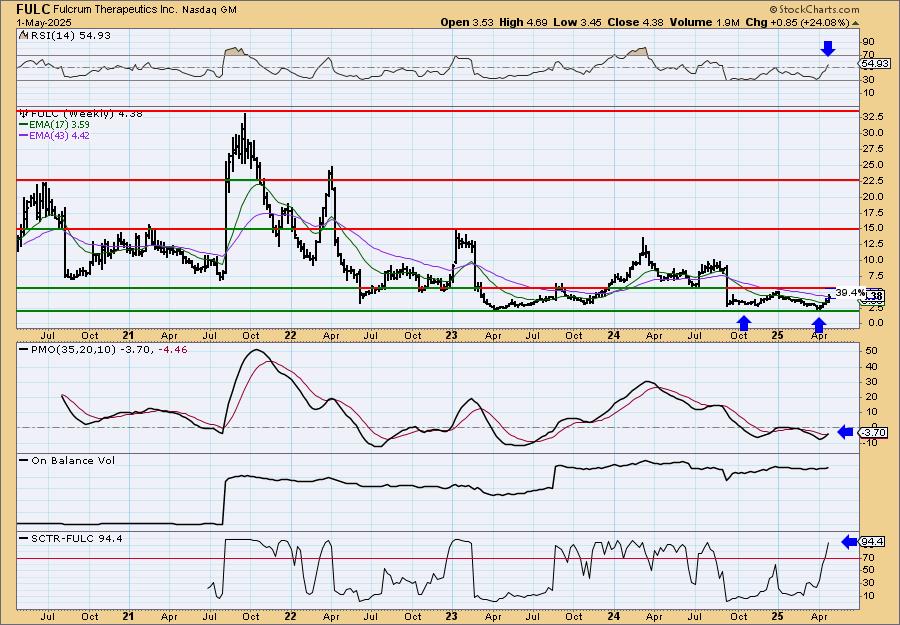
I like the long-term double bottom formation on the weekly chart. Even if it just reaches the confirmation line of the pattern it would be a hefty gain. The weekly RSI is now in positive territory and the weekly PMO has triggered a Crossover BUY Signal. The StockCharts Technical Rank (SCTR) is at the top of the hot zone*.
*If a stock is in the "hot zone" above 70, it implies that it is stronger than 70% of its universe (large-, mid-, small-caps and ETFs) primarily in the intermediate to long terms.
IDT Corp. (IDT)
EARNINGS: 2025-06-04 (AMC)
IDT Corp. operates as a holding company. The firm engages in the distribution and market of communications and payment services. It operates through the following segments: Fintech, National Retail Solutions, Net2phone, Traditional Communications, and Corporate. The Fintech segment is involved in international money remittance and related value transfer services. The National Retail Solutions segment refers to an operator of a nationwide POS network providing independent retailers with store management software, electronic payment processing, and other ancillary merchant services. The Net2phone segment consists of net2phone's cloud communications and contact center offerings. The Traditional Communications segment includes IDT Digital Payments, which enables customers to transfer airtime and bundles of airtime, messaging, and data to international and domestic mobile accounts, BOSS Revolution Calling, an international long-distance calling service marketed primarily to immigrant communities in the United States and Canada, and IDT Global, a wholesale provider of international voice and SMS termination and outsourced traffic management solutions to telecoms worldwide. The company was founded by Howard S. Jonas in August 1990 and is headquartered in Newark, NJ.
Predefined Scans Triggered: New CCI Buy Signals, P&F Bear Trap and P&F Double Top Breakout.
IDT is unchanged in after hours trading. I'm not thrilled with the trading range here but it is better than a declining trend. I did spot a small ascending triangle that confirmed with today's breakout so we should get follow-through. The RSI is positive and not at all overbought. The PMO is on a new Crossover BUY Signal that occurred above the zero line. Stochastics are above 80 and rising. Overall the group is performing very well and so is IDT against the group and the SPY. The stop is set at the prior low at 7.9% or $46.86.
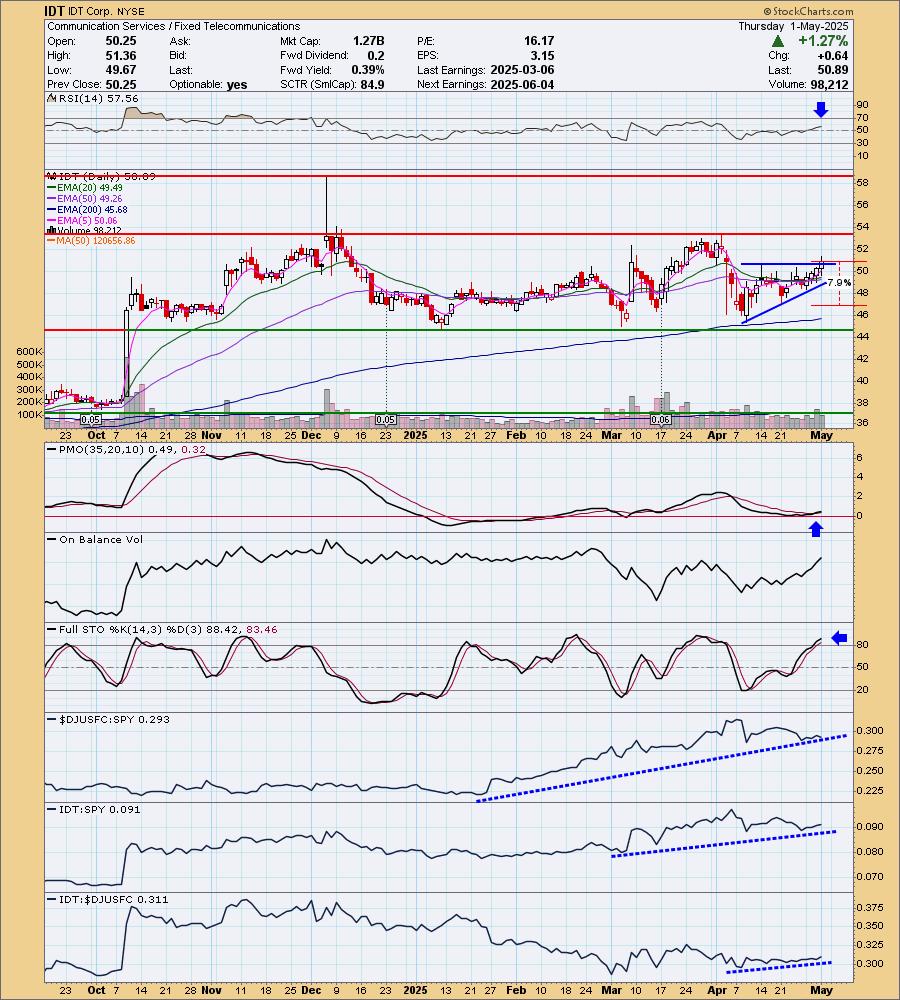
We do have a rising trend on the weekly chart. Price is holding above the 43-week EMA and is bouncing. The weekly RSI is positive and not overbought. The weekly PMO has turned back up based on the thumbnail. The SCTR is comfortably within the hot zone above 70. If we can get the breakout, there is plenty of upside potential.

Waste Management, Inc. (WM)
EARNINGS: 2025-07-23 (AMC)
Waste Management, Inc. is a holding company, which engages in the provision of waste management environmental services. It operates through the following segments: Collection and Disposal-East Tier (East Tier), Collection and Disposal-West Tier (West Tier), Recycling Processing and Sales, WM Renewable Energy, and VM Healthcare Solutions. The East Tier segment includes the Eastern United States, the Great Lakes Region, and Canada. The West Tier segment refers to the upper Midwest region and British Columbia, Canada. The Recycling Processing and Sales segment focuses on the processing and sales of materials collected from residential, commercial, and industrial customers. The WM Renewable Energy segment develops, operates, and promotes projects for landfill gas use. The VM Healthcare Solutions segment relates to its primarily business to business company providing services that protect people and brands, promote health and well-being and safeguard the environment. The company was founded on September 30, 1987 and is headquartered in Houston, TX.
Predefined Scans Triggered: None.
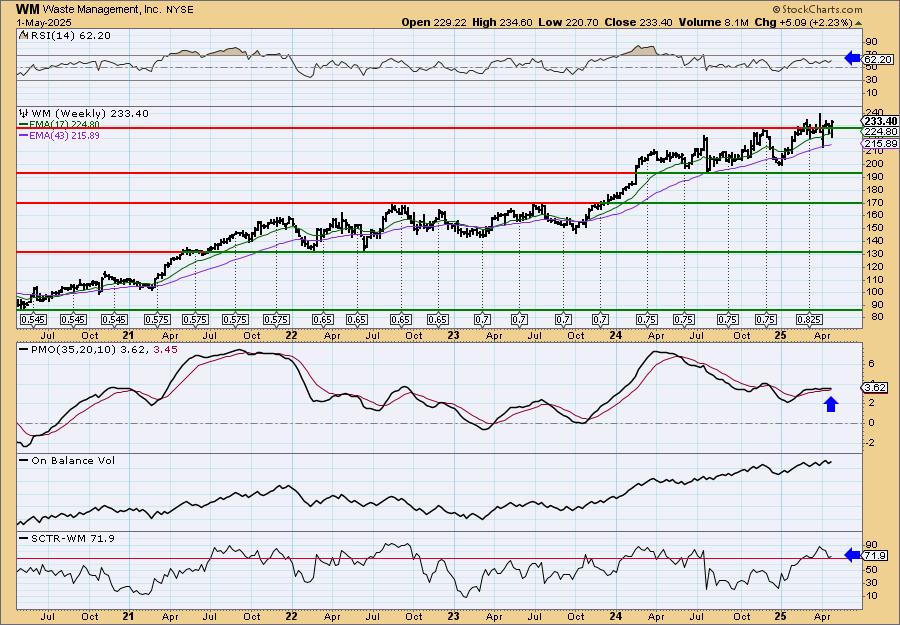
WM is up +0.13% in after hours trading. I like the breakout from the declining trend that came off a bullish hollow red candlestick. We have a rising trend in place out of the 2025 low. Price is above all three key moving averages. The RSI is positive and not overbought. The PMO is on a Crossover BUY Signal that occurred above the zero line. Stochastics are above 80 as well. It is only just now beginning to outperform the group. It has been an excellent performer against the SPY and the group is performing well too. The stop is set beneath the 200-day EMA at 7.7% or $215.42.
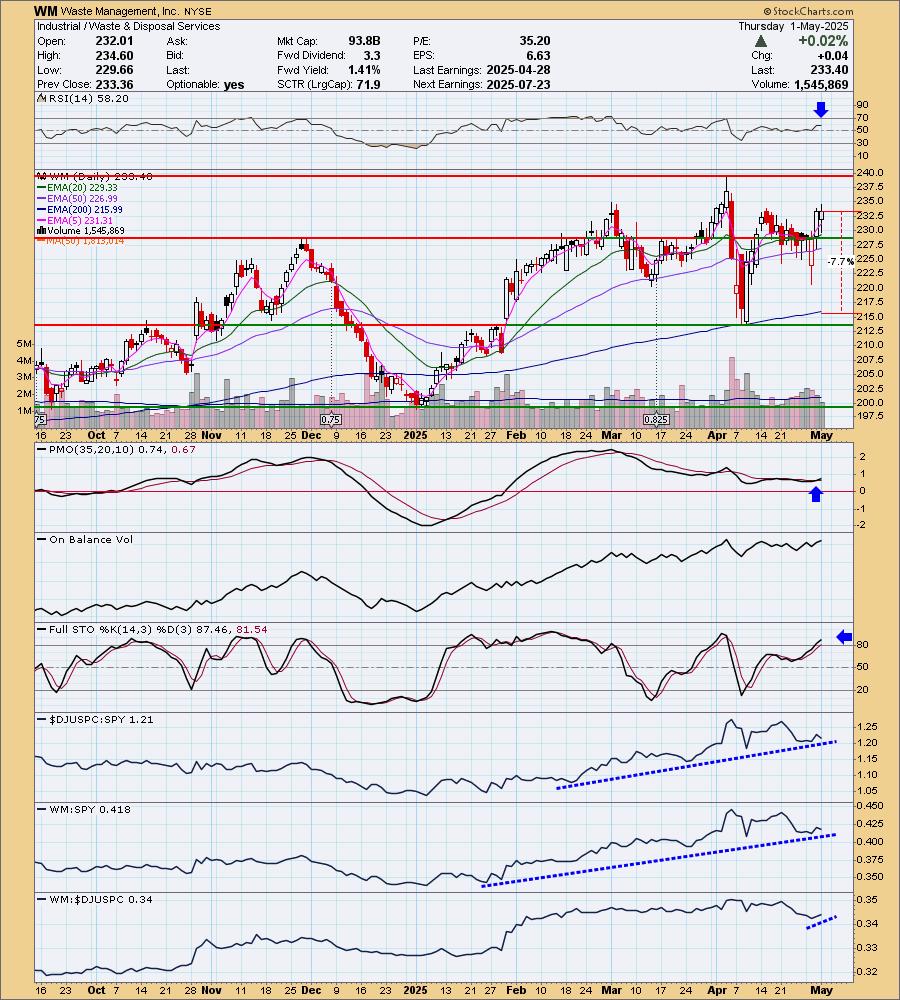
I like the rising trend on the weekly chart with essentially a breakout above overhead resistance. The weekly RSI is positive and not overbought. The weekly PMO is flat above the zero line right now which implies strength. The OBV is confirming the rising trend. The SCTR is just within the hot zone above 70. Consider a 17% upside target to about $273.08.
Don't forget, on Thursdays I look at reader-requested symbols, click HERE to send me an email. I read every email I receive and try to answer them all!
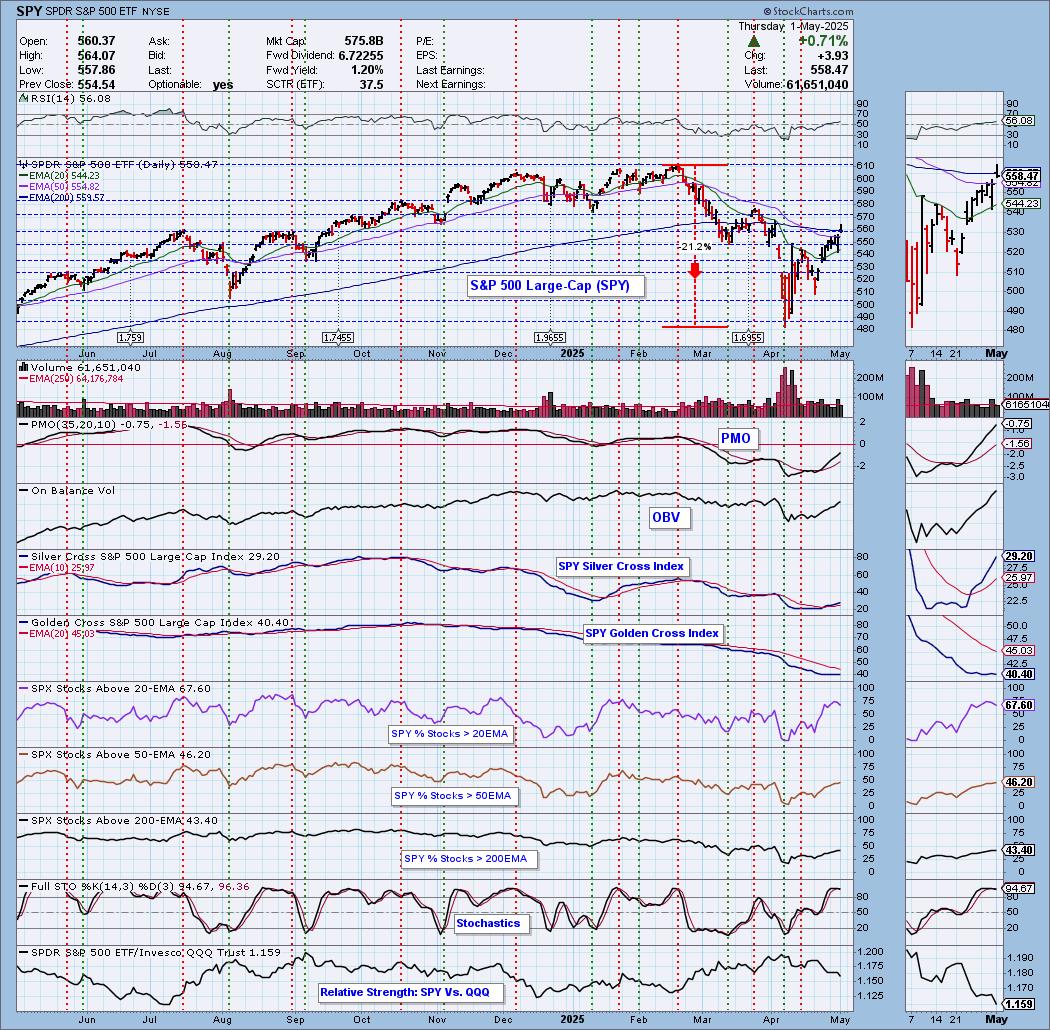
Current Market Outlook:
Market Environment: It is important to consider the odds for success by assessing the market tides. The following chart uses different methodologies for objectively showing the depth and trend of participation for intermediate- and long-term time frames.
- The Silver Cross Index (SCI) shows the percentage of SPX stocks on IT Trend Model BUY signals (20-EMA > 50-EMA)
- The Golden Cross Index (GCI) shows the percentage of SPX stocks on LT Trend Model BUY signals (50-EMA > 200-EMA)
Don't forget that as a "Diamonds" member, you have access to our "Under the Hood" curated ChartList on DecisionPoint.com. You'll find it under "Members Only" links on the left side on the Blogs and Links Page.
Here is the current chart:
Full Disclosure: I am 10% long, 0% short. I'm sleeping better at night as an observer not a buyer right now.
I'm required to disclose if I currently own a stock I mention and/or may buy/short it within the next 72 hours.
"Technical Analysis is a windsock, not a crystal ball." - Carl Swenlin
(c) Copyright 2025 DecisionPoint.com
Watch the latest episode of DecisionPoint Trading Room with Carl Swenlin & Erin Swenlin Mondays on the DecisionPoint YouTube channel here!
NOTE: The stocks reported herein are from mechanical trading model scans that are based upon moving average relationships, momentum and volume. DecisionPoint analysis is then applied to get five selections from the scans. The selections given should prompt readers to do a chart review using their own analysis process. This letter is not a call for a specific action to buy, sell or short any of the stocks provided. There are NO sure things or guaranteed returns on the daily selection of "Diamonds in the Rough."
Regarding BUY/SELL Signals: The signal status reported herein is based upon mechanical trading model signals and crossovers. They define the implied bias of the price index/stock based upon moving average relationships and momentum, but they do not necessarily call for a specific action. They are information flags that should prompt chart review. Further, they do not call for continuous buying or selling during the life of the signal. For example, a BUY signal will probably (but not necessarily) return the best results if action is taken soon after the signal is generated. Additional opportunities for buying may be found as price zigzags higher, but the trader must look for optimum entry points. Conversely, exit points to preserve gains (or minimize losses) may be evident before the model mechanically closes the signal.
Helpful DecisionPoint Links:
Price Momentum Oscillator (PMO)
Swenlin Trading Oscillators (STO-B and STO-V)
For more links, go to DecisionPoint.com