
* * * * * * * * * * * * * *
Carl has decided to retire, and Erin will be joining him in retirement. We will continue publication until June 27th, and we will be contacting you soon via email as to how this will affect your subscriptions.
* * * * * * * * * * * * * *
The Diamond Scans did not come through today as far as giving me some selections for today. There were two that did come from the scans, but I'm not presenting them as I found some I like better. The symbols that did come through on the scans were SCO (ultra short oil) and UNG (looks promising, but is not trustworthy yet).
The ETFs I did pick all came from our ETF Tracker. Remember you have access to this ChartList on our website. Just go to the top of the lefthand menu for the link to that list as well as our other two. I did find quite a few ETFs that looked pretty good from the Tracker. You'll find them in the runner-up list.
Tomorrow is Reader Request Day! I really enjoyed getting more symbols last week and hope we will see good participation this week. Just send me a quick email with any symbols that are on your radar or that you want analysis on from your portfolio. The market is so far cooperating so I would expect there are some you are considering or own.
Good Luck & Good Trading,
Erin
Today's "Diamonds in the Rough": FDN, IAI and XBI (IBB).
Runner-ups: SCO, UNG, IGV, TLT, URA, PHO, IHI, PAVE and IYZ.

Diamond Mine Trading Room:
RECORDING & DOWNLOAD LINK (4/25/2025):
Topic: DecisionPoint Diamond Mine (4/25/2025) LIVE Trading Room
Download & Recording LINK
Passcode: April#25
REGISTRATION for 5/2/2025:
When: May 2, 2025 09:00 AM Pacific Time (US and Canada)
Topic: DecisionPoint Diamond Mine LIVE Trading Room
Register in advance for this webinar HERE
After registering, you will receive a confirmation email containing information about joining the webinar.
Below is our last free DecisionPoint Trading Room recording from 4/28.
Welcome to DecisionPoint Diamonds, wherein I highlight ten "Diamonds in the Rough" per week. These are selected from the results of my DecisionPoint Scans which search for stocks that could benefit from the trend and condition of the market. Remember, these are not recommendations to buy or sell, but are the most interesting of the stocks that surfaced in my scans. My objective is to save you the work of the initial, tedious culling process, but you need to apply your own analysis to see if these stocks pique your interest as well. There are no guaranteed winners here!
"Predefined Scans Triggered" are taken from StockCharts.com using the "Symbol Summary" option instead of a "SharpChart" on the workbench.
Stop levels are all rounded down.
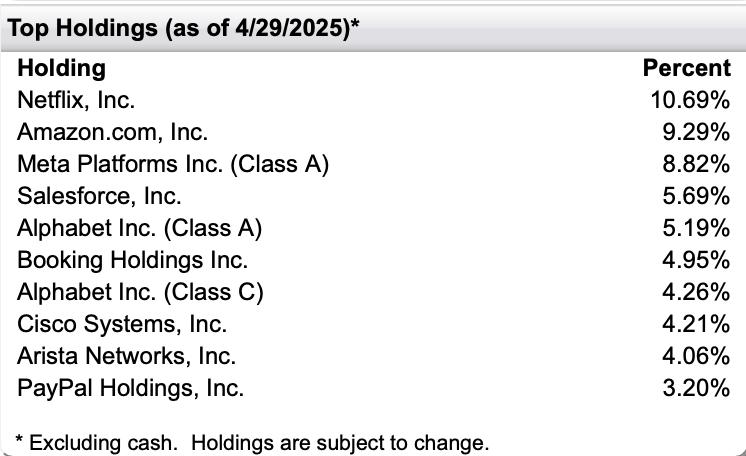
First Trust Dow Jones Internet Index Fund (FDN)
EARNINGS: N/A
FDN tracks a market-cap-weighted index of the largest and most liquid US Internet companies. Click HERE for more information.
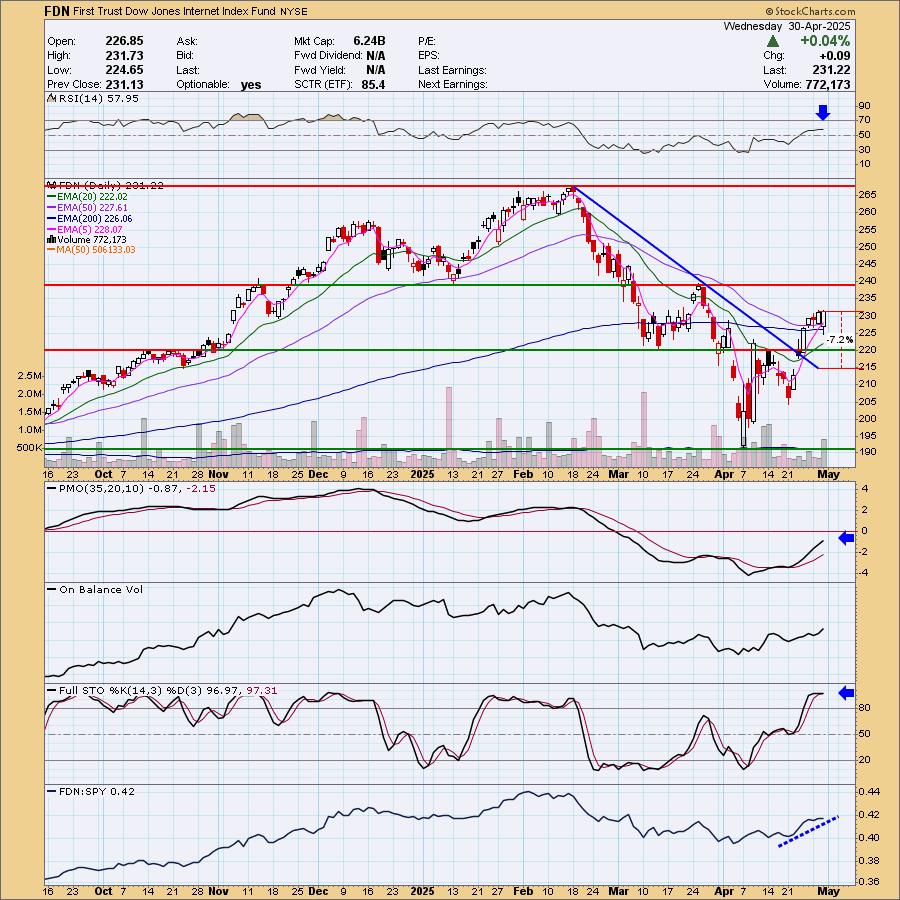
Predefined Scans Triggered: P&F Triple Top Breakout and P&F Double Top Breakout.
FDN is up +1.28% in after hours trading. We have a lopsided bullish double bottom pattern and a breakout above all three key moving averages. The declining trend has been broken. The RSI is positive and not overbought. The PMO is rising strongly toward the zero line which looks like new strength, not diminishing weakness. The OBV is rising in confirmation of the rally. Stochastics are holding well above 80. Relative strength looks positive as it rises. The stop is set below support at 7.2% or $214.57.
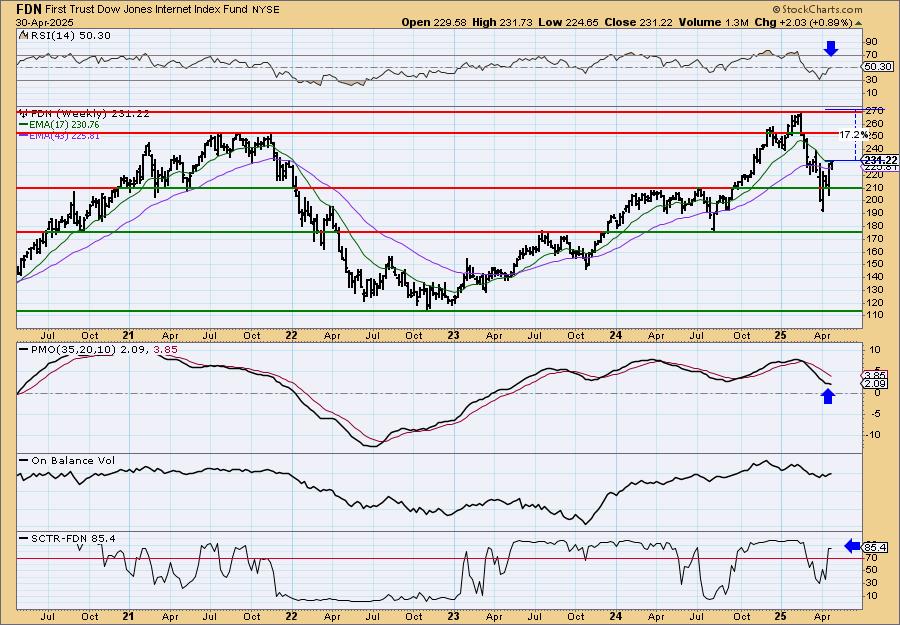
We know from the daily chart that the declining trend has been broken. Price now appears ready to recapture prior highs. The weekly RSI just hit positive territory. The weekly PMO is turning back up and the StockCharts Technical Rank (SCTR) is well within the hot zone* above 70. I think it could get back to all-time highs.
*If a stock is in the "hot zone" above 70, it implies that it is stronger than 70% of its universe (large-, mid-, small-caps and ETFs) primarily in the intermediate to long terms.
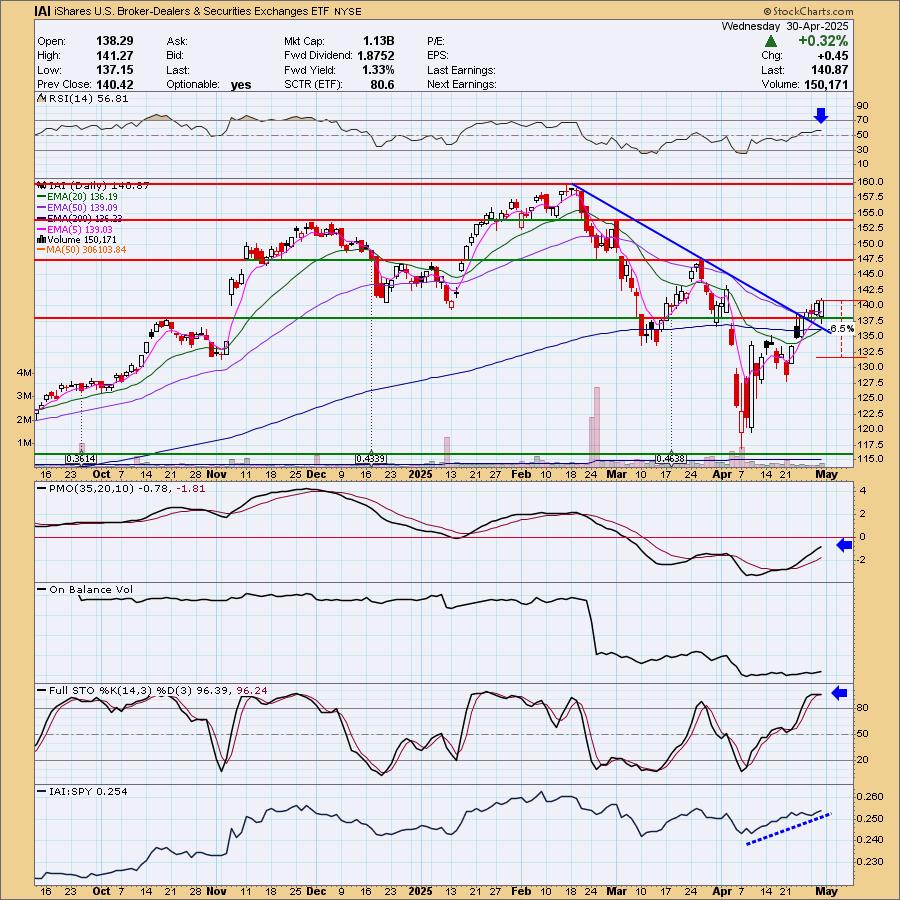
iShares U.S. Broker-Dealers & Securities Exchanges ETF (IAI)
EARNINGS: N/A
IAI tracks a market-cap-weighted index of investment service providers as well as securities and commodities exchanges. Click HERE for more information.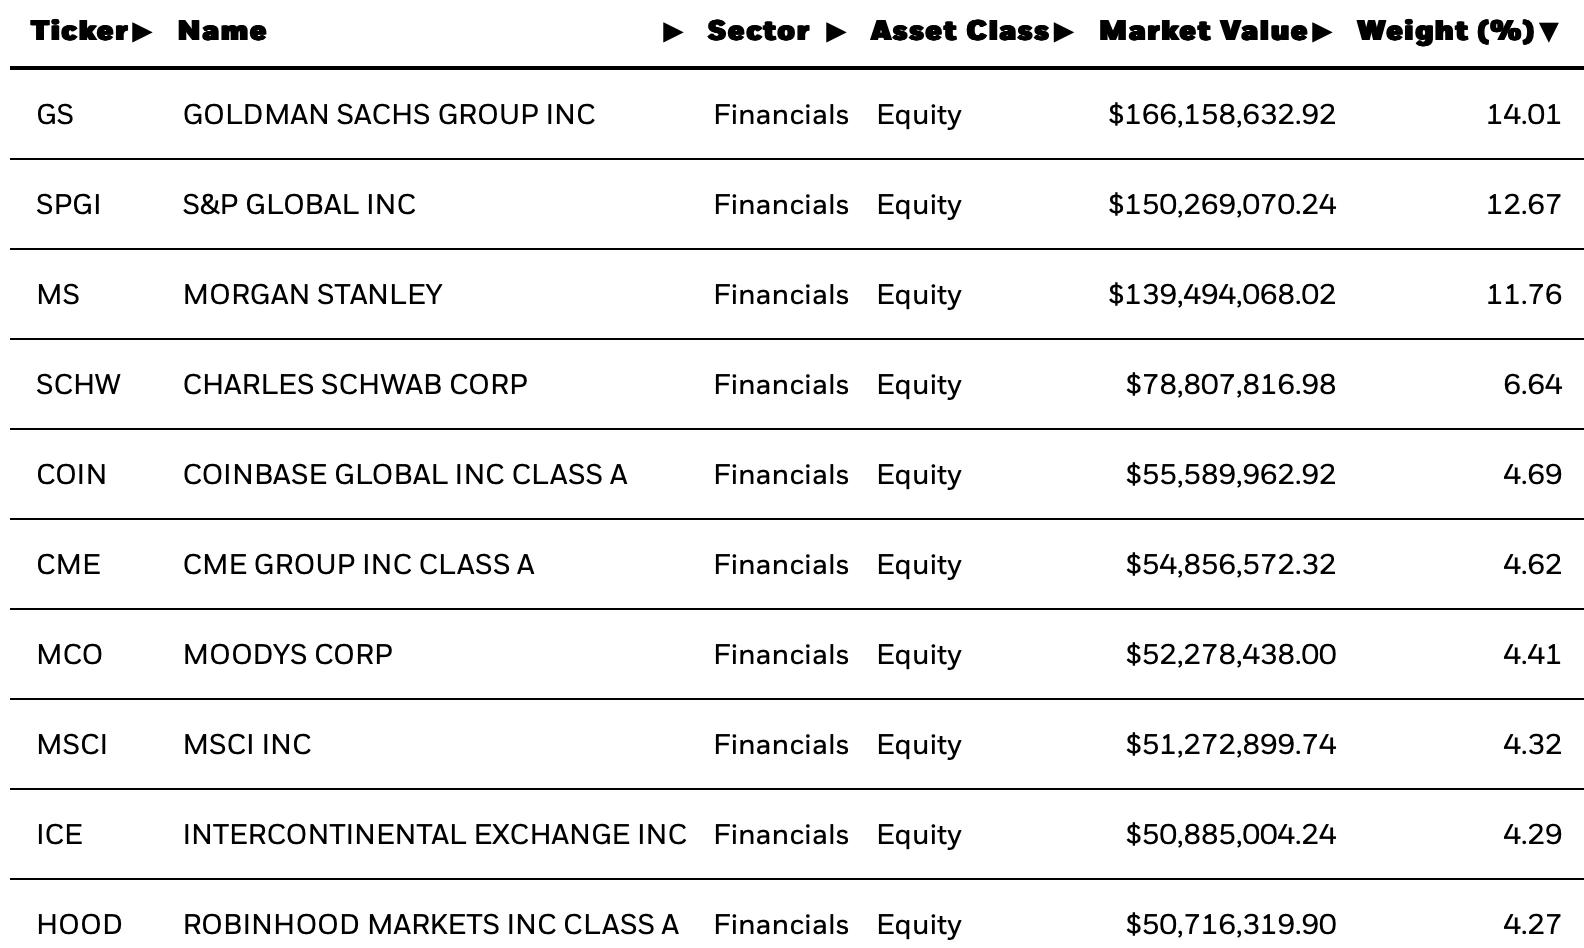
Predefined Scans Triggered: P&F Triple Top Breakout and P&F Double Top Breakout.
IAI is unchanged in after hours trading. We have another broken declining trend and a breakout above resistance at the October high. The RSI is positive and not at all overbought. The PMO is showing new strength as it breaks away from its signal line and nears the zero line. Stochastics are holding above 80 and we can see that we do have outperformance against the SPY for this ETF. I've set the stop beneath the March lows at 6.5% or $131.71.
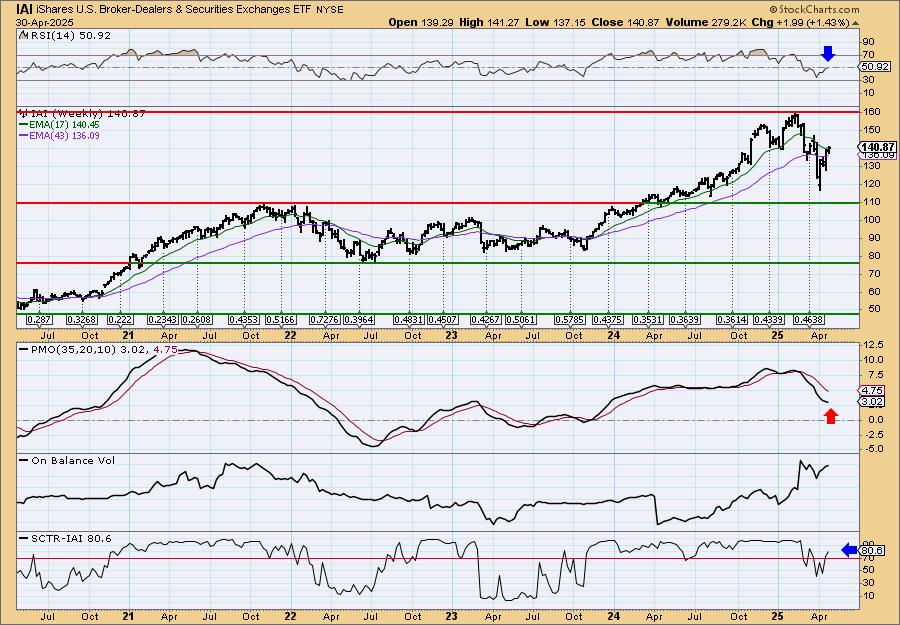
The daily chart confirms that the declining trend has been broken. It appears price is ready to go back to all-time highs. The weekly RSI just entered positive territory. The weekly PMO is unfortunately still in decline but it has to work through that treacherous decline. The SCTR is comfortably within the hot zone above 70. Consider a 17% upside target to about $164.82.
SPDR S&P Biotech ETF (XBI)
EARNINGS: N/A
XBI tracks an equal-weighted index of US biotechnology stocks. Click HERE for more information.
Predefined Scans Triggered: Improving Chaikin Money Flow, Moved Above Upper Price Channel and P&F Double Top Breakout.
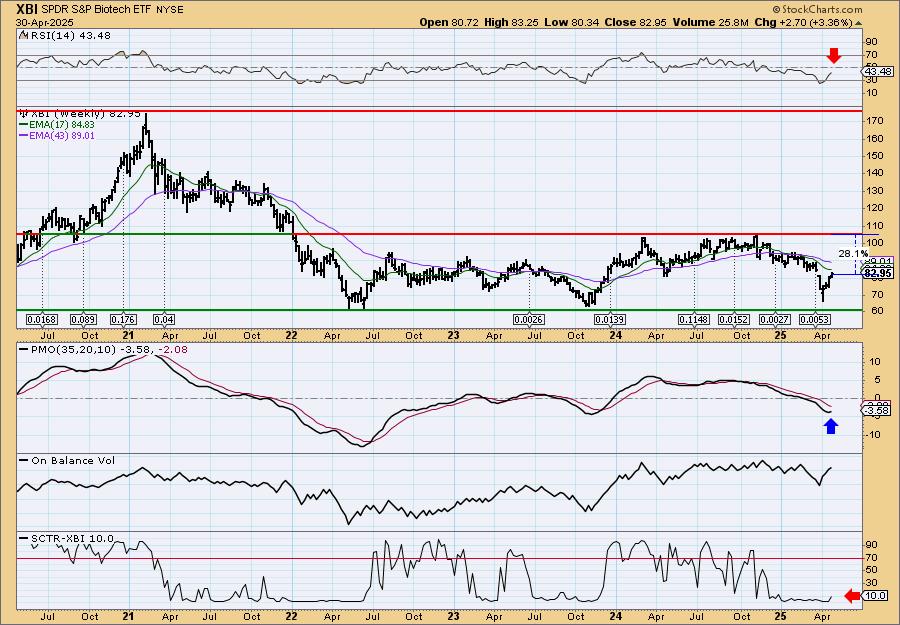
XBI is unchanged in after-hours trading. I like the bullish "V" Bottom pattern that formed on this price reversal. I'd prefer it to have broken out already, but it does appear ready to. The RSI is positive and not overbought. The PMO is rising strongly and has put a great deal of margin between it and its signal line. The OBV is rising in confirmation of this rally. Stochastics are rising again above 80. Relative strength looks good. The stop is set arbitrarily at 7.5% or $76.72.

We have the "under the hood" chart for IBB. You can see that participation is improving and the Silver Cross Index is back above its signal line. The Golden Cross Index has turned up. Both of their readings are very low as it has been beaten down. This looks like a promising rally.
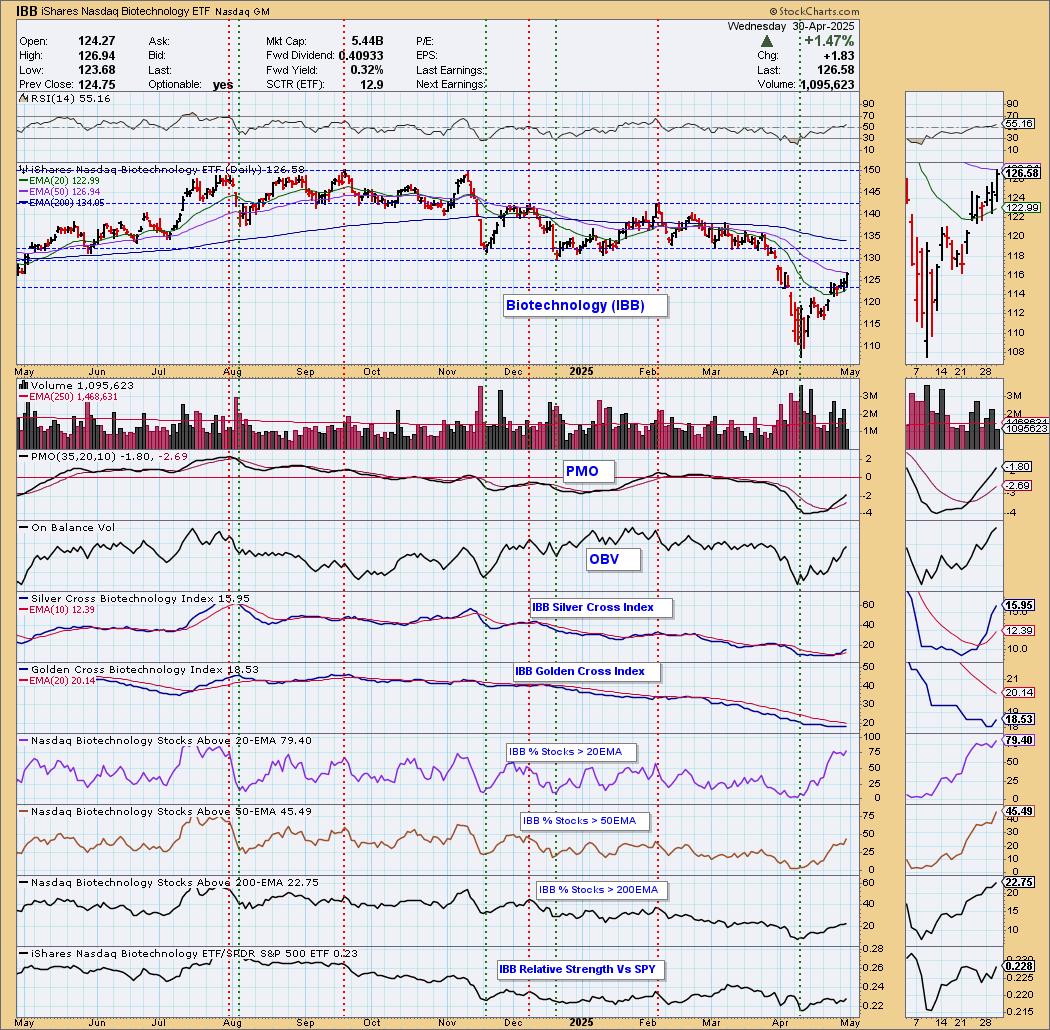
Price reversed before having to test strong support at the 2022/2023 lows. The weekly RSI isn't positive yet, but that should right itself soon if the rally continues as I believe it will. The weekly PMO has turned back up. The SCTR is in the basement so probably best to keep this in the short-term horizon.
Don't forget, on Thursdays I look at reader-requested symbols, click HERE to send me an email. I read every email I receive and try to answer them all!
Current Market Outlook:
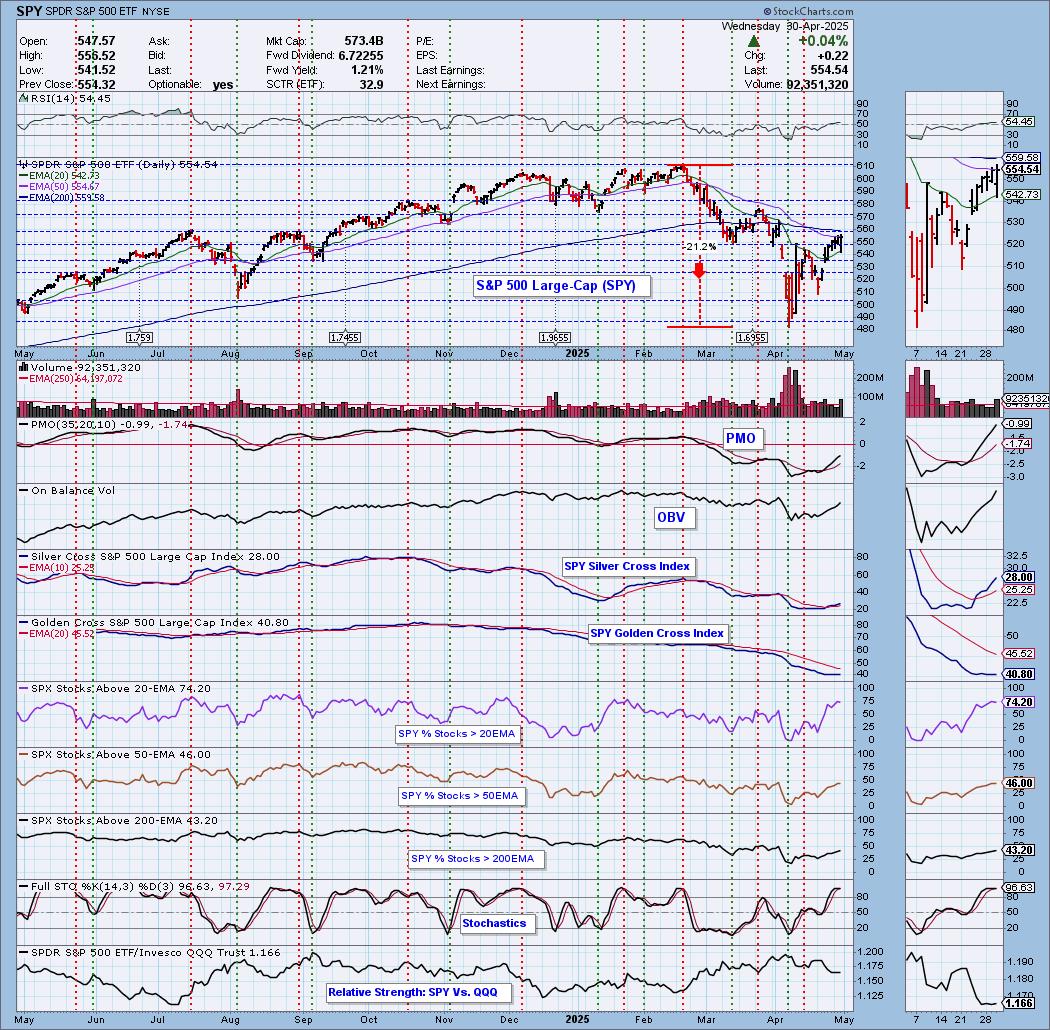
Market Environment: It is important to consider the odds for success by assessing the market tides. The following chart uses different methodologies for objectively showing the depth and trend of participation for intermediate- and long-term time frames.
- The Silver Cross Index (SCI) shows the percentage of SPX stocks on IT Trend Model BUY signals (20-EMA > 50-EMA)
- The Golden Cross Index (GCI) shows the percentage of SPX stocks on LT Trend Model BUY signals (50-EMA > 200-EMA)
Don't forget that as a "Diamonds" member, you have access to our "Under the Hood" curated ChartList on DecisionPoint.com. You'll find it under "Members Only" links on the left side on the Blogs and Links Page.
Here is the current chart:
Full Disclosure: I am 10% long, 0% short.
I'm required to disclose if I currently own a stock I mention and/or may buy/short it within the next 72 hours.
"Technical Analysis is a windsock, not a crystal ball." - Carl Swenlin
(c) Copyright 2025 DecisionPoint.com
Watch the latest episode of DecisionPoint Trading Room with Carl Swenlin & Erin Swenlin Mondays on the DecisionPoint YouTube channel here!
NOTE: The stocks reported herein are from mechanical trading model scans that are based upon moving average relationships, momentum and volume. DecisionPoint analysis is then applied to get five selections from the scans. The selections given should prompt readers to do a chart review using their own analysis process. This letter is not a call for a specific action to buy, sell or short any of the stocks provided. There are NO sure things or guaranteed returns on the daily selection of "Diamonds in the Rough."
Regarding BUY/SELL Signals: The signal status reported herein is based upon mechanical trading model signals and crossovers. They define the implied bias of the price index/stock based upon moving average relationships and momentum, but they do not necessarily call for a specific action. They are information flags that should prompt chart review. Further, they do not call for continuous buying or selling during the life of the signal. For example, a BUY signal will probably (but not necessarily) return the best results if action is taken soon after the signal is generated. Additional opportunities for buying may be found as price zigzags higher, but the trader must look for optimum entry points. Conversely, exit points to preserve gains (or minimize losses) may be evident before the model mechanically closes the signal.
Helpful DecisionPoint Links:
Price Momentum Oscillator (PMO)
Swenlin Trading Oscillators (STO-B and STO-V)
For more links, go to DecisionPoint.com