
The scans were okay today as far as the number of results. I'm still trying to concentrate on finding rising trends if possible as I believe that is where we'll find the most success.
Since I picked Technology as the Sector to Watch, I was loosely looking for possible opportunities there. At the same time, it didn't perform that great today. I opted not to present it, but I did find a Semiconductor that looks interesting (IDCC), but other than that I wasn't seeing much from the Technology sector today.
I ended up picking a Financial, a Consumer Staple, a Healthcare stock and Real Estate.
Hope your trading week is starting off positive!
Good Luck & Good Trading,
Erin
Today's "Diamonds in the Rough": CASY, CI, CME and PMT.
Runner-ups: CWEN, IDCC, ALKS and FNF.

Diamond Mine Trading Room:
RECORDING & DOWNLOAD LINK (4/25/2025):
Topic: DecisionPoint Diamond Mine (4/25/2025) LIVE Trading Room
Download & Recording LINK
Passcode: April#25
REGISTRATION for 5/2/2025:
When: May 2, 2025 09:00 AM Pacific Time (US and Canada)
Topic: DecisionPoint Diamond Mine LIVE Trading Room
Register in advance for this webinar HERE
After registering, you will receive a confirmation email containing information about joining the webinar.
Below is our last free DecisionPoint Trading Room recording from 4/28.
Welcome to DecisionPoint Diamonds, wherein I highlight ten "Diamonds in the Rough" per week. These are selected from the results of my DecisionPoint Scans which search for stocks that could benefit from the trend and condition of the market. Remember, these are not recommendations to buy or sell, but are the most interesting of the stocks that surfaced in my scans. My objective is to save you the work of the initial, tedious culling process, but you need to apply your own analysis to see if these stocks pique your interest as well. There are no guaranteed winners here!
"Predefined Scans Triggered" are taken from StockCharts.com using the "Symbol Summary" option instead of a "SharpChart" on the workbench.
Stop levels are all rounded down.
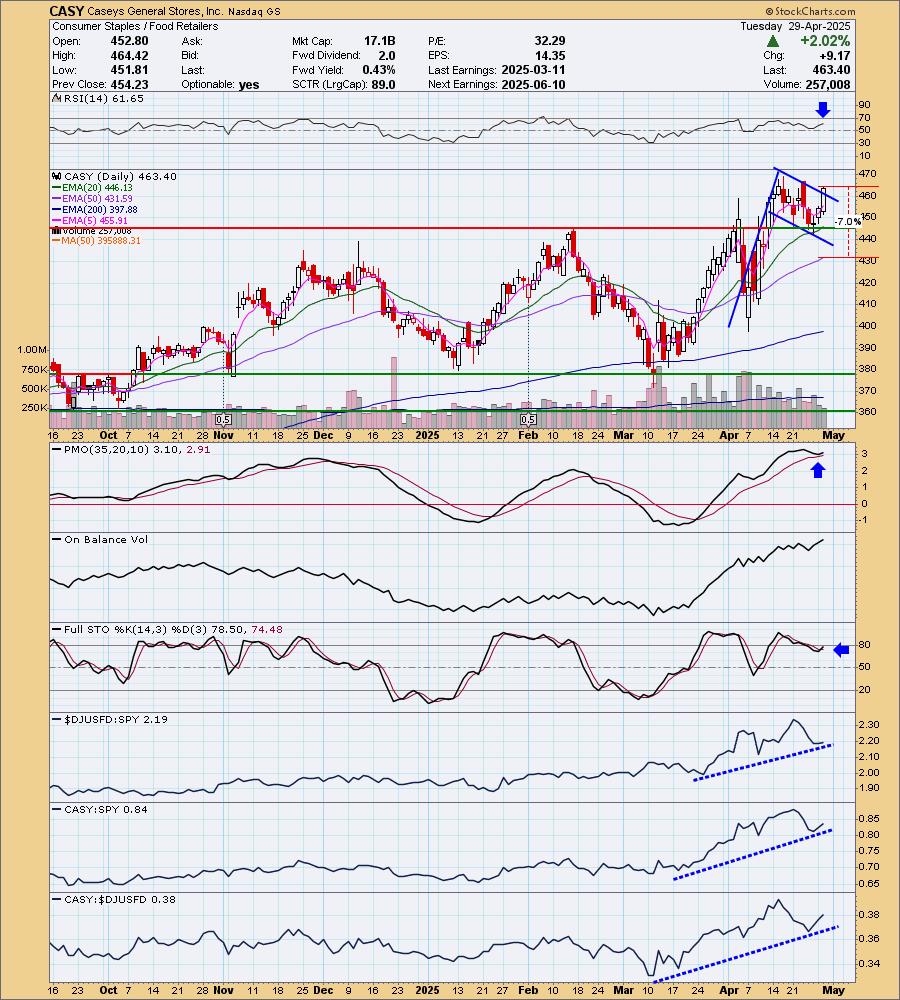
Caseys General Stores, Inc. (CASY)
EARNINGS: 2025-06-10 (AMC)
Casey's General Stores, Inc. engages in the provision of management and operation of convenience stores and gasoline stations. It provides self-service gasoline, a wide selection of grocery items, and an array of freshly prepared food items. The firm offers food, beverages, tobacco products, health and beauty aids, automotive products, and other non-food items. The company was founded by Donald F. Lamberti in 1968 and is headquartered in Ankeny, IA.
Predefined Scans Triggered: Elder Bar Turned Green.
CASY is unchanged in after hours trading. I spotted a bull flag on this one. It also has a nice rising trend and breakout from a longer-term trading range. The RSI is positive and not overbought. The PMO has surged above the signal line. It is well above the zero line as well. Stochastics had been falling but have now reversed in positive territory. Relative strength studies are excellent with the group and CASY outperforming the SPY. CASY is also holding a leadership role as it is seeing rising relative strength against the group. The stop is set at the 50-day EMA at 7% or $430.96.
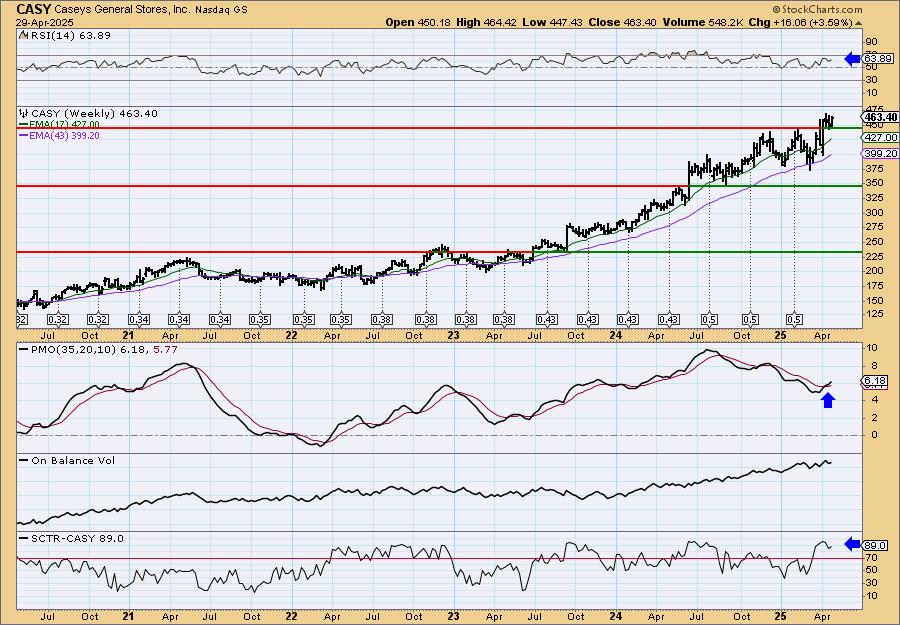
The weekly chart is excellent as we see a steady rising trend and recent breakout. The weekly RSI is positive and not overbought. The weekly PMO is on a recent Crossover BUY Signal. I also see that the StockCharts Technical Rank (SCTR) is in the hot zone* above 70. Consider a 17% upside target to about $542.18.
*If a stock is in the "hot zone" above 70, it implies that it is stronger than 70% of its universe (large-, mid-, small-caps and ETFs) primarily in the intermediate to long terms.
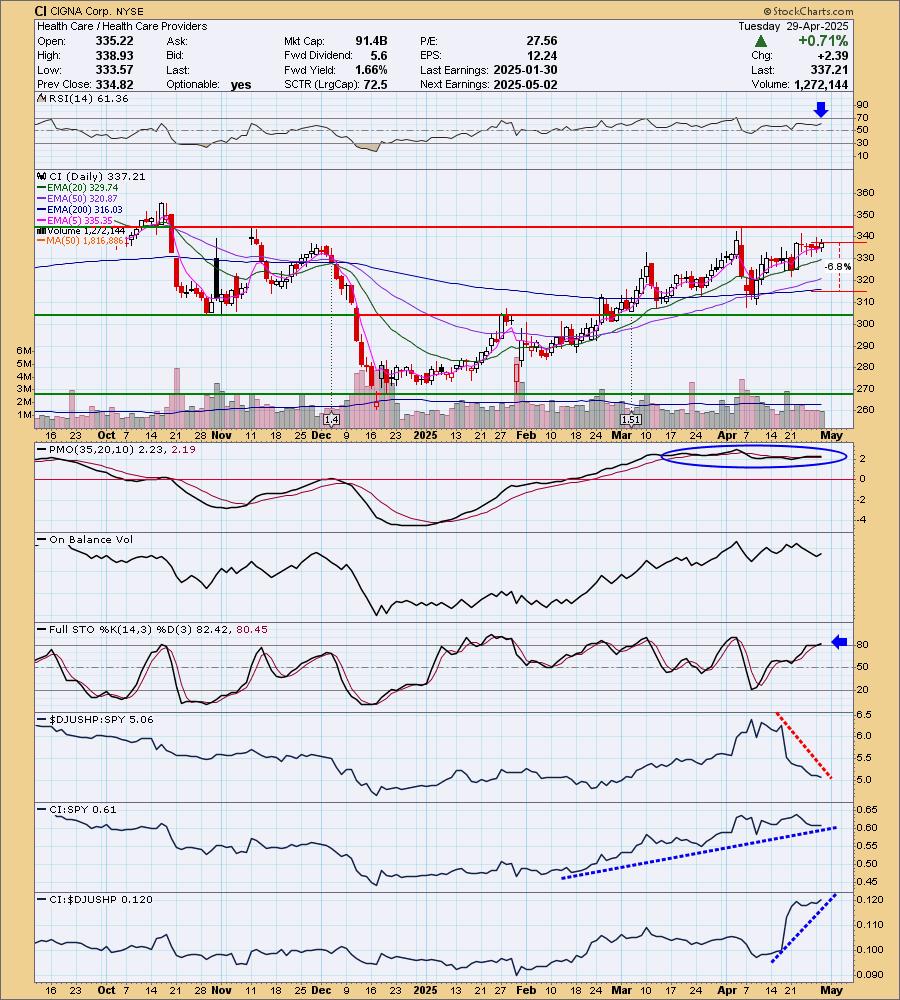
CIGNA Corp. (CI)
EARNINGS: 2025-05-02 (BMO)
The Cigna Group is a global health company, which engages in the provision of global health services. It operates through the following segments: Evernorth Health Services, Cigna Healthcare, Other Operations, and Corporate. The Evernorth Health Services segment partners with health plans, employers, governmental organizations, and health care providers to solve challenges in the areas of pharmacy benefits, home delivery pharmacy, specialty pharmacy, specialty distribution, and care delivery and management solutions. The Cigna Healthcare segment includes the U.S. Healthcare and International Health operating segments, which provide comprehensive medical and coordinated solutions to clients and customers. The Other Operations segment consists of the remainder of business operations, which includes certain ongoing businesses and exited businesses. The Corporate segment refers to net interest expense, certain litigation matters, expense associated with frozen pension plans, charitable contributions, operating severance, certain overhead and enterprise-wide project costs, and eliminations for products and services sold between segments. The company was founded in 1792 and is headquartered in Bloomfield, CT.
Predefined Scans Triggered: Elder Bar Turned Green and P&F Double Top Breakout.
CI is up +0.17% in after hours trading. I really liked the steady rising trend on this one. The PMO is flat above the zero line as we have pure strength in this rising trend. The RSI is positive and not overbought which is good considering the rally it has been in. Stochastics are above 80 now. The group is not performing well, but I'm okay with it as CI is clearly outperforming both the group and the SPY. The stop is set below the 200-day EMA at 6.8% or $314.27.
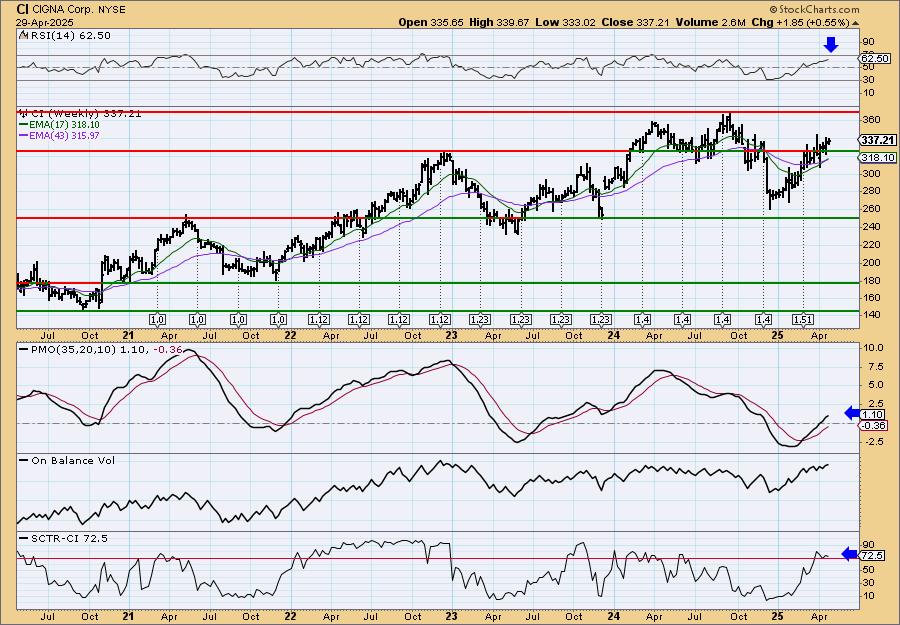
The weekly chart is bullish, but I would like to see it break out above the 2024 high. It is in a nice rising trend coming off strong support. The weekly RSI is positive and not overbought. The weekly PMO is rising strongly. The SCTR is even in the hot zone. Consider a 17% upside target to about $394.54.
CME Group Inc. (CME)
EARNINGS: 2025-07-23 (BMO)
CME Group, Inc. operates a derivatives marketplace, which offers a range of futures and options products for risk management. Its exchanges offer a range of global benchmark products across all major asset classes based on interest rates, equity indexes, foreign exchange (FX), energy, agricultural commodities and metals. It offers futures and options on futures trading across asset classes through the CME Globex platform, fixed income trading via BrokerTec and FX trading on the EBS platform. In addition, it also operates CME Clearing, a central counterparty clearing provider. The company was founded in 1898 and is headquartered in Chicago, IL.
Predefined Scans Triggered: Moved Above Upper Bollinger Band and P&F Double Top Breakout.
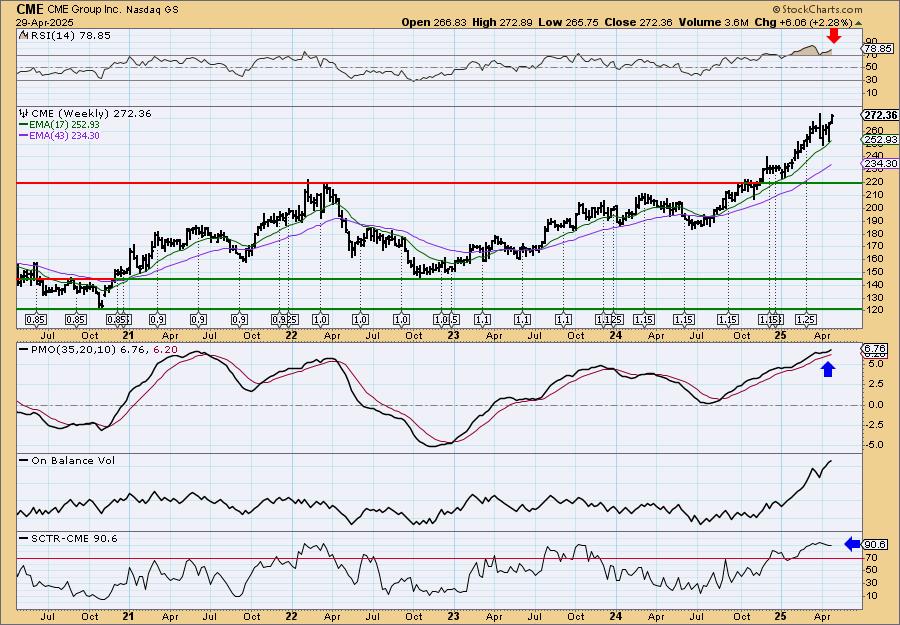
CME is up +0.23% in after hours trading. I really liked the recent breakout here from the trading range. There is an overall strong rising trend. The RSI is positive and not overbought. The PMO is on a Crossover BUY Signal. Stochastics are above 80. We have very strong relative strength for the group and CME. The stop is set beneath support at 7.8% or $251.11.

The rising trend looks fantastic on the weekly chart. The main problem is that it is now very overbought. This hasn't been much of a problem for weeks so it could persist in overbought territory. It's a strong bull market that CME is in right now. The weekly PMO has surged above the signal line well above the zero line. The SCTR is in the hot zone. Consider a 17% upside target to $318.66.
PennyMac Mortgage Investment Trust (PMT)
EARNINGS: 2025-07-22 (AMC)
PennyMac Mortgage Investment Trust is a finance company, which invests primarily in residential mortgage loans and mortgage-related assets. It operates through the following segments: Correspondent Production, Credit Sensitive Strategies, Interest Rate Sensitive Strategies, and Corporate. The Correspondent Production segment deals with purchasing, pooling, and reselling newly originated prime credit quality mortgage loans either directly or in the form of mortgage-backed securities in capital markets. The Credit Sensitive Strategies segment includes investments in distressed mortgage loans, real estate acquired in settlement of mortgage loans, real estate held for investment, credit risk transfer agreements, non-agency subordinated bonds, and small balance commercial real estate mortgage loans. The Interest Rate Sensitive Strategies segment focuses on investments in mortgage servicing rights, excess servicing spread, agency and senior non-agency mortgage-backed securities, and the related interest rate hedging activities. The Corporate segment includes management fee and corporate expense amounts and certain interest income. The company was founded by Stanford L. Kurland on May 18, 2009 and is headquartered in Westlake Village, CA.
Predefined Scans Triggered: Elder Bar Turned Green, Bullish MACD Crossovers and P&F Bull Trap.
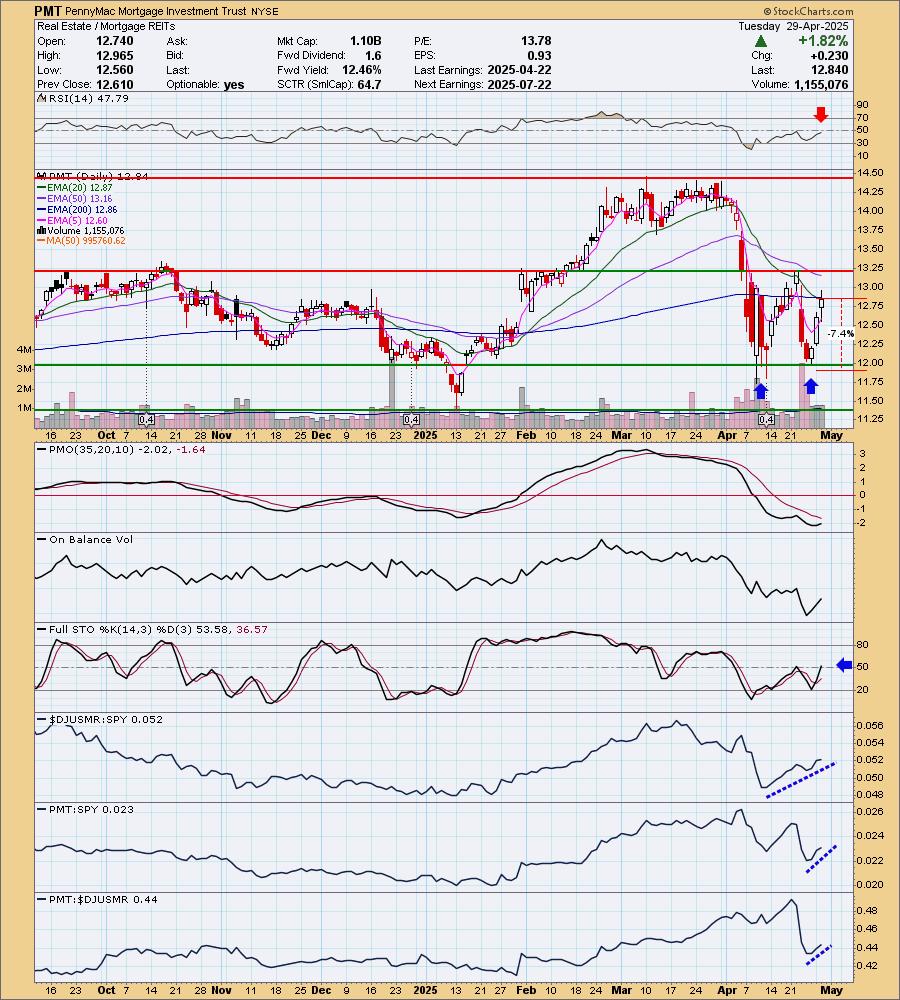
PMT is up +0.93% in after hours trading. The double bottom pattern is what got me on this chart. It looks textbook so I would expect to see it breakout there. We have three strong days of rally. The RSI is still in negative territory. The PMO has just recently turned up. Stochastics have just moved into positive territory. The group is already performing well against the SPY. PMT is just now beginning to see some outperformance. The stop is set beneath support at 7.4% or $11.88.
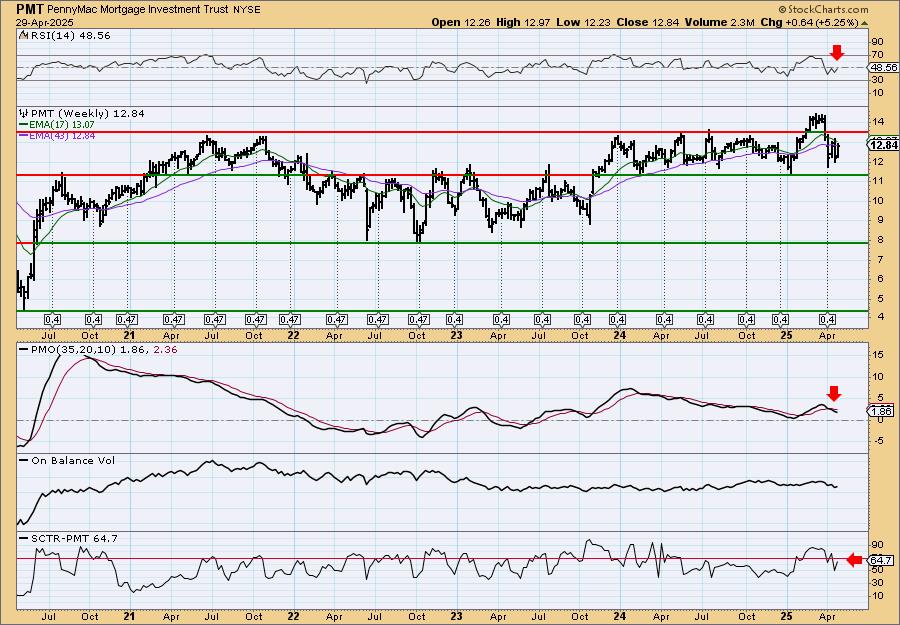
The weekly chart isn't much to look at given the long-term trading range. The weekly RSI is still negative as well. The weekly PMO is falling on a Crossover SELL Signal. The SCTR is near but not in the hot zone. Keep this one in the short-term timeframe until this weekly chart shapes up. Consider a 17% upside target to $15.02.
Don't forget, on Thursdays I look at reader-requested symbols, click HERE to send me an email. I read every email I receive and try to answer them all!
Current Market Outlook:
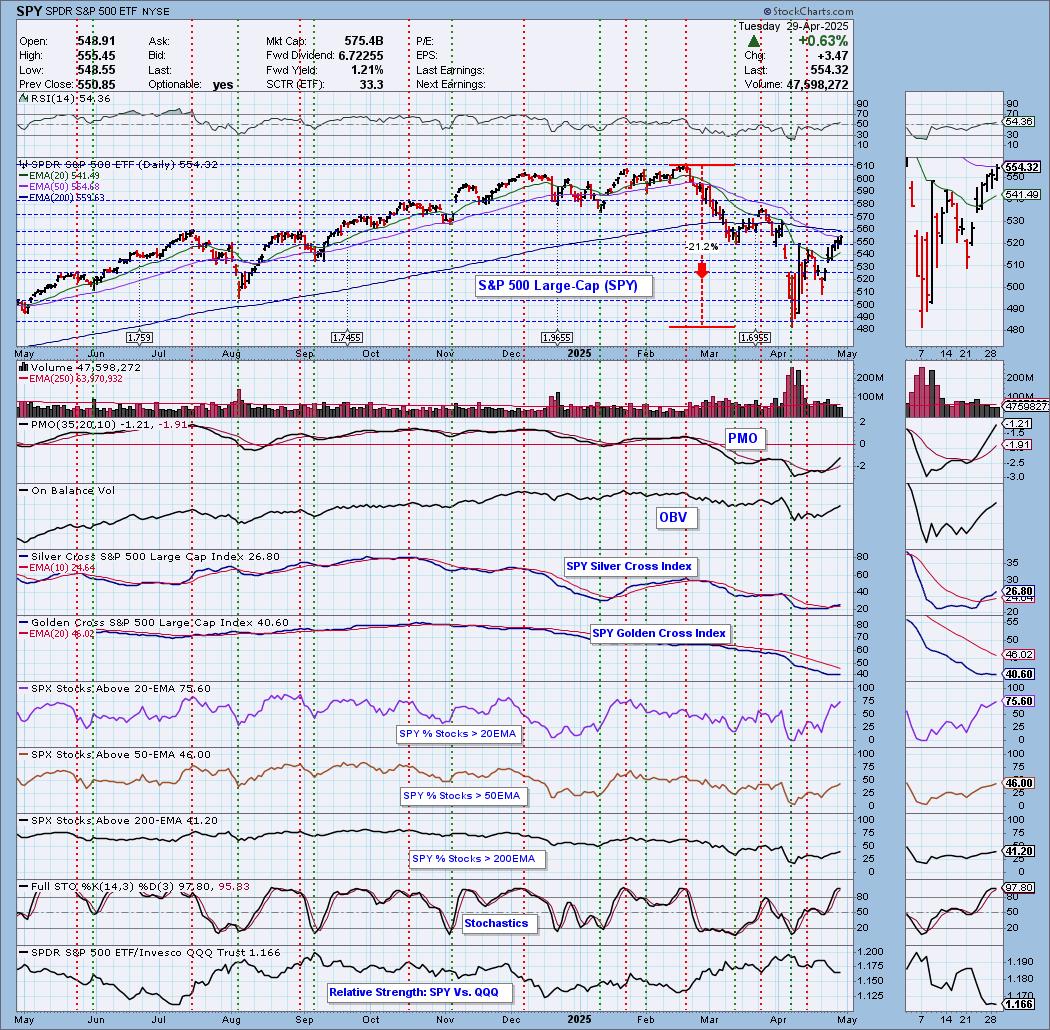
Market Environment: It is important to consider the odds for success by assessing the market tides. The following chart uses different methodologies for objectively showing the depth and trend of participation for intermediate- and long-term time frames.
- The Silver Cross Index (SCI) shows the percentage of SPX stocks on IT Trend Model BUY signals (20-EMA > 50-EMA)
- The Golden Cross Index (GCI) shows the percentage of SPX stocks on LT Trend Model BUY signals (50-EMA > 200-EMA)
Don't forget that as a "Diamonds" member, you have access to our "Under the Hood" curated ChartList on DecisionPoint.com. You'll find it under "Members Only" links on the left side on the Blogs and Links Page.
Here is the current chart:
Full Disclosure: I am 10% long, 0% short.
I'm required to disclose if I currently own a stock I mention and/or may buy/short it within the next 72 hours.
"Technical Analysis is a windsock, not a crystal ball." - Carl Swenlin
(c) Copyright 2025 DecisionPoint.com
Watch the latest episode of DecisionPoint Trading Room with Carl Swenlin & Erin Swenlin Mondays on the DecisionPoint YouTube channel here!
NOTE: The stocks reported herein are from mechanical trading model scans that are based upon moving average relationships, momentum and volume. DecisionPoint analysis is then applied to get five selections from the scans. The selections given should prompt readers to do a chart review using their own analysis process. This letter is not a call for a specific action to buy, sell or short any of the stocks provided. There are NO sure things or guaranteed returns on the daily selection of "Diamonds in the Rough."
Regarding BUY/SELL Signals: The signal status reported herein is based upon mechanical trading model signals and crossovers. They define the implied bias of the price index/stock based upon moving average relationships and momentum, but they do not necessarily call for a specific action. They are information flags that should prompt chart review. Further, they do not call for continuous buying or selling during the life of the signal. For example, a BUY signal will probably (but not necessarily) return the best results if action is taken soon after the signal is generated. Additional opportunities for buying may be found as price zigzags higher, but the trader must look for optimum entry points. Conversely, exit points to preserve gains (or minimize losses) may be evident before the model mechanically closes the signal.
Helpful DecisionPoint Links:
Price Momentum Oscillator (PMO)
Swenlin Trading Oscillators (STO-B and STO-V)
For more links, go to DecisionPoint.com