
* * * * * * * * * * * * * *
Carl has decided to retire, and Erin will be joining him in retirement. We will continue publication until June 27th, and we will be contacting you soon via email as to how this will affect your subscriptions.
* * * * * * * * * * * * * *
It was not a very good day as far as the scans went. There were very few results and that made selection tough. One of the stocks that came through was from the industry group to watch: Heavy Construction. Since the scans did not produce today I did go back and picked one of the Heavy Construction stocks we found on Friday. So I have two from that hot industry group.
The other two had good looking charts, but ultimately picking stocks right now is tough work. I noticed the Diamond Dog Scan that picks up shorts did have quite a few results today. I opted not to go with a short, but it does tell me there might be internal problems within the market. Be careful out there.
Good Luck & Good Trading,
Erin
Today's "Diamonds in the Rough": AGX, KBR, OGS and PLMR.

Diamond Mine Trading Room:
RECORDING & DOWNLOAD LINK (5/2/2025):
Topic: DecisionPoint Diamond Mine (5/2/2025) LIVE Trading Room
Download & Recording Link
Passcode: May##2nd
REGISTRATION for 5/9/2025:
When: May 9, 2025 09:00 AM Pacific Time (US and Canada)
Topic: DecisionPoint Diamond Mine LIVE Trading Room
Register in advance for this webinar HERE
After registering, you will receive a confirmation email containing information about joining the webinar.
Welcome to DecisionPoint Diamonds, wherein I highlight ten "Diamonds in the Rough" per week. These are selected from the results of my DecisionPoint Scans which search for stocks that could benefit from the trend and condition of the market. Remember, these are not recommendations to buy or sell, but are the most interesting of the stocks that surfaced in my scans. My objective is to save you the work of the initial, tedious culling process, but you need to apply your own analysis to see if these stocks pique your interest as well. There are no guaranteed winners here!
"Predefined Scans Triggered" are taken from StockCharts.com using the "Symbol Summary" option instead of a "SharpChart" on the workbench.
Stop levels are all rounded down.
Argan, Inc. (AGX)
EARNINGS: 2025-05-29 (AMC)
Argan, Inc. is a construction company, which engages in the operations of its wholly owned subsidiaries. It operates through the following business segments: Power Industry Services, Telecommunications Infrastructure Services, and Industrial Fabrication and Field Services. The Power Industry Services segment includes engineering, procurement, construction, commissioning, maintenance, project development, and technical consulting services to the power generation market. The Telecommunications Infrastructure Services segment offers project management, construction, installation, and maintenance services. The Industrial Fabrication and Field Services segment provides primarily on-site services that support new plant construction and additions, maintenance turnarounds, shutdowns, and emergency mobilizations for industrial plants. It also operates through the United States, Republic of Ireland, United Kingdom, and Other geographical segments. The company was founded by Rainer H. Bosselmann in May 1961 and is headquartered in Arlington, VA.
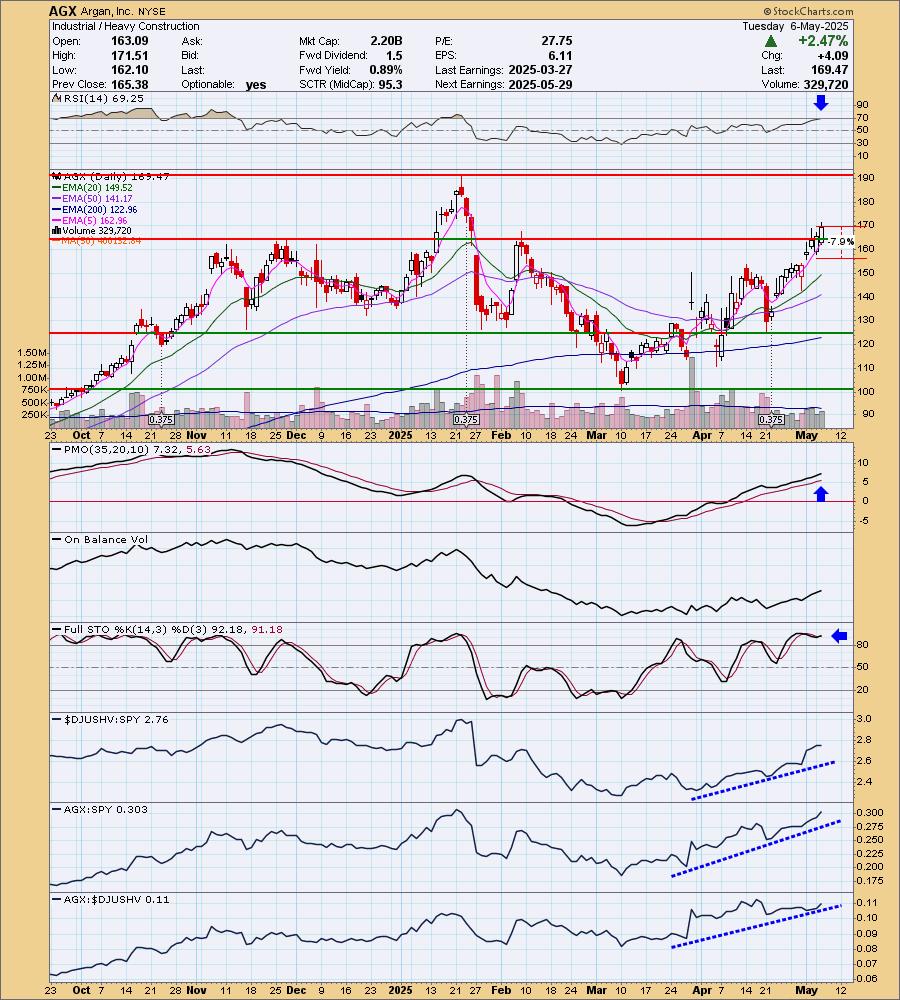
Predefined Scans Triggered: Moved Above Upper Price Channel, P&F Ascending Triple Top Breakout, P&F Double Top Breakout, Moved Above Upper Keltner Channel and Stocks in a New Uptrend (ADX).
AGX is down -0.87% in after hours trading so it may cool a little bit here especially given the RSI is getting overbought. Ultimately this is an excellent breakout move, one that implies we'll see follow-through on. The PMO is rising strongly well above the zero line. Stochastics are rising above 80. Relative strength is strong across the board with nice rising trends. The stop is set as close to gap support as possible at 7.9% or $156.08.
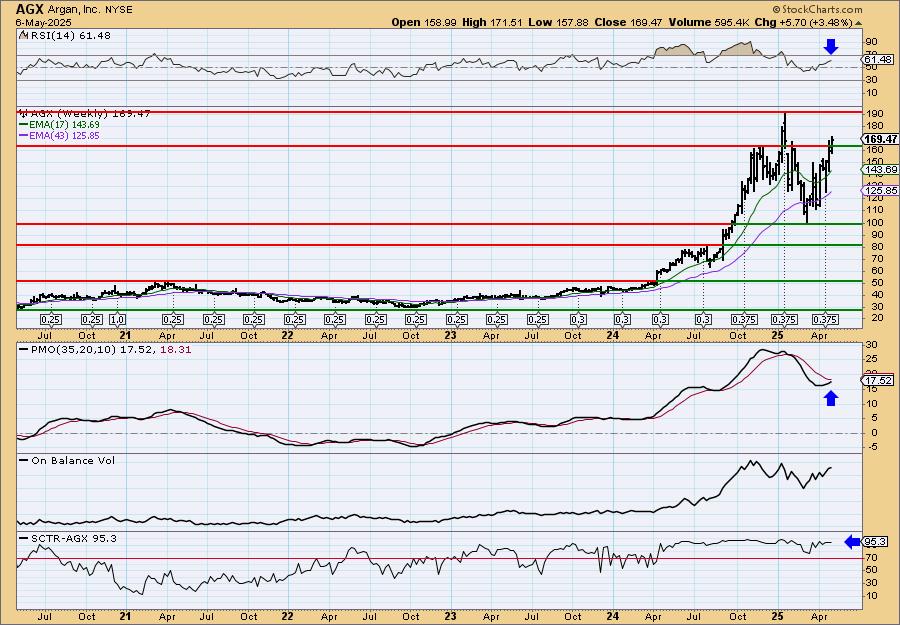
We can see a long-term parabolic advance that ended with a large correction. Price is now headed back up and moved above resistance. The weekly RSI is positive and not overbought. The weekly PMO is rising toward a Crossover BUY Signal well above the zero line. The StockCharts Technical Rank (SCTR) is at the top of the hot zone* implying we will see more upside. Consider a 17% upside target to about $198.28.
*If a stock is in the "hot zone" above 70, it implies that it is stronger than 70% of its universe (large-, mid-, small-caps and ETFs) primarily in the intermediate to long terms.
KBR Inc. (KBR)
EARNINGS: 2025-05-06 (BMO) ** Reported Today **
KBR, Inc. engages in the provision of science, technology, engineering, and logistics support solutions. It operates through the following segments: Government Solutions, Sustainable Technology Solutions, and Other. The Government Solutions segment involves the provision of research and development, advanced prototyping, acquisition support, systems engineering, C5ISR, cyber analytics, space domain awareness, test and evaluation, systems integration and program, global supply chain management, operations readiness and support, and professional advisory services. The Sustainable Technology Solutions segment combines proprietary technologies, equipment, and catalyst supply and associated knowledge-based services into a global business for refining, petrochemicals, inorganic, and specialty chemicals, gasification, syngas, ammonia, nitric acid, and fertilizers. The Other segment includes corporate expenses and selling, general and administrative expenses not allocated to the business segments above. The company was founded on March 21, 2006 and is headquartered in Houston, TX.
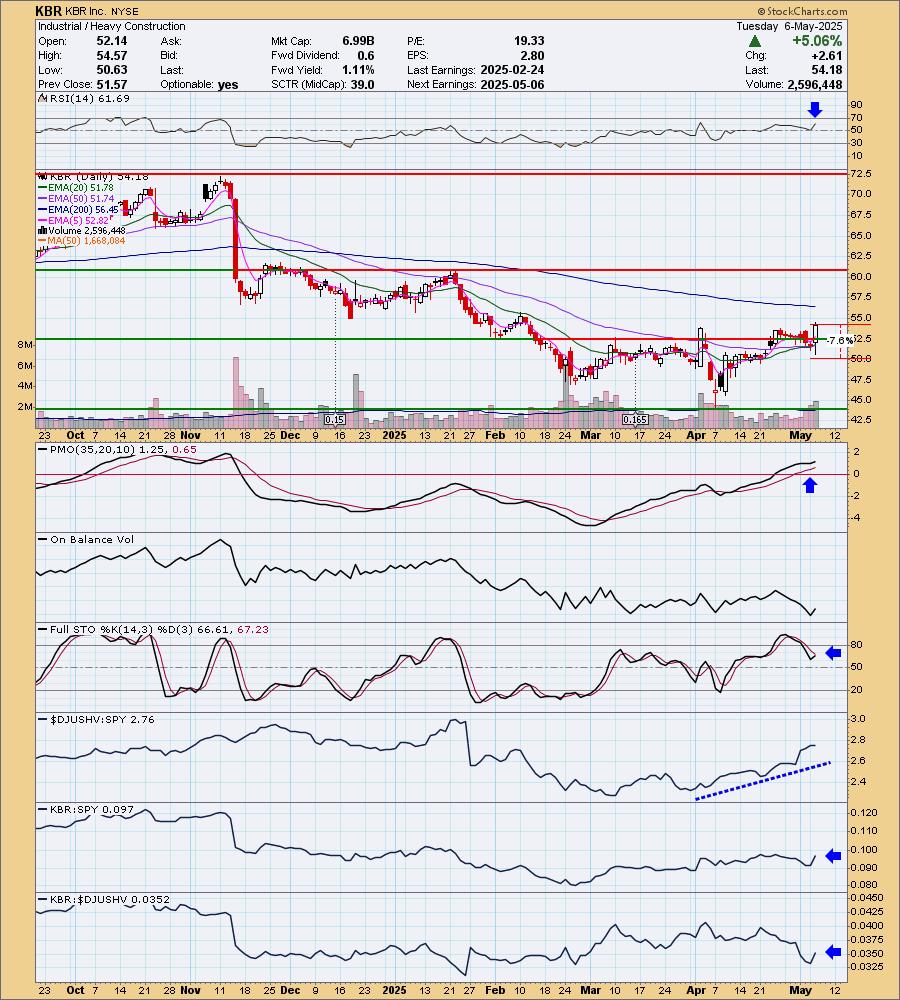
Predefined Scans Triggered: Stocks in a New Uptrend (Aroon), Moved Above Ichimoku Cloud, Elder Bar Turned Green, Moved Above Upper Price Channel and P&F Double Top Breakout.
KBR is down -1.94% in after hours trading so it is shaving some of today's gain. They reported earnings this morning and they were well received suggesting we will see some upside follow-through. I liked the breakout today and what does look like a bottoming formation. The RSI is positive and not overbought. The PMO has surged above the signal line. Stochastics have turned back up in positive territory. This one hasn't been the best performer, but today's rally put it back on the map. The group is still performing very well and now that KBR got an earnings boost I'll be looking for it to move higher from here. The stop is set beneath today's low for the day at 7.6% or $50.06.
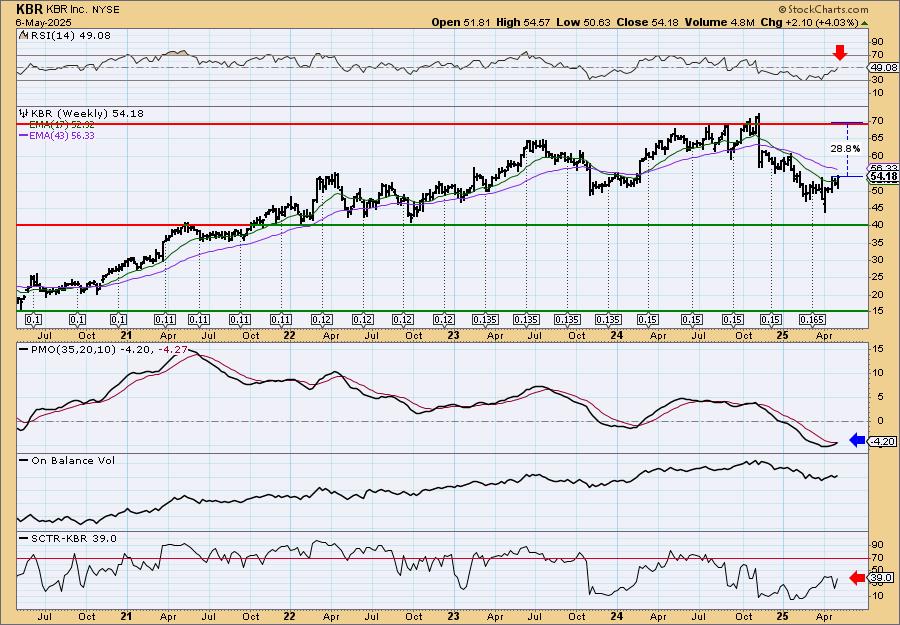
I like that price turned up before having to test support. The weekly RSI is technically negative, but it should push higher soon. The weekly PMO is in the process of triggering a Crossover BUY Signal. The SCTR does need some help, but at least it is rising strongly now. There is plenty of upside potential here.
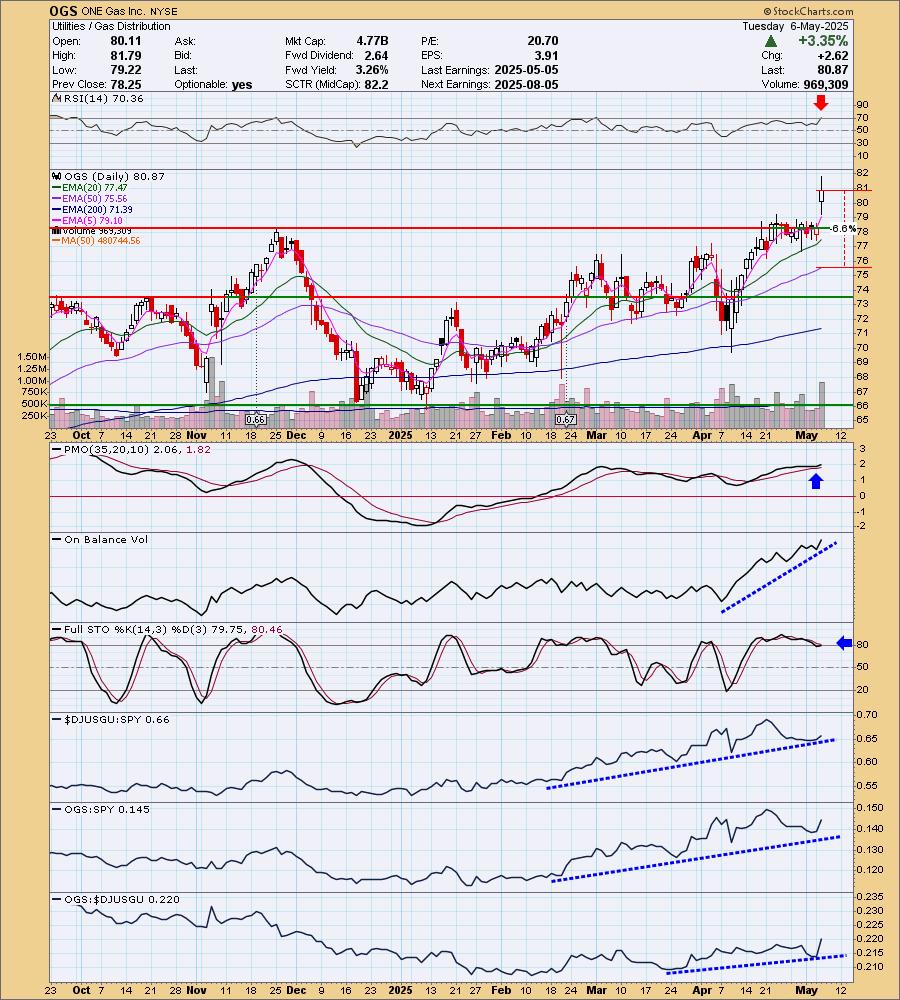
ONE Gas Inc. (OGS)
EARNINGS: 2025-08-05 (AMC)
ONE Gas, Inc. engages in the provision of natural gas distribution services. It offers natural gas to residential, commercial, industrial, and transportation customers. The company was founded in 1906 and is headquartered in Tulsa, OK.
Predefined Scans Triggered: Stocks in a New Uptrend (Aroon), Elder Bar Turned Green, Moved Above Upper Price Channel, New CCI Buy Signals, P&F Double Top Breakout and New 52-week Highs.
OGS is unchanged in after hours trading. They reported yesterday afternoon and today saw an excellent rally that promises more upside. This was a strong breakout from a longer-term trading range. The RSI is admittedly overbought right now, but I wouldn't expect too much of a stumble here given the great configuration of the EMAs and PMO. The PMO has surged above the signal line while above the zero line. Stochastics have turned up and are above 80. This looks like a breakout from a bull flag formation. Relative strength is rising and has been for some time. The stop is set at the 50-day EMA at 6.6% or $75.53.
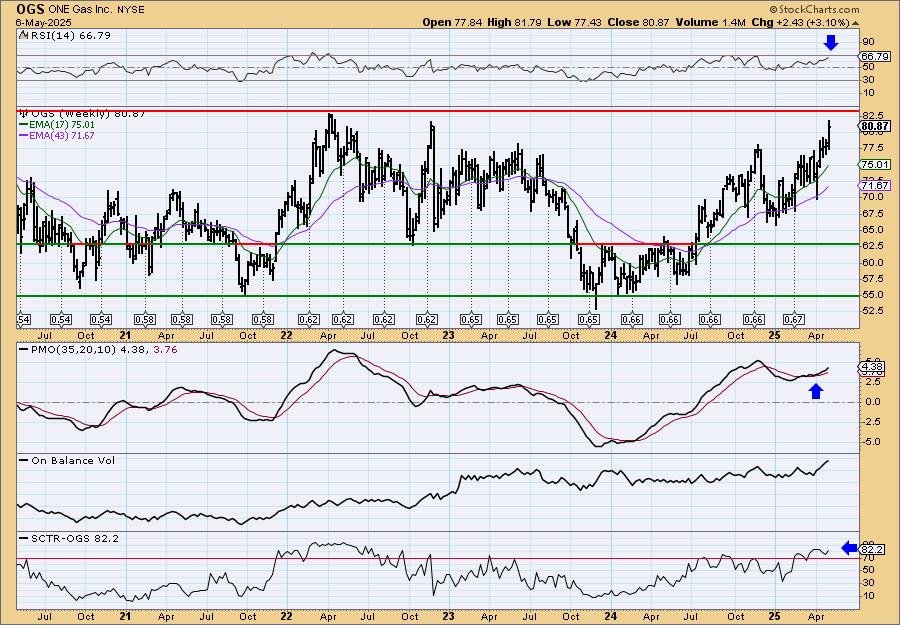
The biggest problem I have with the weekly chart is that price is at the top of its trading range. I do think a breakout is nearing given the strong rising trend, but this is where it may consolidate or pull back somewhat. The weekly RSI is positive and not overbought so a breakout could be accommodated. The weekly PMO is rising on a Crossover BUY Signal well above the zero line. The SCTR is in the hot zone above 70. Consider a 17% upside target to about $94.62.
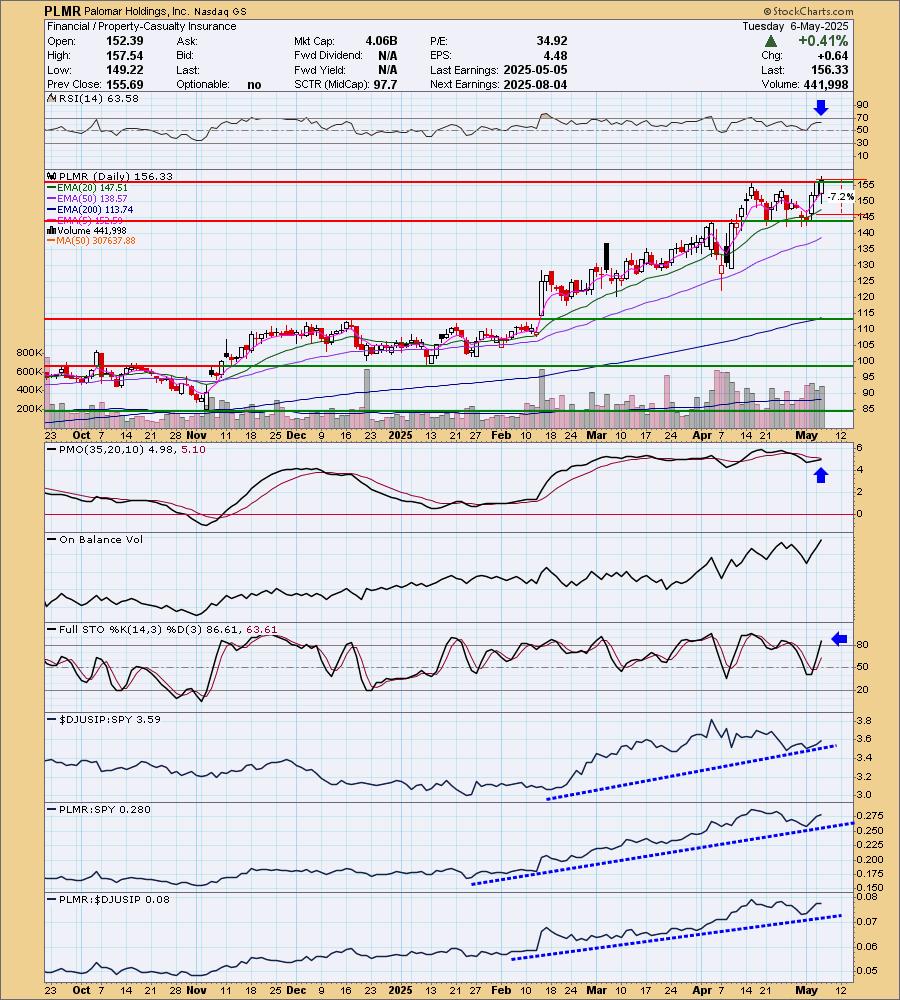
Palomar Holdings, Inc. (PLMR)
EARNINGS: 2025-08-04 (AMC)
Palomar Holdings, Inc. is a specialty insurance company, which engages in the provision of property and casualty insurance products to individuals and businesses. The firm focuses on the residential and commercial earthquake markets in earthquake-exposed states such as California, Oregon, and Washington and states with exposure to the New Madrid Seismic Zone. It offers property and casualty insurance. The company was founded by Armstrong Mac and Fisher Heath in February 2014 and is headquartered in La Jolla, CA.
Predefined Scans Triggered: P&F High Pole, New 52-week Highs and Moved Above Upper Price Channel.
PLMR is unchanged in after hours trading. They reported yesterday and apparently earnings were well received with a breakout move. The RSI is not overbought. The PMO has been flat above the zero line for some time and that implies pure strength. It is currently headed toward a Crossover BUY Signal. Stochastics have popped above 80. Relative strength is excellent for the group and PLMR against the group and SPY. The stop is set below the 20-day EMA at 7.2% or $145.07.
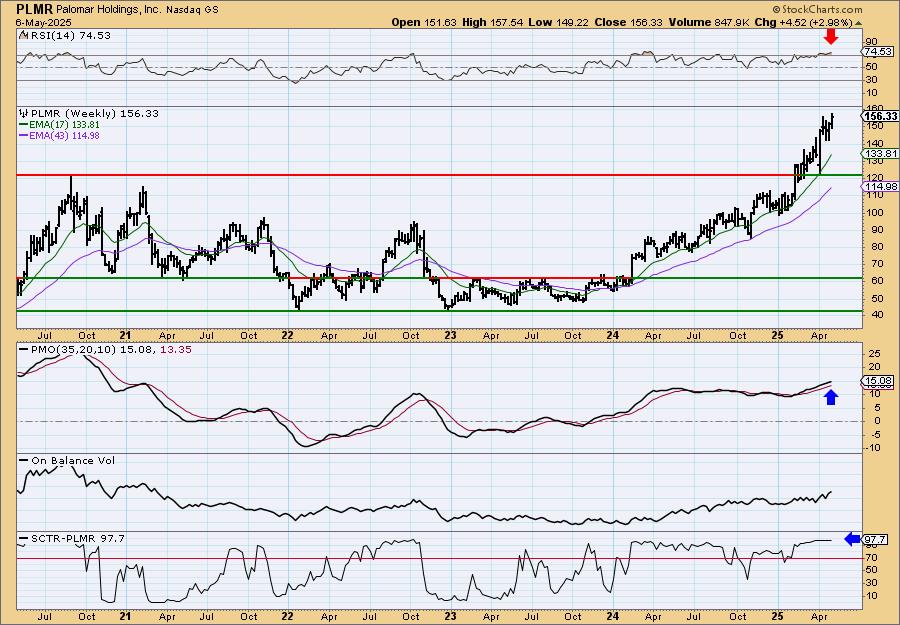
We have a beautiful rising trend coming out of a long-term trading range. It is a bit parabolic in its advance, but it hasn't gone vertical yet. The weekly RSI is overbought and that would imply a hiccup ahead, but ultimately that condition can persist in a strong bull market move like PLMR is seeing. The weekly PMO is rising nicely and the SCTR is at the top of the hot zone. Consider a 17% upside target to about $182.91.
Don't forget, on Thursdays I look at reader-requested symbols, click HERE to send me an email. I read every email I receive and try to answer them all!
Current Market Outlook:
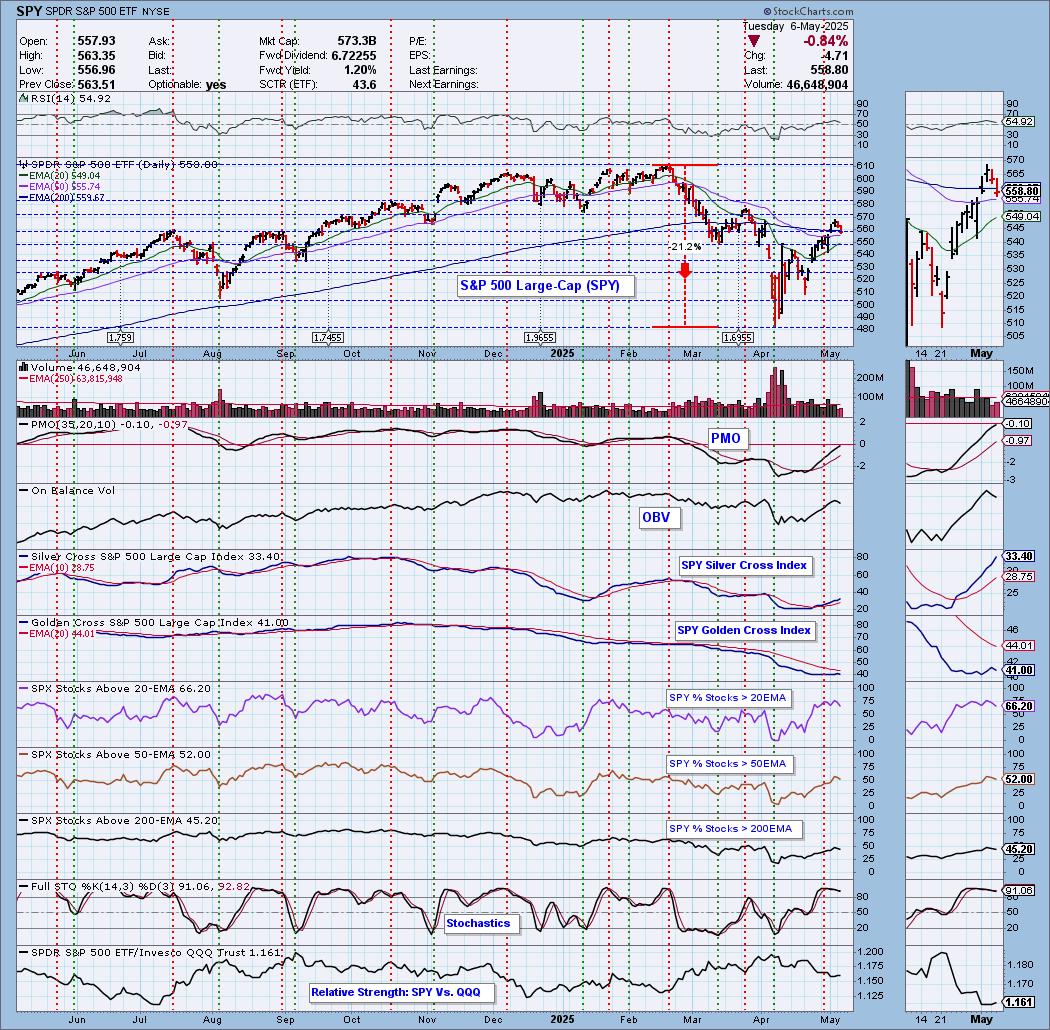
Market Environment: It is important to consider the odds for success by assessing the market tides. The following chart uses different methodologies for objectively showing the depth and trend of participation for intermediate- and long-term time frames.
- The Silver Cross Index (SCI) shows the percentage of SPX stocks on IT Trend Model BUY signals (20-EMA > 50-EMA)
- The Golden Cross Index (GCI) shows the percentage of SPX stocks on LT Trend Model BUY signals (50-EMA > 200-EMA)
Don't forget that as a "Diamonds" member, you have access to our "Under the Hood" curated ChartList on DecisionPoint.com. You'll find it under "Members Only" links on the left side on the Blogs and Links Page.
Here is the current chart:
Full Disclosure: I am 10% long, 0% short.
I'm required to disclose if I currently own a stock I mention and/or may buy/short it within the next 72 hours.
"Technical Analysis is a windsock, not a crystal ball." - Carl Swenlin
(c) Copyright 2025 DecisionPoint.com
Watch the latest episode of DecisionPoint Trading Room with Carl Swenlin & Erin Swenlin Mondays on the DecisionPoint YouTube channel here!
NOTE: The stocks reported herein are from mechanical trading model scans that are based upon moving average relationships, momentum and volume. DecisionPoint analysis is then applied to get five selections from the scans. The selections given should prompt readers to do a chart review using their own analysis process. This letter is not a call for a specific action to buy, sell or short any of the stocks provided. There are NO sure things or guaranteed returns on the daily selection of "Diamonds in the Rough."
Regarding BUY/SELL Signals: The signal status reported herein is based upon mechanical trading model signals and crossovers. They define the implied bias of the price index/stock based upon moving average relationships and momentum, but they do not necessarily call for a specific action. They are information flags that should prompt chart review. Further, they do not call for continuous buying or selling during the life of the signal. For example, a BUY signal will probably (but not necessarily) return the best results if action is taken soon after the signal is generated. Additional opportunities for buying may be found as price zigzags higher, but the trader must look for optimum entry points. Conversely, exit points to preserve gains (or minimize losses) may be evident before the model mechanically closes the signal.
Helpful DecisionPoint Links:
Price Momentum Oscillator (PMO)
Swenlin Trading Oscillators (STO-B and STO-V)
For more links, go to DecisionPoint.com