
It has been awhile since I had a clear theme in the scans. Today it was all about Bonds. I am still somewhat bullish on yields so I wasn't excited about presenting Bond funds, but ultimately that is what the scans told me to do.
Most Bond funds move very slowly and don't offer a lot of upside potential, but conversely they don't go down very fast at all. One of the ETFs I'm presenting is a straight up Bond fund, but I decided since they are so slow to move, that I would find a leveraged version as well.
The third ETF doesn't look that great, but as I said scans were really thin today. I think it certainly has some upside potential, I just think that price is meandering a little more than I'd like.
The market is somewhat directionless right now. It isn't bearish enough to hedge in my opinion but neither is it a great environment to go long. We'll just have to muddle through.
Good Luck & Good Trading,
Erin
Today's "Diamonds in the Rough": HYLS, IHF and UST.
* * * * * * * * * * * * * *
Carl has decided to retire, and Erin will be joining him in retirement. We will continue publication until June 27th, and we will be contacting you soon via email as to how this will affect your subscriptions.
* * * * * * * * * * * * * *

Diamond Mine Trading Room:
RECORDING & DOWNLOAD LINK (5/2/2025):
Topic: DecisionPoint Diamond Mine (5/2/2025) LIVE Trading Room
Download & Recording Link
Passcode: May##2nd
REGISTRATION for 5/9/2025:
When: May 9, 2025 09:00 AM Pacific Time (US and Canada)
Topic: DecisionPoint Diamond Mine LIVE Trading Room
Register in advance for this webinar HERE
After registering, you will receive a confirmation email containing information about joining the webinar.
Welcome to DecisionPoint Diamonds, wherein I highlight ten "Diamonds in the Rough" per week. These are selected from the results of my DecisionPoint Scans which search for stocks that could benefit from the trend and condition of the market. Remember, these are not recommendations to buy or sell, but are the most interesting of the stocks that surfaced in my scans. My objective is to save you the work of the initial, tedious culling process, but you need to apply your own analysis to see if these stocks pique your interest as well. There are no guaranteed winners here!
"Predefined Scans Triggered" are taken from StockCharts.com using the "Symbol Summary" option instead of a "SharpChart" on the workbench.
Stop levels are all rounded down.
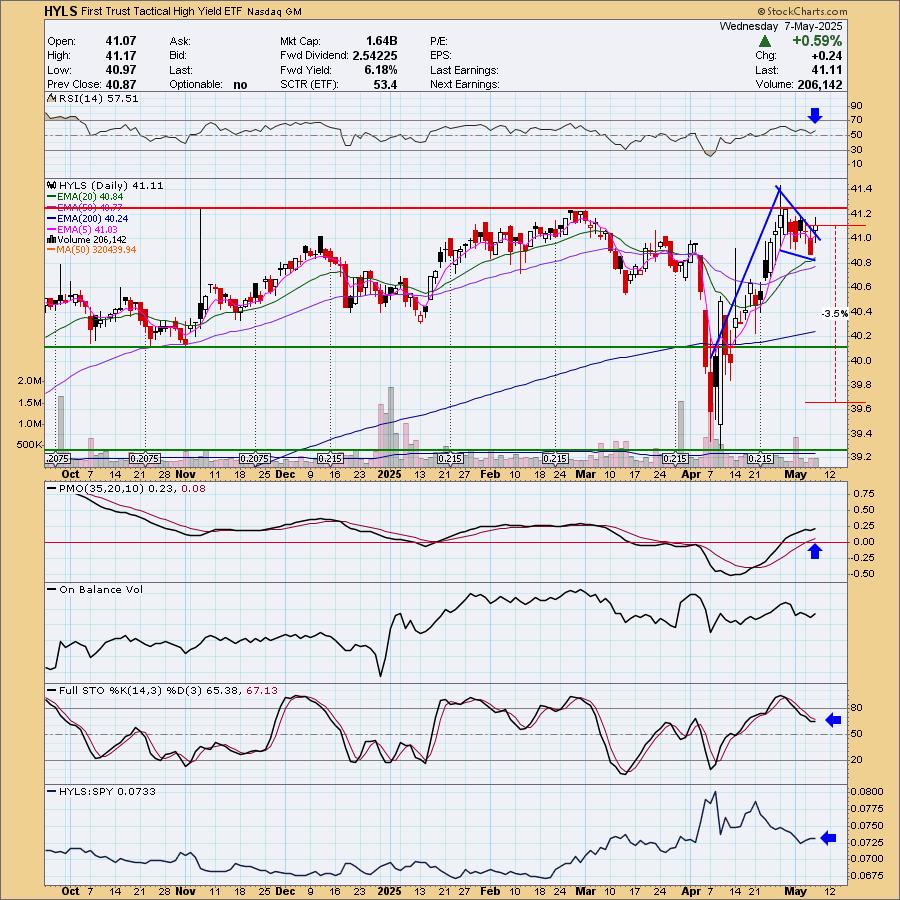
First Trust Tactical High Yield ETF (HYLS)
EARNINGS: N/A
HYLS is an actively managed fund holding up to 130% in long positions in high yield bonds it expects to outperform, and up to 30% short positions in issues it expects to underperform. Click HERE for more information.
Predefined Scans Triggered: Elder Bar Turned Blue, Moved Above Ichimoku Cloud and P&F Double Top Breakout.
HYLS is down -0.66% in after hours trading. I liked the bull flag on the chart. The flag itself is a bullish falling wedge. It is very close to overhead resistance, but the RSI is not overbought so we could get a breakout this time around. The PMO has surged above the signal line above the zero line. Stochastics are in positive territory and appear ready to turn back up. Relative strength isn't great, but at least it is beginning to rise. The stop is thin as this is a slow mover. I set halfway down the prior trading range at 3.5% or $39.67.
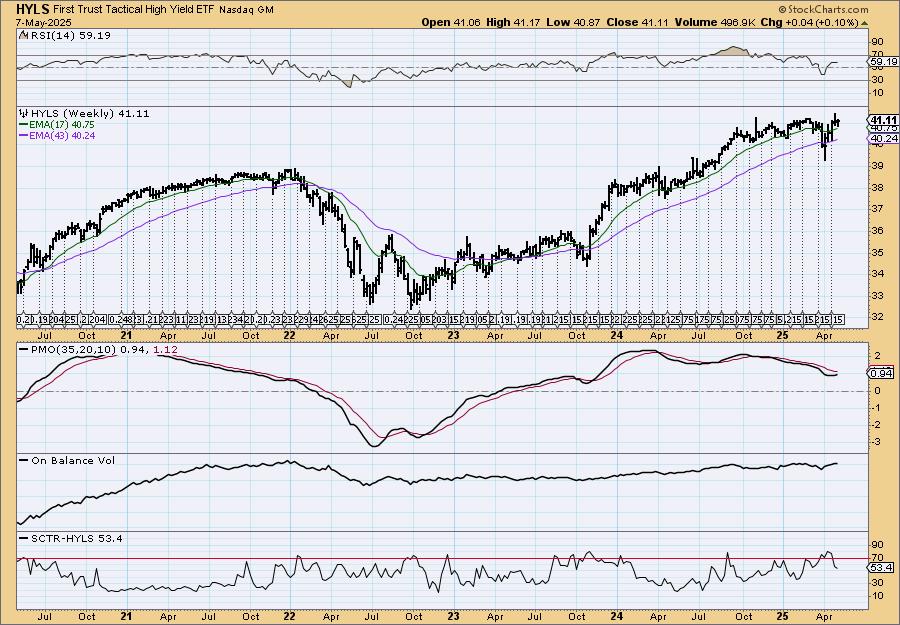
This one does pay a nice yield that makes up for the slow moving ETF. Right now it is close to overhead resistance, but ultimately we have a nice rising trend that pushed us above the 2022 high. The weekly RSI is positive and the weekly PMO is rising. The StockCharts Technical Rank (SCTR) is not in the hot zone* unfortunately and it is headed lower. Consider a 8% upside target to about $44.39.
*If a stock is in the "hot zone" above 70, it implies that it is stronger than 70% of its universe (large-, mid-, small-caps and ETFs) primarily in the intermediate to long terms.
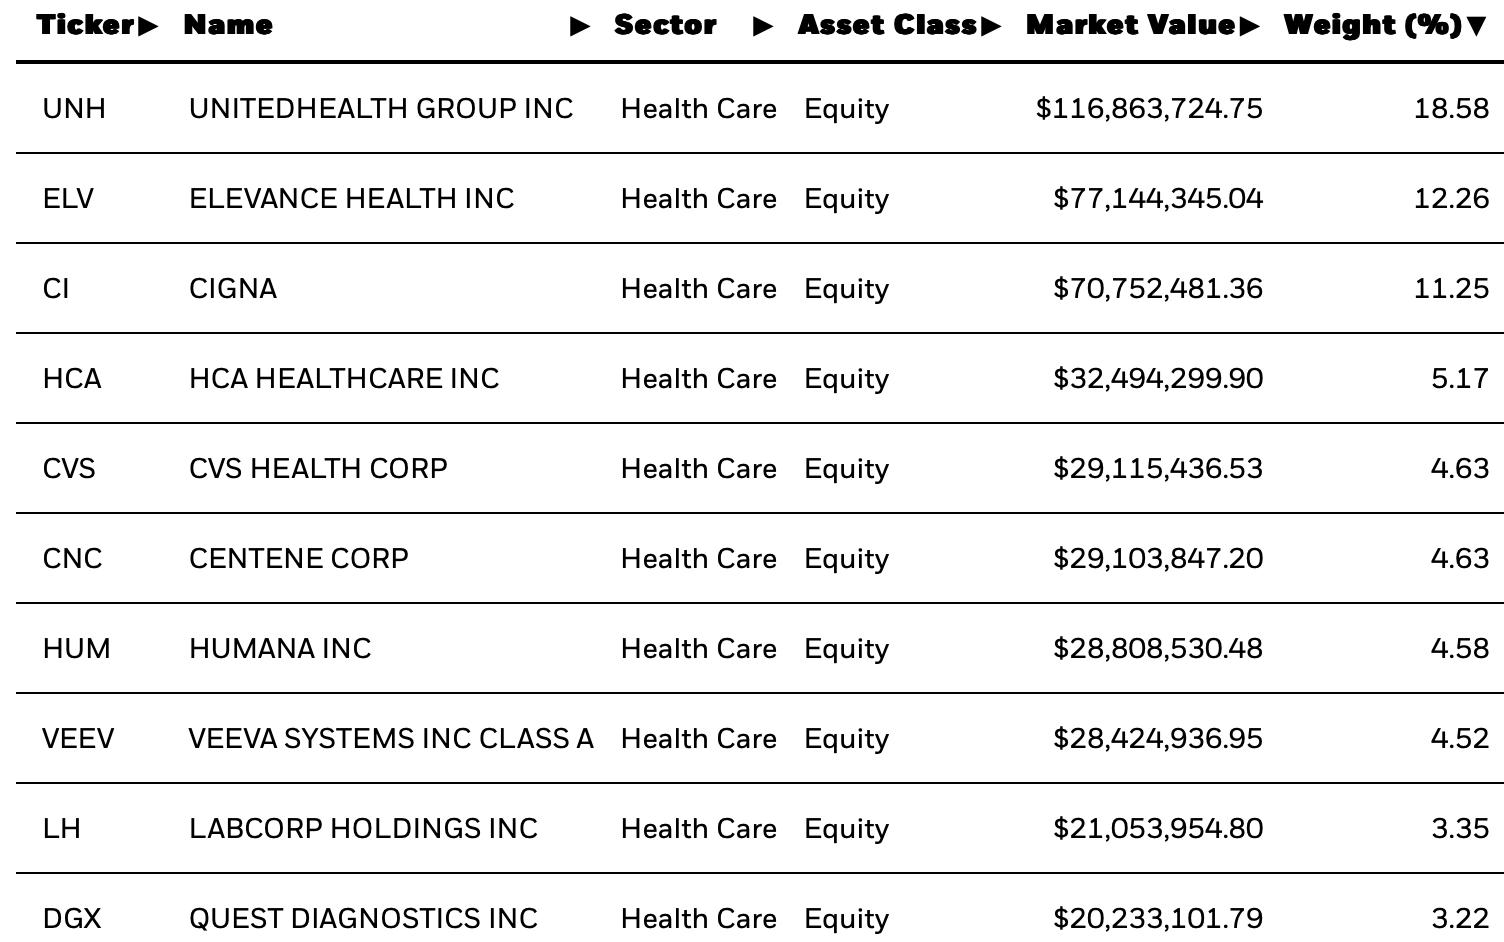
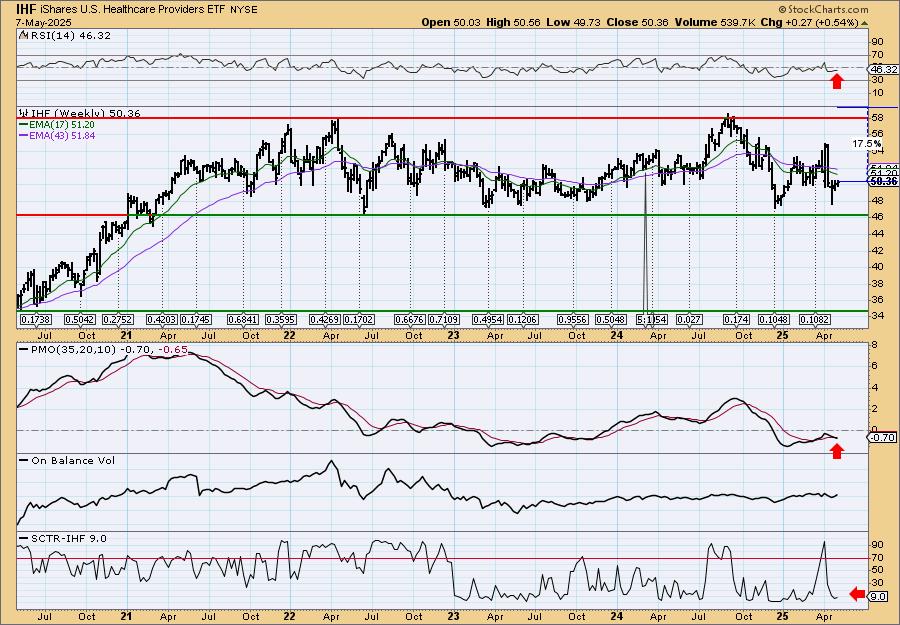
iShares U.S. Healthcare Providers ETF (IHF)
EARNINGS: N/A
IHF tracks a cap-weighted index of US companies that provide healthcare services. Click HERE for more information.
Predefined Scans Triggered: P&F Double Bottom Breakdown, Elder Bar Turned Green and P&F Triple Bottom Breakdown.
IHF is down -1.19% in after hours trading. I liked the bounce off strong support. Notice price did not have to actually touch the support line before reversing, that is bullish. The RSI is not yet positive, but it will rise with price. The PMO has turned up gently. The OBV is rising to confirm the current rally. Stochastics have just moved into positive territory and we are seeing a little bit of outperformance beginning against the SPY. It's not the best chart, but it is bullish overall. The stop is set beneath support at 6.9% or $46.88.
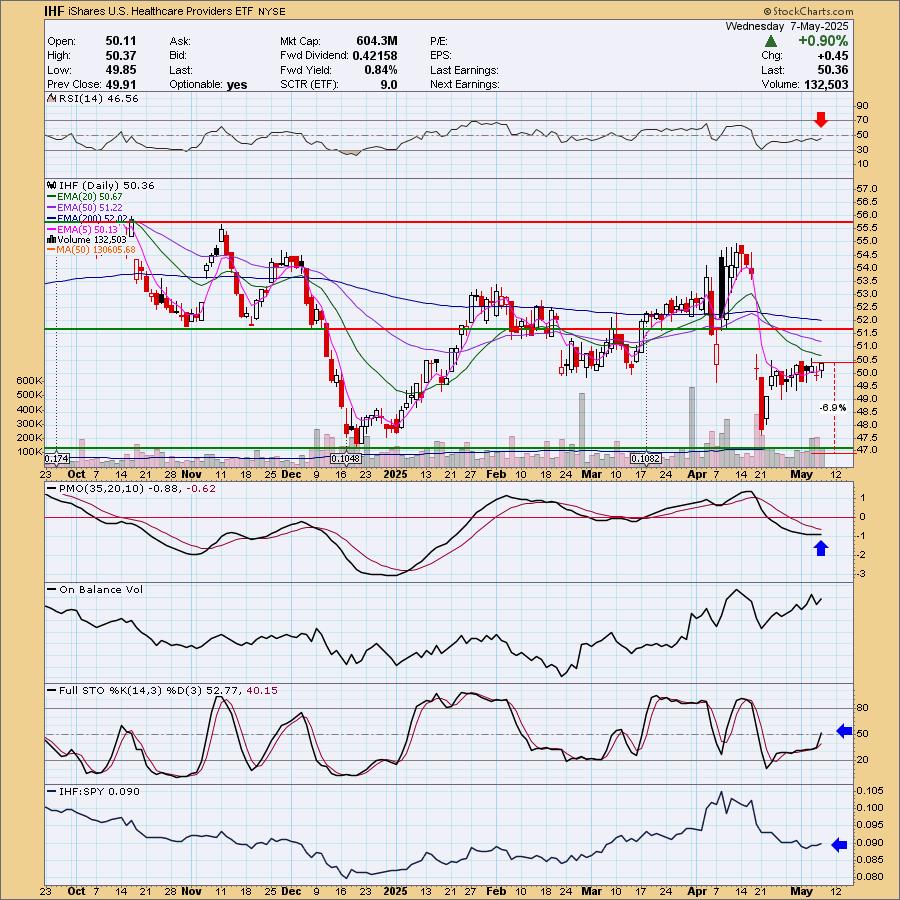
It certainly likes its trading range and right now price is angling up from the bottom of the range so we should expect a move back toward the top of the range. The weekly RSI is still bearish and the weekly PMO is on a new Crossover SELL Signal. The SCTR is terrible. Keep this one in the shorter-term timeframe until the weekly PMO at least turns back up.
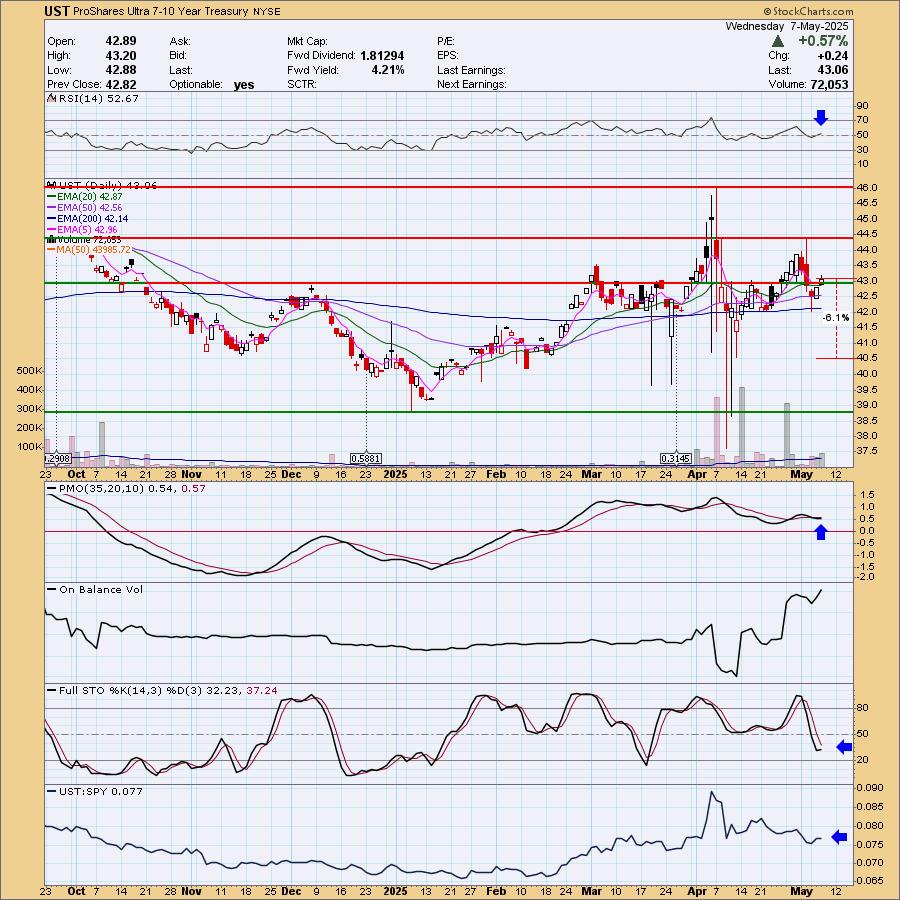
ProShares Ultra 7-10 Year Treasury (UST)
EARNINGS: N/A
UST provides 2x leveraged exposure to an index that tracks the daily performance of US Treasury bonds with remaining maturities between 7 and 10 years. Click HERE for more information.
Predefined Scans Triggered: Elder Bar Turned Green.
UST is unchanged in after hours trading. This is a messy chart. I'm looking at the rebound off the 200-day EMA as a precursor to more upside. The RSI is back in positive territory. The PMO is slowly turning back up and Stochastics have tipped upward. We do see slight outperformance coming in. The stop is set arbitrarily at 6.1% or $40.43.
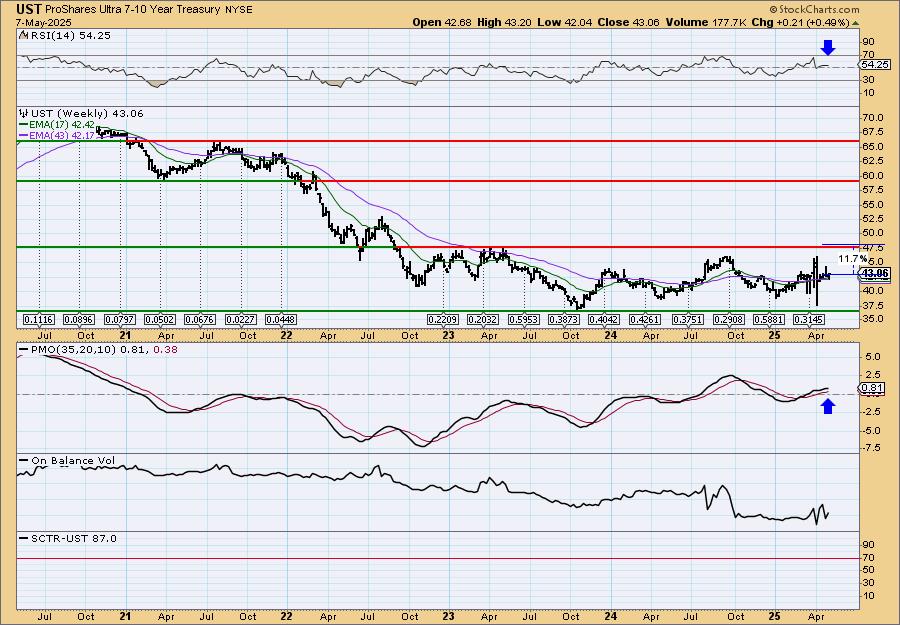
This is another one in a trading range. We're counting on it to get back to the top and maybe break out there. The weekly RSI is positive and the weekly PMO is on the rise so it does look promising. Upside potential is limited but it is considered a safer investment due to low volatility.
Don't forget, on Thursdays I look at reader-requested symbols, click HERE to send me an email. I read every email I receive and try to answer them all!
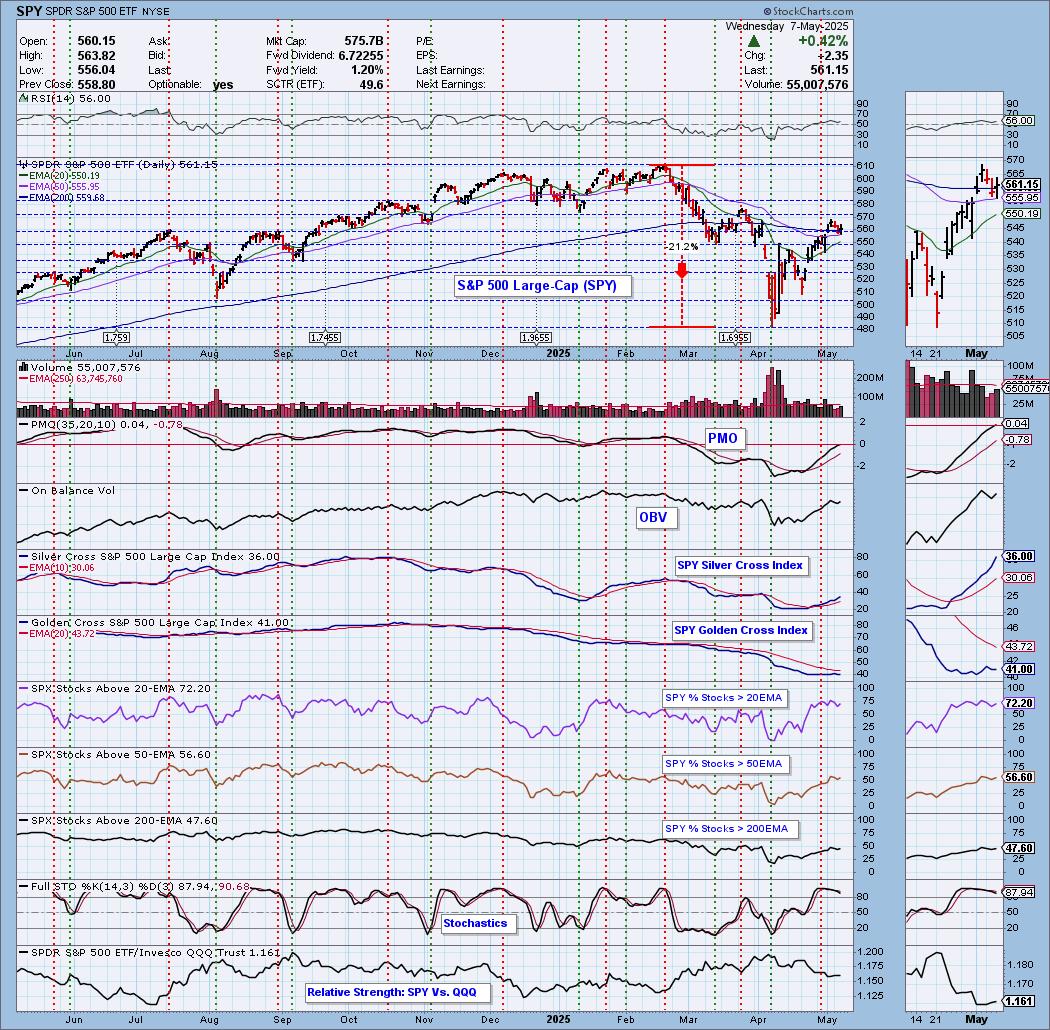
Current Market Outlook:
Market Environment: It is important to consider the odds for success by assessing the market tides. The following chart uses different methodologies for objectively showing the depth and trend of participation for intermediate- and long-term time frames.
- The Silver Cross Index (SCI) shows the percentage of SPX stocks on IT Trend Model BUY signals (20-EMA > 50-EMA)
- The Golden Cross Index (GCI) shows the percentage of SPX stocks on LT Trend Model BUY signals (50-EMA > 200-EMA)
Don't forget that as a "Diamonds" member, you have access to our "Under the Hood" curated ChartList on DecisionPoint.com. You'll find it under "Members Only" links on the left side on the Blogs and Links Page.
Here is the current chart:
Full Disclosure: I am 10% long, 0% short.
I'm required to disclose if I currently own a stock I mention and/or may buy/short it within the next 72 hours.
"Technical Analysis is a windsock, not a crystal ball." - Carl Swenlin
(c) Copyright 2025 DecisionPoint.com
Watch the latest episode of DecisionPoint Trading Room with Carl Swenlin & Erin Swenlin Mondays on the DecisionPoint YouTube channel here!
NOTE: The stocks reported herein are from mechanical trading model scans that are based upon moving average relationships, momentum and volume. DecisionPoint analysis is then applied to get five selections from the scans. The selections given should prompt readers to do a chart review using their own analysis process. This letter is not a call for a specific action to buy, sell or short any of the stocks provided. There are NO sure things or guaranteed returns on the daily selection of "Diamonds in the Rough."
Regarding BUY/SELL Signals: The signal status reported herein is based upon mechanical trading model signals and crossovers. They define the implied bias of the price index/stock based upon moving average relationships and momentum, but they do not necessarily call for a specific action. They are information flags that should prompt chart review. Further, they do not call for continuous buying or selling during the life of the signal. For example, a BUY signal will probably (but not necessarily) return the best results if action is taken soon after the signal is generated. Additional opportunities for buying may be found as price zigzags higher, but the trader must look for optimum entry points. Conversely, exit points to preserve gains (or minimize losses) may be evident before the model mechanically closes the signal.
Helpful DecisionPoint Links:
Price Momentum Oscillator (PMO)
Swenlin Trading Oscillators (STO-B and STO-V)
For more links, go to DecisionPoint.com