
I only had one person send in requests this week. They were all "Diamonds in the Rough" as far as I'm concerned. If I had one beef it would be that a lot of these rallies have been motion for some time, but I do think there is more upside to be had.
The President seems to think we should be buyers right now. The rally does look credible so I do think we will see more upside for the moment. I don't know that I will be piling in, but it is likely time to dip my toes back in. I'll see how my indicators shape up later this afternoon.
Good Luck & Good Trading,
Erin
Today's "Diamonds in the Rough": AXP, EPR and ISRG.
Other requests: EXPE, OKTA and UTI.
* * * * * * * * * * * * * *
Carl has decided to retire, and Erin will be joining him in retirement. We will continue publication until June 27th, and we will be contacting you soon via email as to how this will affect your subscriptions.
* * * * * * * * * * * * * *

Diamond Mine Trading Room:
RECORDING & DOWNLOAD LINK (5/2/2025):
Topic: DecisionPoint Diamond Mine (5/2/2025) LIVE Trading Room
Download & Recording Link
Passcode: May##2nd
REGISTRATION for 5/9/2025:
When: May 9, 2025 09:00 AM Pacific Time (US and Canada)
Topic: DecisionPoint Diamond Mine LIVE Trading Room
Register in advance for this webinar HERE
After registering, you will receive a confirmation email containing information about joining the webinar.
Welcome to DecisionPoint Diamonds, wherein I highlight ten "Diamonds in the Rough" per week. These are selected from the results of my DecisionPoint Scans which search for stocks that could benefit from the trend and condition of the market. Remember, these are not recommendations to buy or sell, but are the most interesting of the stocks that surfaced in my scans. My objective is to save you the work of the initial, tedious culling process, but you need to apply your own analysis to see if these stocks pique your interest as well. There are no guaranteed winners here!
"Predefined Scans Triggered" are taken from StockCharts.com using the "Symbol Summary" option instead of a "SharpChart" on the workbench.
Stop levels are all rounded down.
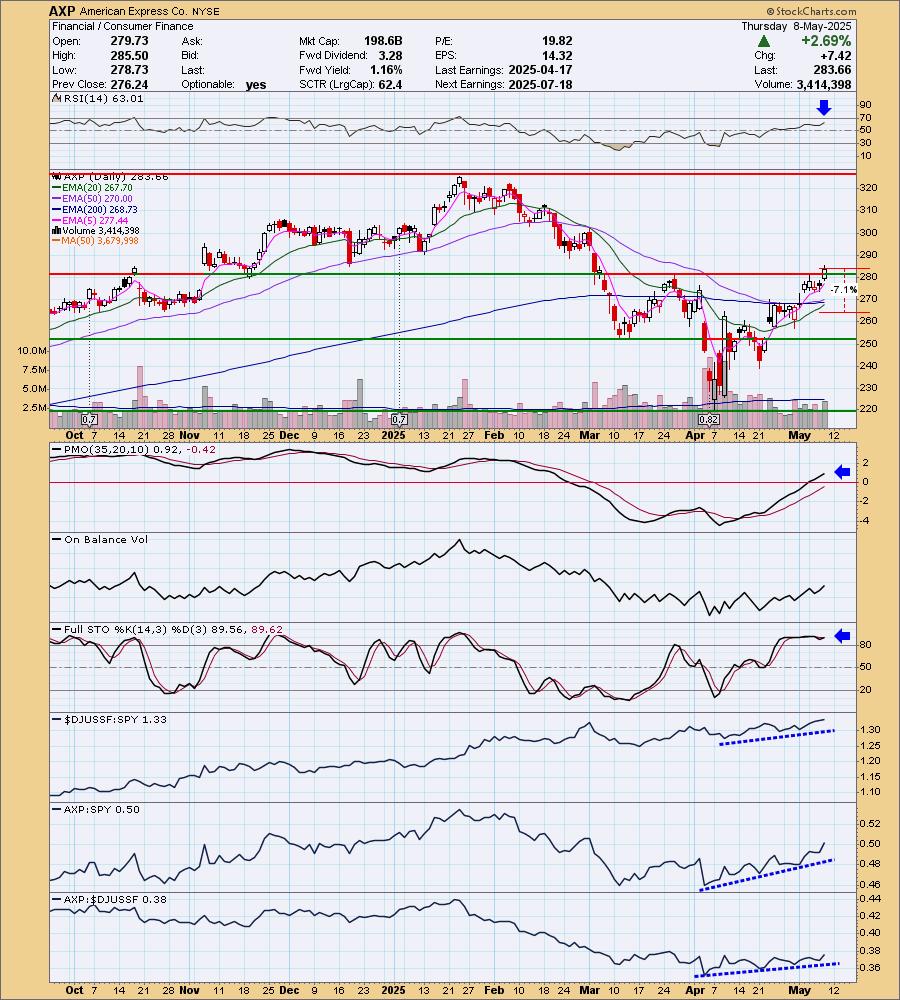
American Express Co. (AXP)
EARNINGS: 2025-07-18 (BMO)
American Express Co. engages in the provision of card-issuing, merchant-acquiring, and card network businesses. Its products and services include credit cards, business credit cards, corporate programs, gift cards, savings accounts and CDs, and the American Express App. It operates through the following segments: the United States Consumer Services (USCS), Commercial Services (CS), International Card Services (ICS), Global Merchant and Network Services (GMNS), and Corporate and Other. The USCS segment includes proprietary consumer cards and provides services to United States consumers. The CS segment offers corporate and small business cards and provides services to United States businesses. The ICS segment provides consumers, small businesses, and corporate cards outside the United States. The GMNS segment is involved in operating a global payments network that processes and settles card transactions, acquires merchants, and provides multi-channel marketing programs and capabilities, services and data analytics. The Corporate and Other segment covers corporate functions and certain other businesses and operations. It also operates through the following geographical segments: United States, EMEA, APAC, LACC, and Other. The EMEA segment represents Europe, the Middle East, and Africa. The APAC segment refers to Asia Pacific, Australia, and New Zealand. The LACC segment focuses on Latin America, Canada, and the Caribbean. The Other segment includes net costs which are not directly allocated to specific geographic regions. The company was founded by Henry Wells, William G. Fargo, and John Warren Butterfield on March 28, 1850 and is headquartered in New York, NY.
Predefined Scans Triggered: Elder Bar Turned Green, Moved Above Upper Price Channel and P&F Double Top Breakout.
AXP is up +0.20% in after hours trading. This was my favorite chart. I like the breakout today out of this bottoming formation. The RSI is positive and not overbought in spite of the lengthy rally. The PMO is rising above the zero line on a Crossover BUY Signal. Stochastics are holding above 80. Relative strength studies are excellent with all three relative strength lines rising. I set the stop below the key moving averages at 7.1% or $263.52.
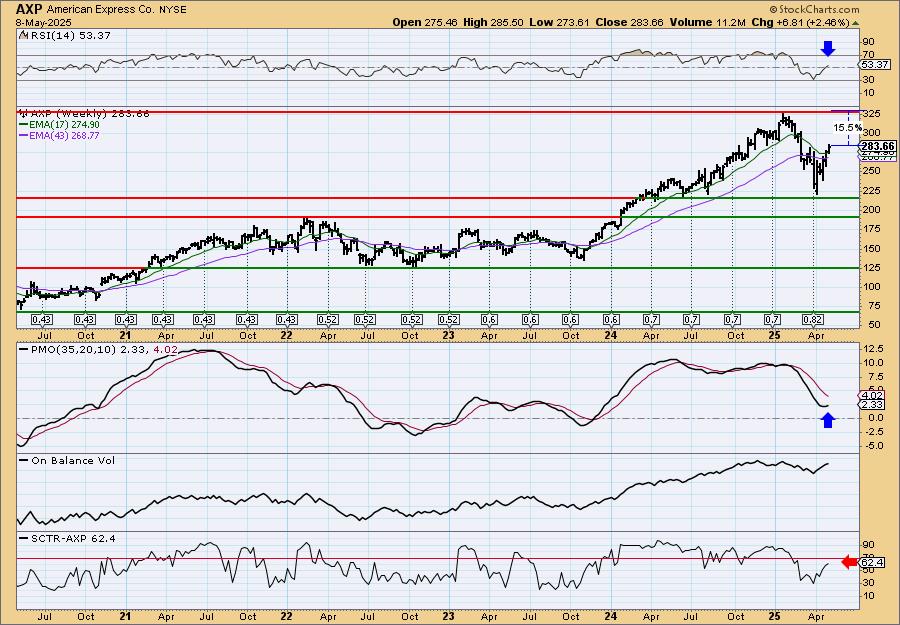
I like the weekly chart as we see price bouncing before it hit the strongest line of support at the 2022 high. The weekly RSI just hit positive territory and the weekly PMO has turned back up. The StockCharts Technical Rank (SCTR) isn't in the hot zone* yet, but it is very close so I'm not so concerned. Consider a 17% upside target to about $331.88.
*If a stock is in the "hot zone" above 70, it implies that it is stronger than 70% of its universe (large-, mid-, small-caps and ETFs) primarily in the intermediate to long terms.
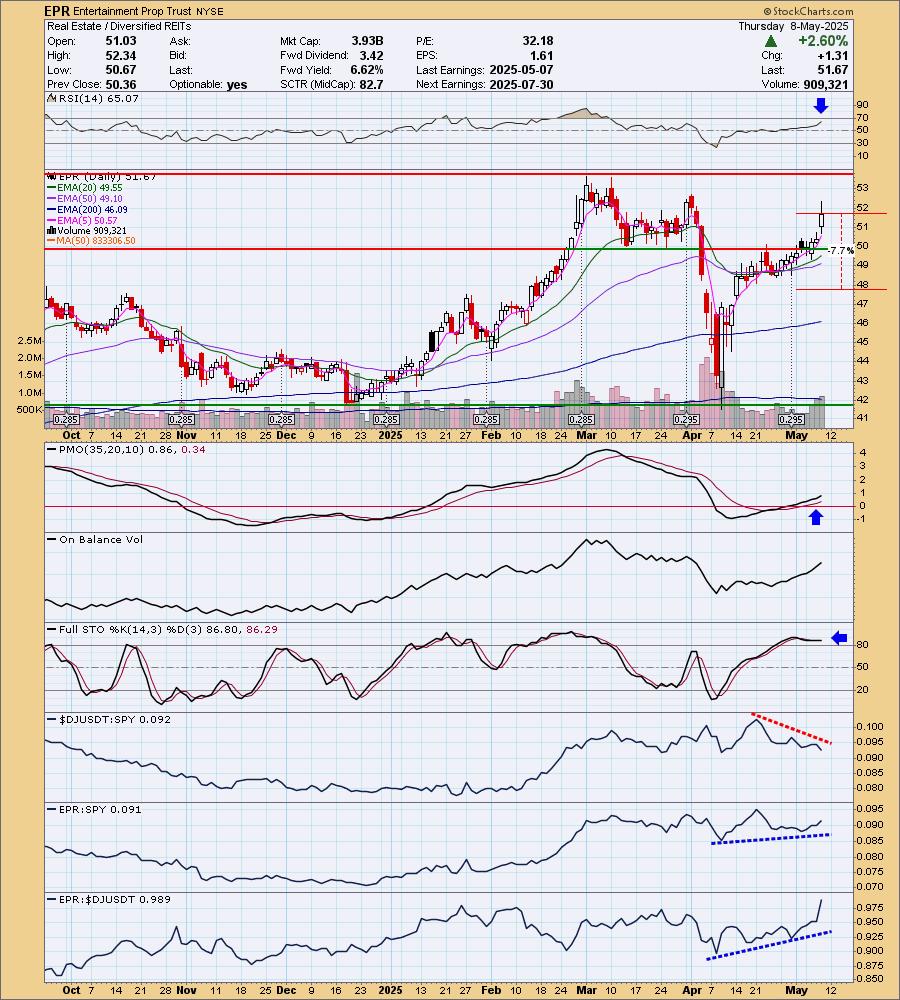
Entertainment Prop Trust (EPR)
EARNINGS: 2025-07-30 (AMC)
EPR Properties operates as a real estate investment trust. The firm engages in the development, finance and leasing of theaters, entertainment retail and family entertainment centers. It operates through the following segments: Experiential and Education. The Experiential segment includes investments in megaplex theaters, entertainment retail centers, family entertainment centers and other retail parcels. The Education segment consists of investments in public charter schools. The company was founded by Peter C. Brown on August 22, 1997 and is headquartered in Kansas City, MO.
Predefined Scans Triggered: Moved Above Upper Bollinger Band, Stock in a New Uptrend (Aroon), Moved Above Ichimoku Cloud, Elder Bar Turned Green and Moved Above Upper Price Channel.
EPR is up +1.49% in after hours trading. It reported yesterday evening and earnings were definitely well received given today's rally. It appears it will continue given after hours trading is up so far. Price has broken out and is on an excellent rally. Given this rally it is good to see that the RSI is not overbought right now. It can accommodate even more upside. The PMO is rising above the zero line on a Crossover BUY Signal. The OBV is confirming the rally. Stochastics are hovering above 80. Relative strength for the group is a problem, but EPR is doing just fine against the SPY as it is outperforming the industry group right now. The stop is set beneath the prior congestion zone at 7.7% or $47.69. It pays a good dividend.
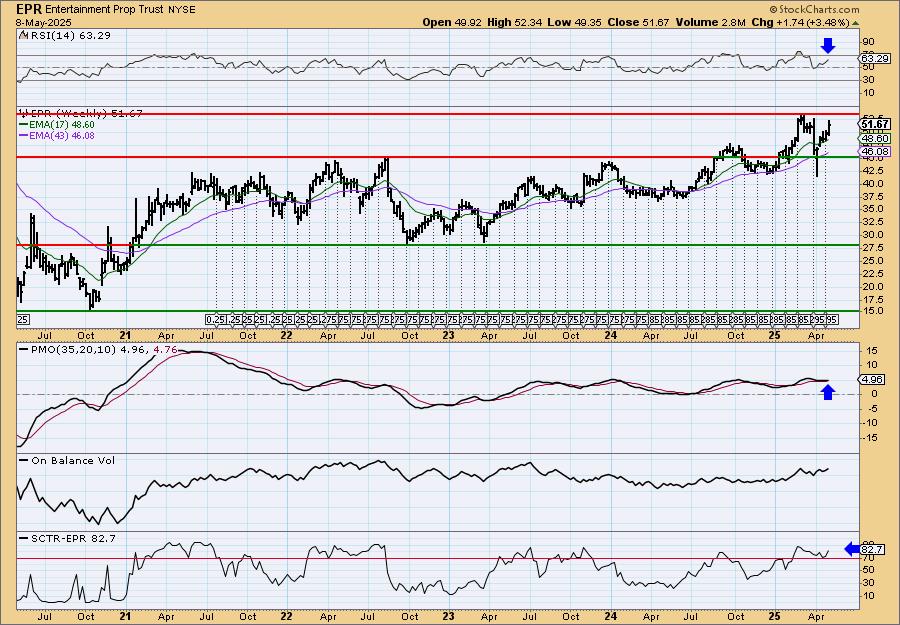
The weekly chart shows a steady rising trend with a prior breakout from a trading range. The weekly RSI is rising and is not overbought. The weekly PMO is flat but on a Crossover BUY Signal. The SCTR is in the hot zone. Consider a 17% upside target to about $60.45.
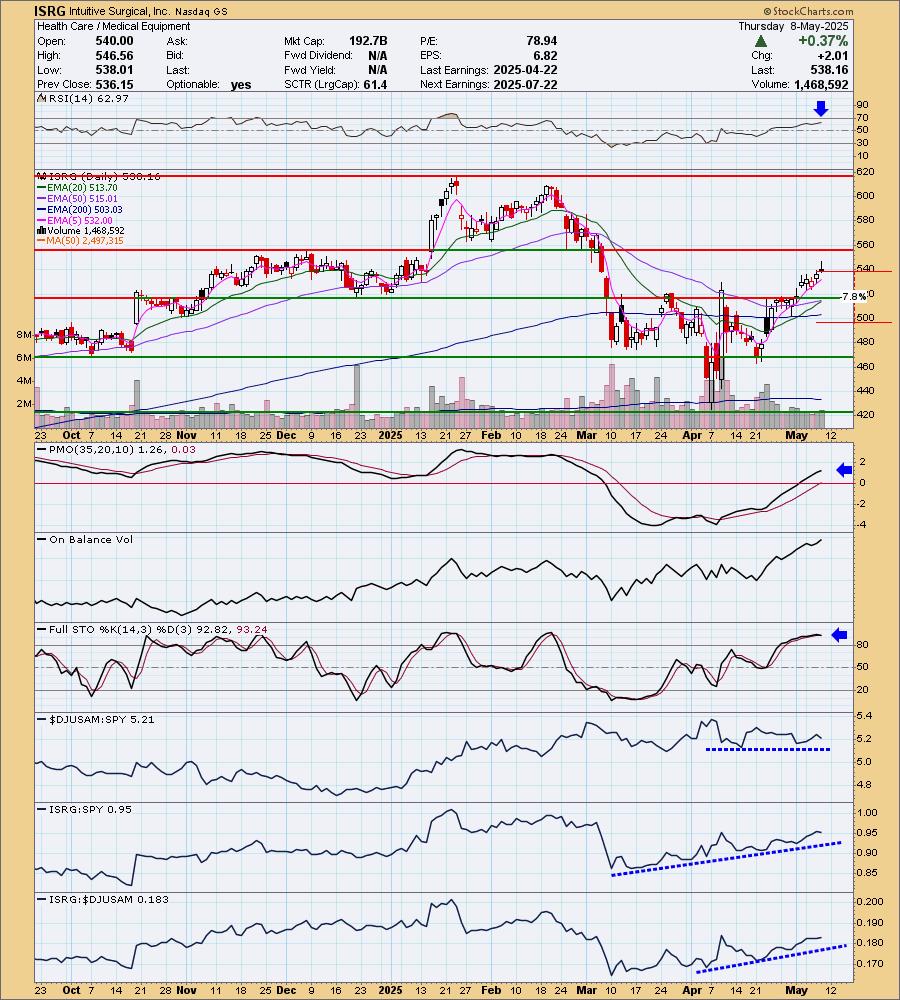
Intuitive Surgical, Inc. (ISRG)
EARNINGS: 2025-07-22 (AMC)
Intuitive Surgical, Inc. engages in the provision of robotic-assisted surgical solutions and invasive care through a comprehensive ecosystem of products and services. Its products include Da Vinci Surgical and Ion Endoluminal systems. The company was founded by Frederic H. Moll, John Gordon Freund, and Robert G. Younge in November 1995 and is headquartered in Sunnyvale, CA.
Predefined Scans Triggered: Filled Black Candles and P&F Double Top Breakout.
ISRG is up +0.34% in after hours trading. Here is another breakout from a bottoming formation. Notice that we almost have a Silver Cross of the 20/50-day EMAs. The RSI is positive and not overbought despite the lengthy rally. The PMO looks very bullish as it rises above the zero line on a Crossover BUY Signal. Stochastics are holding above 80. The group is performing in line with the SPY which is acceptable as the SPY is in a rising trend. It is outperforming both the group and the SPY currently. The OBV also looks very bullish as it rises with price. The stop is set beneath the 200-day EMA at 7.8% or $496.18.
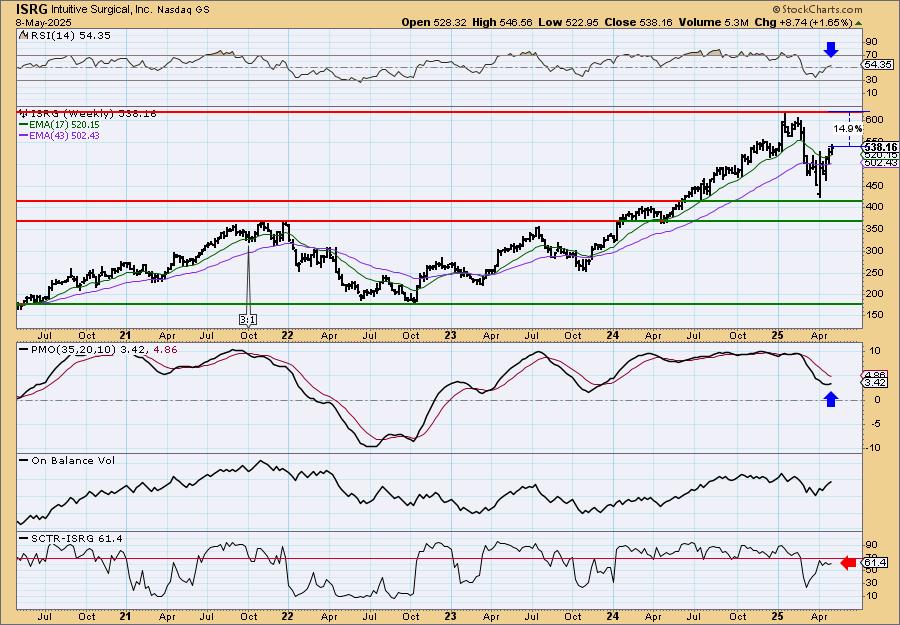
The weekly chart shows a strong breakout from a trading range that was followed by a correction. Price is now headed back up toward all-time highs. The weekly RSI is positive and not overbought. The weekly PMO has turned up. The SCTR is not inside the hot zone, but it is very close. Consider a 17% upside target to about $629.65.
Don't forget, on Thursdays I look at reader-requested symbols, click HERE to send me an email. I read every email I receive and try to answer them all!
Current Market Outlook:
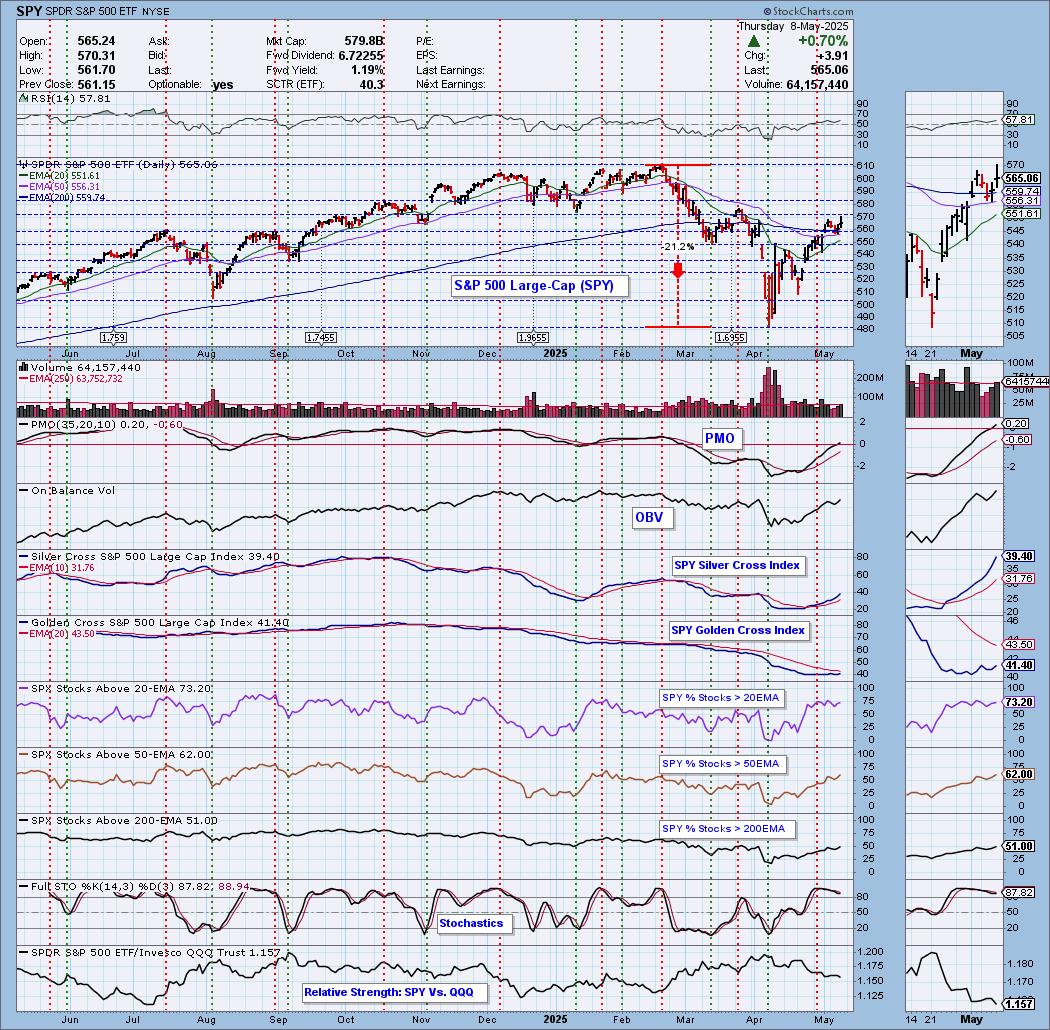
Market Environment: It is important to consider the odds for success by assessing the market tides. The following chart uses different methodologies for objectively showing the depth and trend of participation for intermediate- and long-term time frames.
- The Silver Cross Index (SCI) shows the percentage of SPX stocks on IT Trend Model BUY signals (20-EMA > 50-EMA)
- The Golden Cross Index (GCI) shows the percentage of SPX stocks on LT Trend Model BUY signals (50-EMA > 200-EMA)
Don't forget that as a "Diamonds" member, you have access to our "Under the Hood" curated ChartList on DecisionPoint.com. You'll find it under "Members Only" links on the left side on the Blogs and Links Page.
Here is the current chart:
Full Disclosure: I am 10% long, 0% short.
I'm required to disclose if I currently own a stock I mention and/or may buy/short it within the next 72 hours.
"Technical Analysis is a windsock, not a crystal ball." - Carl Swenlin
(c) Copyright 2025 DecisionPoint.com
Watch the latest episode of DecisionPoint Trading Room with Carl Swenlin & Erin Swenlin Mondays on the DecisionPoint YouTube channel here!
NOTE: The stocks reported herein are from mechanical trading model scans that are based upon moving average relationships, momentum and volume. DecisionPoint analysis is then applied to get five selections from the scans. The selections given should prompt readers to do a chart review using their own analysis process. This letter is not a call for a specific action to buy, sell or short any of the stocks provided. There are NO sure things or guaranteed returns on the daily selection of "Diamonds in the Rough."
Regarding BUY/SELL Signals: The signal status reported herein is based upon mechanical trading model signals and crossovers. They define the implied bias of the price index/stock based upon moving average relationships and momentum, but they do not necessarily call for a specific action. They are information flags that should prompt chart review. Further, they do not call for continuous buying or selling during the life of the signal. For example, a BUY signal will probably (but not necessarily) return the best results if action is taken soon after the signal is generated. Additional opportunities for buying may be found as price zigzags higher, but the trader must look for optimum entry points. Conversely, exit points to preserve gains (or minimize losses) may be evident before the model mechanically closes the signal.
Helpful DecisionPoint Links:
Price Momentum Oscillator (PMO)
Swenlin Trading Oscillators (STO-B and STO-V)
For more links, go to DecisionPoint.com