
The market looked pretty good yesterday, but I wasn't thrilled with today's action. I was hoping to see some followthrough given I had added exposure. We did get a gain, but price didn't really go anywhere. This is why I'm still thinking this could be a bear market rally that won't have staying power.
This is why it is critical to set stops on your positions. If this rally does fail, we need some safety.
I've opted to go with longs today, but as I said above, I'm not thoroughly convinced the worst is over. One of today's picks is from Consumer Staples, a defensive position that should hold up. I also have an Industrial, a Financial and a Healthcare stock. Figured we would cover all the bases. I didn't see too many from our Sector to Watch Utilities. XLU isn't going anywhere, but if the market does turn, you may want to look at runner-up CEG.
Good Luck & Good Trading,
Erin
Today's "Diamonds in the Rough": PCRX, SFM, UAL and WRLD
Runner-ups: MP, LRN, SKY, FTNT, MCO, META, CEG and DFS.

Diamond Mine Trading Room:
RECORDING & DOWNLOAD LINK (3/21/2025):
Topic: DecisionPoint Diamond Mine (3/21/2025) LIVE Trading Room
Download & Recording Link
Passcode: March#21
REGISTRATION for 3/28/2025:
When: March 28, 2025 09:00 AM Pacific Time (US and Canada)
Topic: DecisionPoint Diamond Mine LIVE Trading Room
Register in advance for this webinar HERE
After registering, you will receive a confirmation email containing information about joining the webinar.

Below is the latest free DecisionPoint Trading Room recording from 3/24. You'll find these recordings posted on Mondays to our DP YouTube Channel. Be sure and subscribe HERE.
Welcome to DecisionPoint Diamonds, wherein I highlight ten "Diamonds in the Rough" per week. These are selected from the results of my DecisionPoint Scans which search for stocks that could benefit from the trend and condition of the market. Remember, these are not recommendations to buy or sell, but are the most interesting of the stocks that surfaced in my scans. My objective is to save you the work of the initial, tedious culling process, but you need to apply your own analysis to see if these stocks pique your interest as well. There are no guaranteed winners here!
"Predefined Scans Triggered" are taken from StockCharts.com using the "Symbol Summary" option instead of a "SharpChart" on the workbench.
Stop levels are all rounded down.
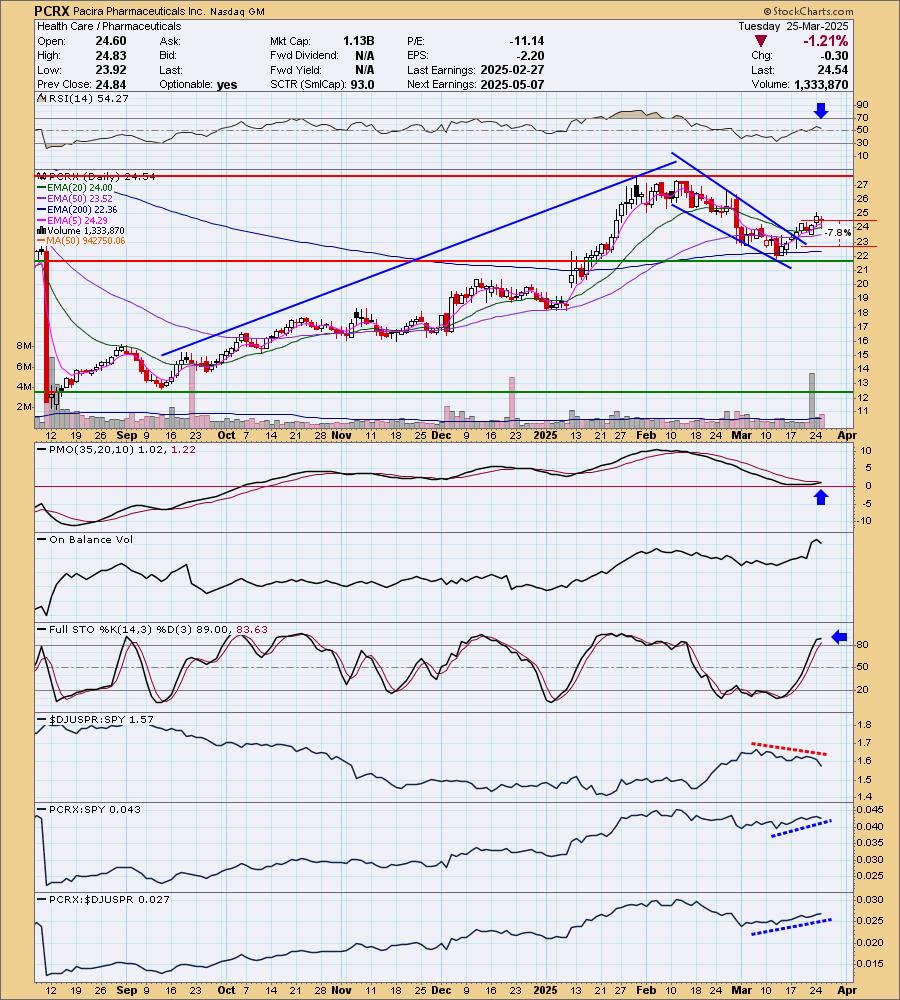
Pacira Pharmaceuticals Inc. (PCRX)
EARNINGS: 2025-05-07 (AMC)
Pacira Biosciences, Inc. is a holding company, which engages in the provision of non-opioid pain management and regenerative health solutions to improve patients' journeys along the neural pain pathway. Its products include EXPAREL, iovera, and DepoFoam. The company was founded in December 2006 and is headquartered in Tampa, FL.
Predefined Scans Triggered: Entered Ichimoku Cloud.
PCRX is unchanged in after hours trading. I see a large bull flag that has been confirmed with this recent breakout. The RSI is not at all overbought as it just entered positive territory. The PMO is rising above the zero line toward a Crossover BUY Signal. Stochastics are above 80 and rising. The industry group isn't doing very well, but I still selected PCRX because it is by itself outperforming both the SPY and the group. The stop is set as close to the 200-day EMA as I could get it without going over my 8% threshold on stops. I set it at 7.8% or $22.62.
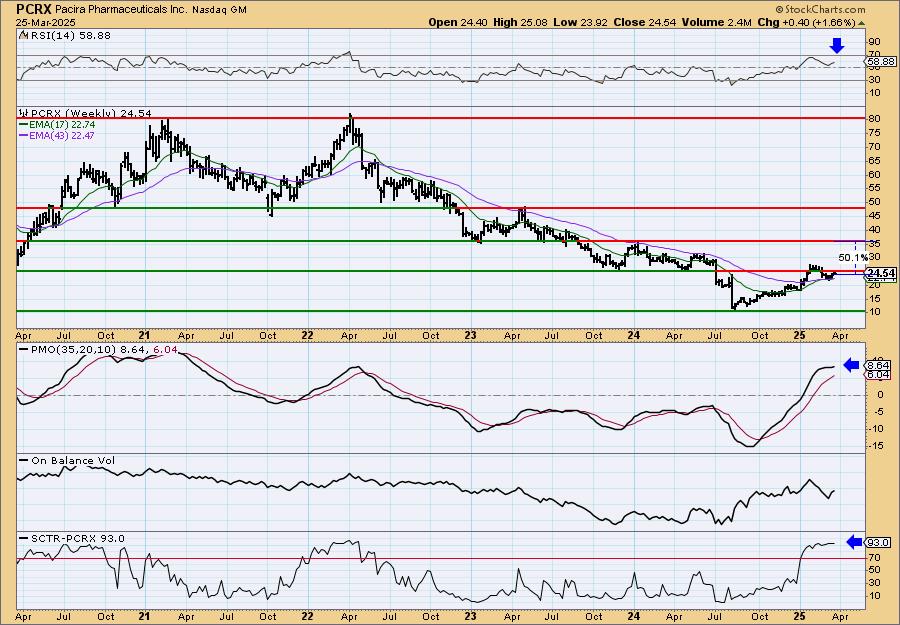
You can see the bull flag on the weekly chart. Price has technically not overcome resistance, but it is very close. The weekly RSI is positive and the weekly PMO is rising well above the zero line and the signal line. The StockCharts Technical Rank (SCTR) is excellent holding near the top of the hot zone*. I'm not sure we'll get a 50% gain here, but upside potential is quite good.
*If a stock is in the "hot zone" above 70, it implies that it is stronger than 70% of its universe (large-, mid-, small-caps and ETFs) primarily in the intermediate to long terms.
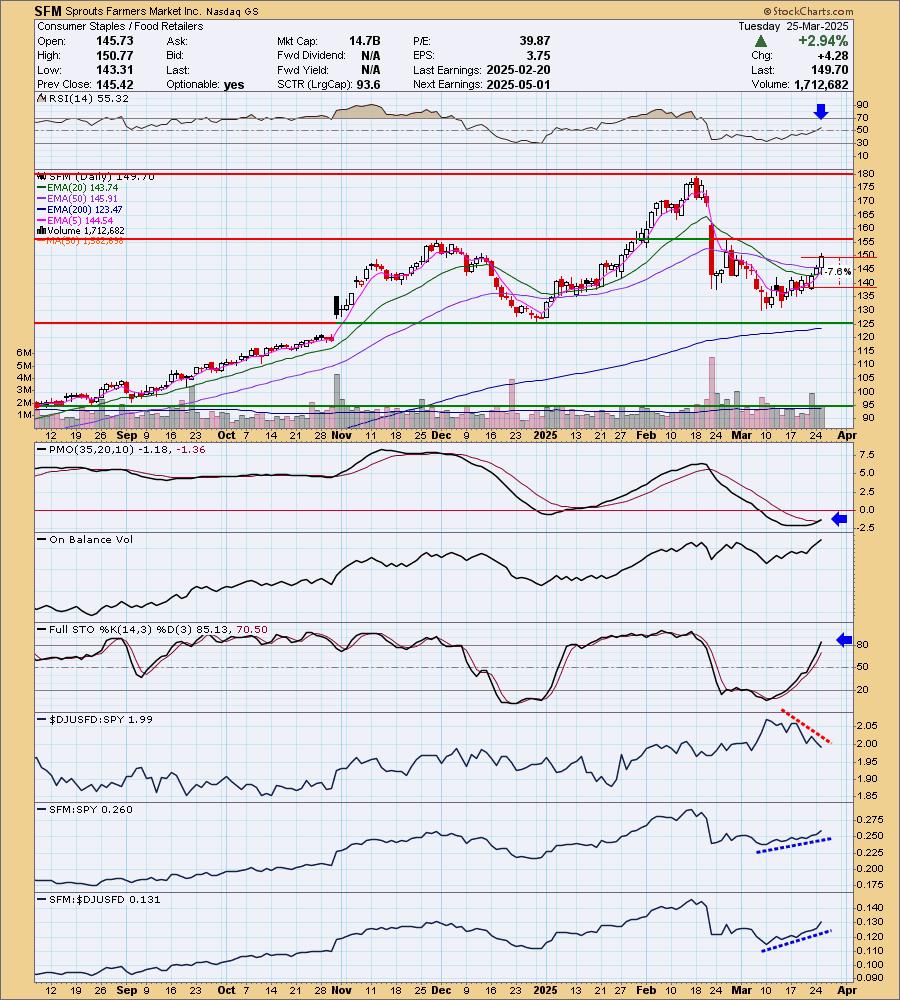
Sprouts Farmers Market Inc. (SFM)
EARNINGS: 2025-05-01 (AMC)
Sprouts Farmers Market, Inc. engages in the operation of healthy grocery stores. The firm specializes in fresh, natural and organic products. Its products include fresh produce, bulk foods, vitamins and supplements, grocery, meat and seafood, deli, bakery, dairy, frozen foods, body care and natural household items. The company was founded by Stan Boney, Shon Alexander Boney, and Kevin K. Easler on July 11, 2002 and is headquartered in Phoenix, AZ.
Predefined Scans Triggered: P&F Double Top Breakout and P&F Triple Top Breakout.
SFM is down -0.01% in after hours trading. This defensive stock is set up quite well. Notice that price did not have to go down to support before turning back up. The RSI is now positive. The PMO just triggered a Crossover BUY Signal. Stochastics have now risen above 80. As with PCRX, the industry group isn't doing that well, but I do like the outperformance of SFM against the group and the SPY. The stop is set close to the February low at 7.8% or $138.32.
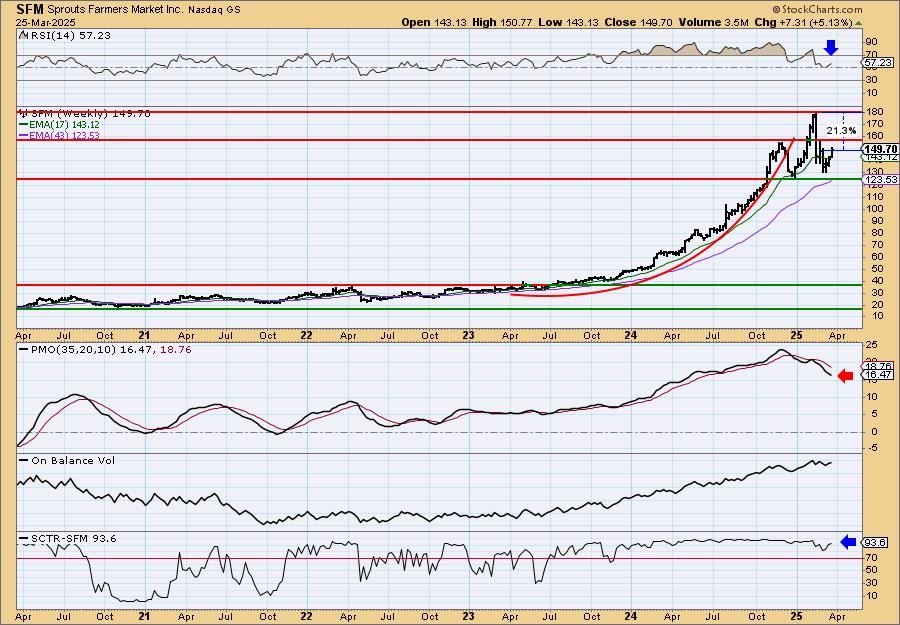
We can see a parabolic breakdown followed by a vertical rally that also failed. It appears to me that price is ready to challenge the all-time high as it makes its way above resistance soon. The weekly RSI is positive despite the big drop it experienced. The weekly PMO is trying to catch up as it is still in decline from the previous drop. The set up is nice given we do have a stock that has lived in the hot zone above 70 for well over a year.
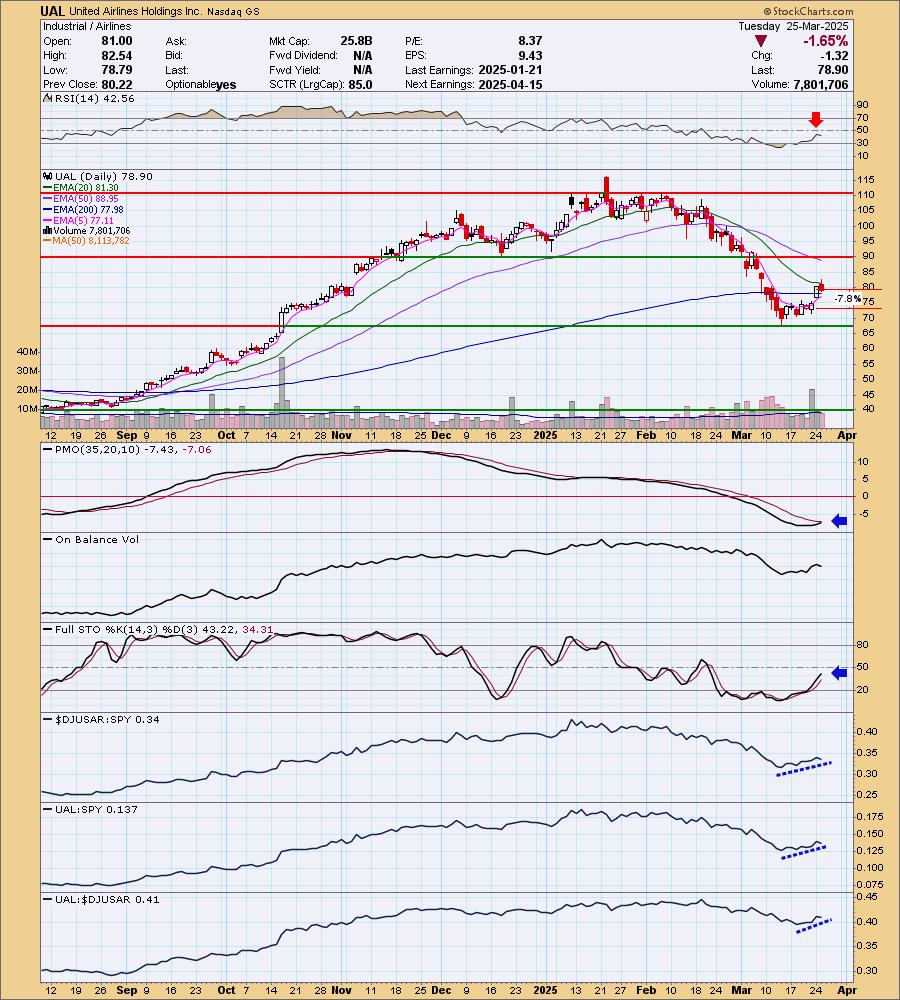
United Airlines Holdings Inc. (UAL)
EARNINGS: 2025-04-15 (AMC)
United Airlines Holdings, Inc. is a holding company, which engages in the provision of transportation services. It operates through the following geographical segments: Domestic, Atlantic, Pacific, and Latin America. The company was founded on December 30, 1968 and is headquartered in Chicago, IL.
Predefined Scans Triggered: P&F Ascending Triple Top Breakout and P&F Double Top Breakout.
UAL is up +0.25% in after hours trading. I liked the small rally above the 200-day EMA. I like the airline group right now as you can see it is beginning to outperform the market. The RSI is not yet in positive territory, but it is headed that direction. The PMO is nearing a Crossover BUY Signal. This is a reversal candidate simply because the PMO is deeply negative right now. I think it is worth a try on new group strength. Stochastics are rising, but haven't reached positive territory yet. This is an early pick. UAL is outperforming the group and the SPY. I've set the stop as close to support as I could at 7.8% or $72.74.
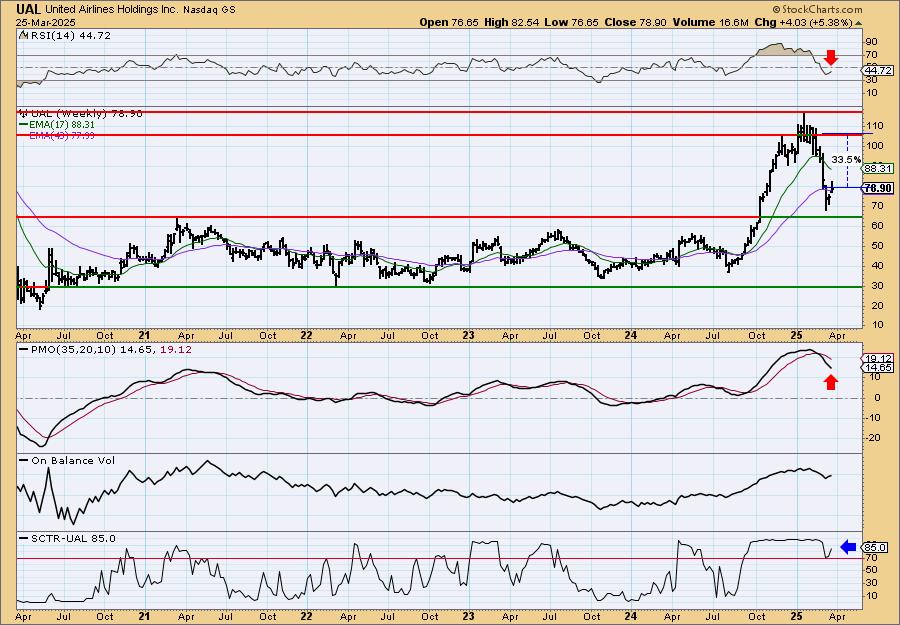
It was hit very hard on its last decline which looks overdone to me. Price is bouncing off the top of a years long trading range. It reversed before having to touch that support level which is bullish. The weekly RSI is negative and the weekly PMO is falling which is indicative of the prior deep decline. The SCTR however, is very strong above 70.
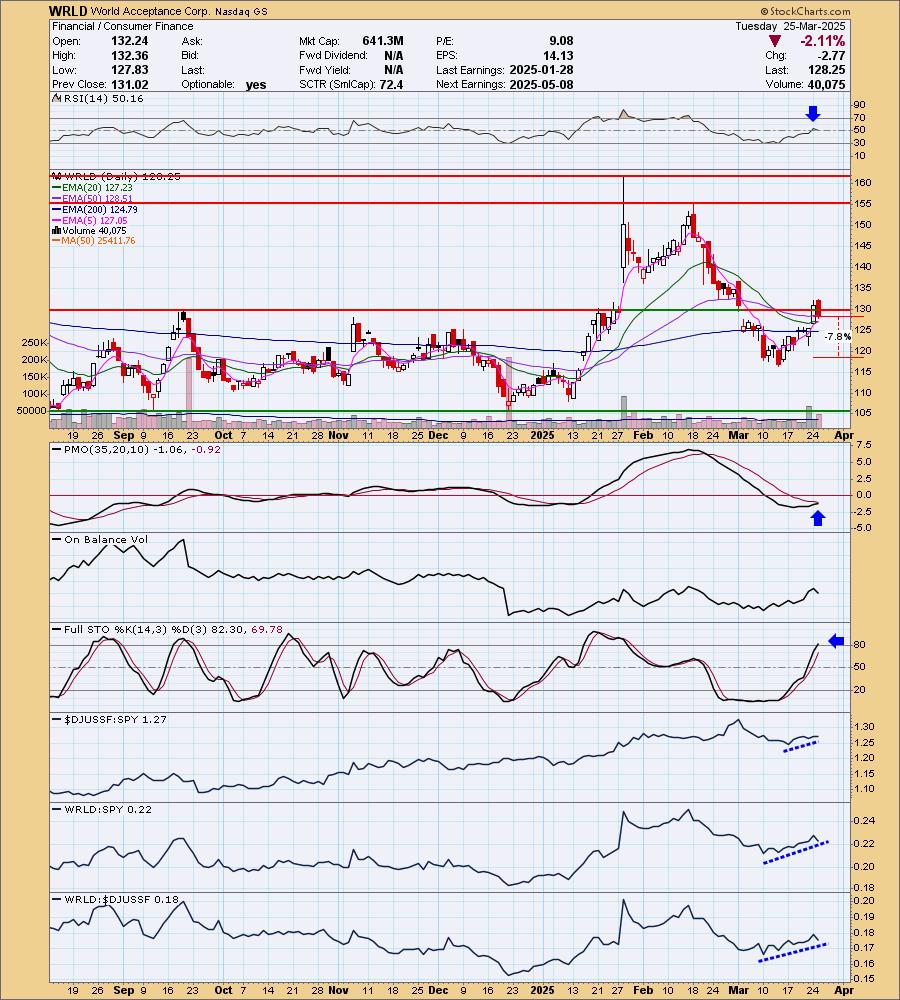
World Acceptance Corp. (WRLD)
EARNINGS: 2025-05-08 (BMO)
World Acceptance Corp. engages in the small-loan consumer finance business. It offers short-term small instalment, medium-term larger loans, related credit insurance, ancillary products and services to individuals. The firm also offers income tax return preparation services to customers. The company also markets computer software and related services to financial services companies through its subsidiary, ParaData Financial Systems. It operates in the following segments: Small Loans, Large Loans, and Tax Advance Loans. World Acceptance was founded in 1962 and is headquartered in Greenville, SC.
Predefined Scans Triggered: None.
WRLD is unchanged in after hours trading. Price was able to reverse before testing support at the December low. The previous gap from the beginning of the month has been filled and that generally means you'll continue to see followthrough. The RSI is positive and not at all overbought. The PMO is nearing a Crossover BUY Signal in near-term oversold territory. Stochastics are now rising above 80. Relative strength lines are all rising so we have outperformance by the group and WRLD. The stop is set as close to support as possible at 7.8% or $118.24.
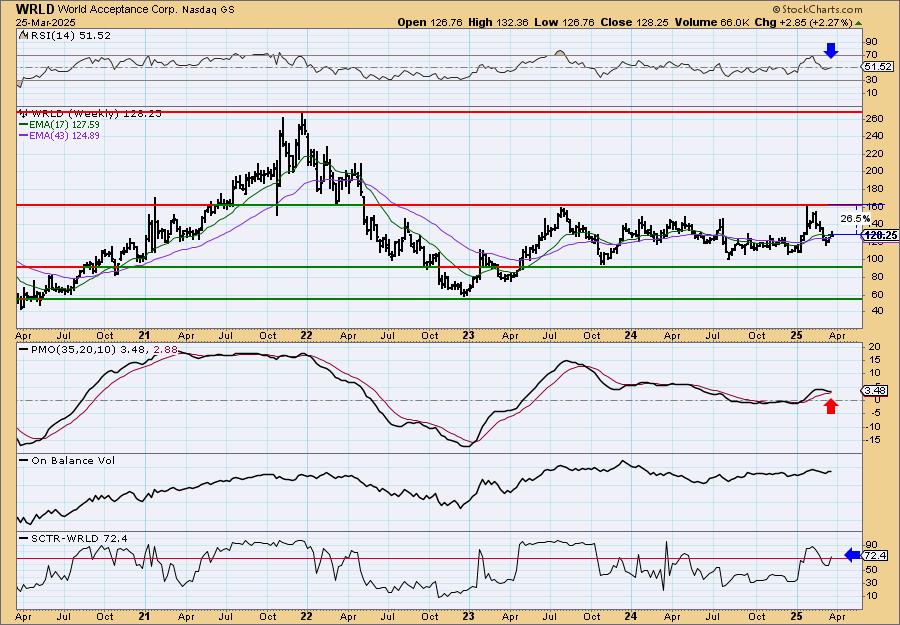
I'm not usually excited about trading range stocks, but this one looks to be headed back to the top of the range after reversing before having to test the bottom of the range. There is plenty of upside potential using this trading range. The weekly RSI is now in positive territory. The weekly PMO needs some help as it does look ready to give us a Crossover SELL Signal. The SCTR just moved into the hot zone above 70.
Don't forget, on Thursdays I look at reader-requested symbols, click HERE to send me an email. I read every email I receive and try to answer them all!
Current Market Outlook:
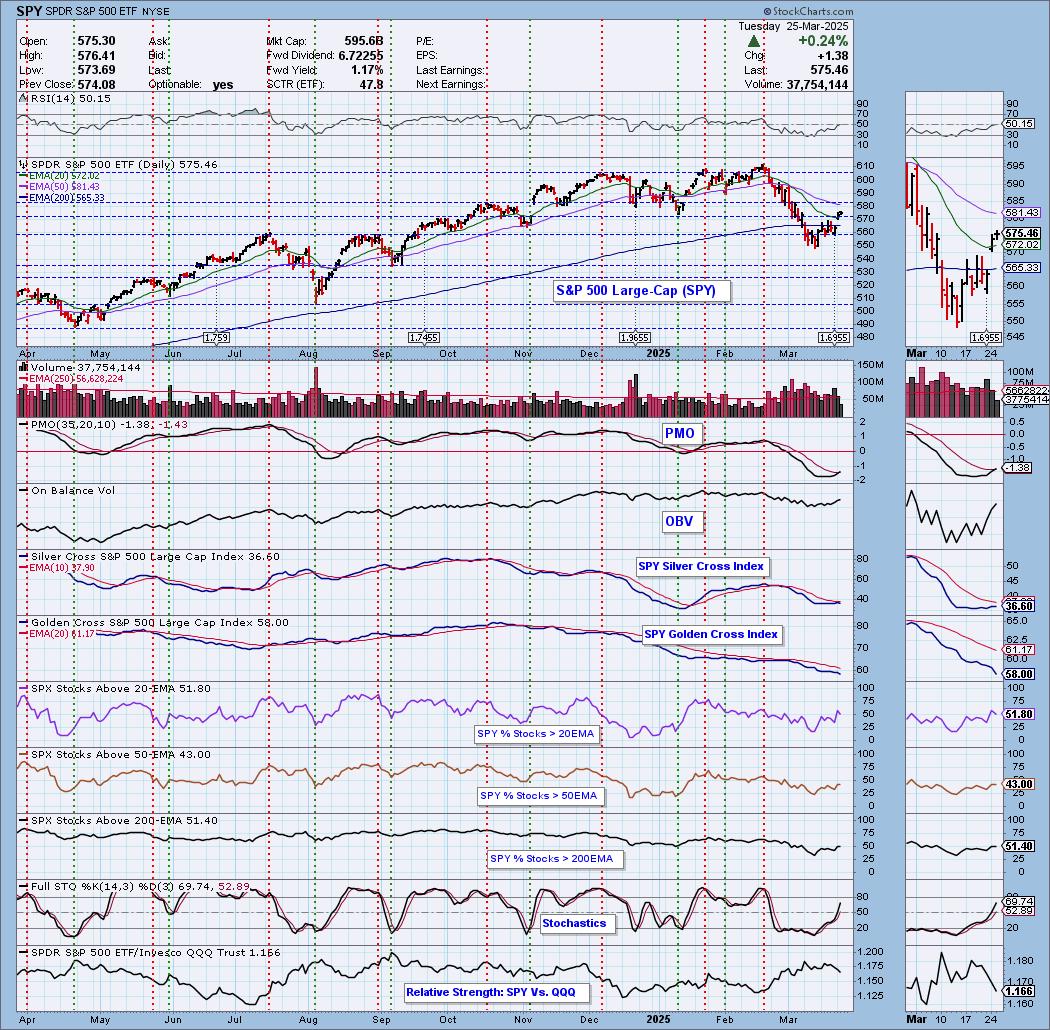
Market Environment: It is important to consider the odds for success by assessing the market tides. The following chart uses different methodologies for objectively showing the depth and trend of participation for intermediate- and long-term time frames.
- The Silver Cross Index (SCI) shows the percentage of SPX stocks on IT Trend Model BUY signals (20-EMA > 50-EMA)
- The Golden Cross Index (GCI) shows the percentage of SPX stocks on LT Trend Model BUY signals (50-EMA > 200-EMA)
Don't forget that as a "Diamonds" member, you have access to our "Under the Hood" curated ChartList on DecisionPoint.com. You'll find it under "Members Only" links on the left side on the Blogs and Links Page.
Here is the current chart:
Full Disclosure: I am 40% long, 0% short.
I'm required to disclose if I currently own a stock I mention and/or may buy/short it within the next 72 hours.
"Technical Analysis is a windsock, not a crystal ball." - Carl Swenlin
(c) Copyright 2025 DecisionPoint.com
Watch the latest episode of DecisionPoint Trading Room with Carl Swenlin & Erin Swenlin Mondays on the DecisionPoint YouTube channel here!
NOTE: The stocks reported herein are from mechanical trading model scans that are based upon moving average relationships, momentum and volume. DecisionPoint analysis is then applied to get five selections from the scans. The selections given should prompt readers to do a chart review using their own analysis process. This letter is not a call for a specific action to buy, sell or short any of the stocks provided. There are NO sure things or guaranteed returns on the daily selection of "Diamonds in the Rough."
Regarding BUY/SELL Signals: The signal status reported herein is based upon mechanical trading model signals and crossovers. They define the implied bias of the price index/stock based upon moving average relationships and momentum, but they do not necessarily call for a specific action. They are information flags that should prompt chart review. Further, they do not call for continuous buying or selling during the life of the signal. For example, a BUY signal will probably (but not necessarily) return the best results if action is taken soon after the signal is generated. Additional opportunities for buying may be found as price zigzags higher, but the trader must look for optimum entry points. Conversely, exit points to preserve gains (or minimize losses) may be evident before the model mechanically closes the signal.
Helpful DecisionPoint Links:
Price Momentum Oscillator (PMO)
Swenlin Trading Oscillators (STO-B and STO-V)
For more links, go to DecisionPoint.com