
It looks like I should've made all positions yesterday defensive. I do not like what the market is giving us right now. It looks more and more like a bear market rally that is beginning to fail.
This made picking ETFs tough today. I was thoroughly unimpressed with the scan results. A common theme was dividend or value ETFs. While they are apt to do better than growth, I don't see much upside available there. I instead found three industry group ETFs that seem to be bucking the trend right now. I found these using my eyeballs, not my scans. I reviewed the charts in our ETF Tracker (available on the website, but I'm happy to send you the ChartList if you have a StockCharts Extra account or higher). It covers most industry groups and indexes as well as the sectors.
Keep those stops, consider lightening your portfolio and be careful out there. We have some more downside to absorb, but I opted not to provide any hedges today. It's certainly time to consider them. TZA, TECS, SOXS and SDOW are a few of my go-tos.
You'll note that my exposure dropped a great deal. While stops didn't hit, I decided I didn't want to be exposed in case the market continues lower. No point in taking those losses if I don't have to.
Good Luck & Good Trading,
Erin
Today's "Diamonds in the Rough": IHF, KIE and KRE.
Runner-ups: TZA, TECS, SOXS, SDOW and EDZ. (JETS looks interesting as well)

Diamond Mine Trading Room:
RECORDING & DOWNLOAD LINK (3/21/2025):
Topic: DecisionPoint Diamond Mine (3/21/2025) LIVE Trading Room
Download & Recording Link
Passcode: March#21
REGISTRATION for 3/28/2025:
When: March 28, 2025 09:00 AM Pacific Time (US and Canada)
Topic: DecisionPoint Diamond Mine LIVE Trading Room
Register in advance for this webinar HERE
After registering, you will receive a confirmation email containing information about joining the webinar.

Below is the latest free DecisionPoint Trading Room recording from 3/24. You'll find these recordings posted on Mondays to our DP YouTube Channel. Be sure and subscribe HERE.
Welcome to DecisionPoint Diamonds, wherein I highlight ten "Diamonds in the Rough" per week. These are selected from the results of my DecisionPoint Scans which search for stocks that could benefit from the trend and condition of the market. Remember, these are not recommendations to buy or sell, but are the most interesting of the stocks that surfaced in my scans. My objective is to save you the work of the initial, tedious culling process, but you need to apply your own analysis to see if these stocks pique your interest as well. There are no guaranteed winners here!
"Predefined Scans Triggered" are taken from StockCharts.com using the "Symbol Summary" option instead of a "SharpChart" on the workbench.
Stop levels are all rounded down.
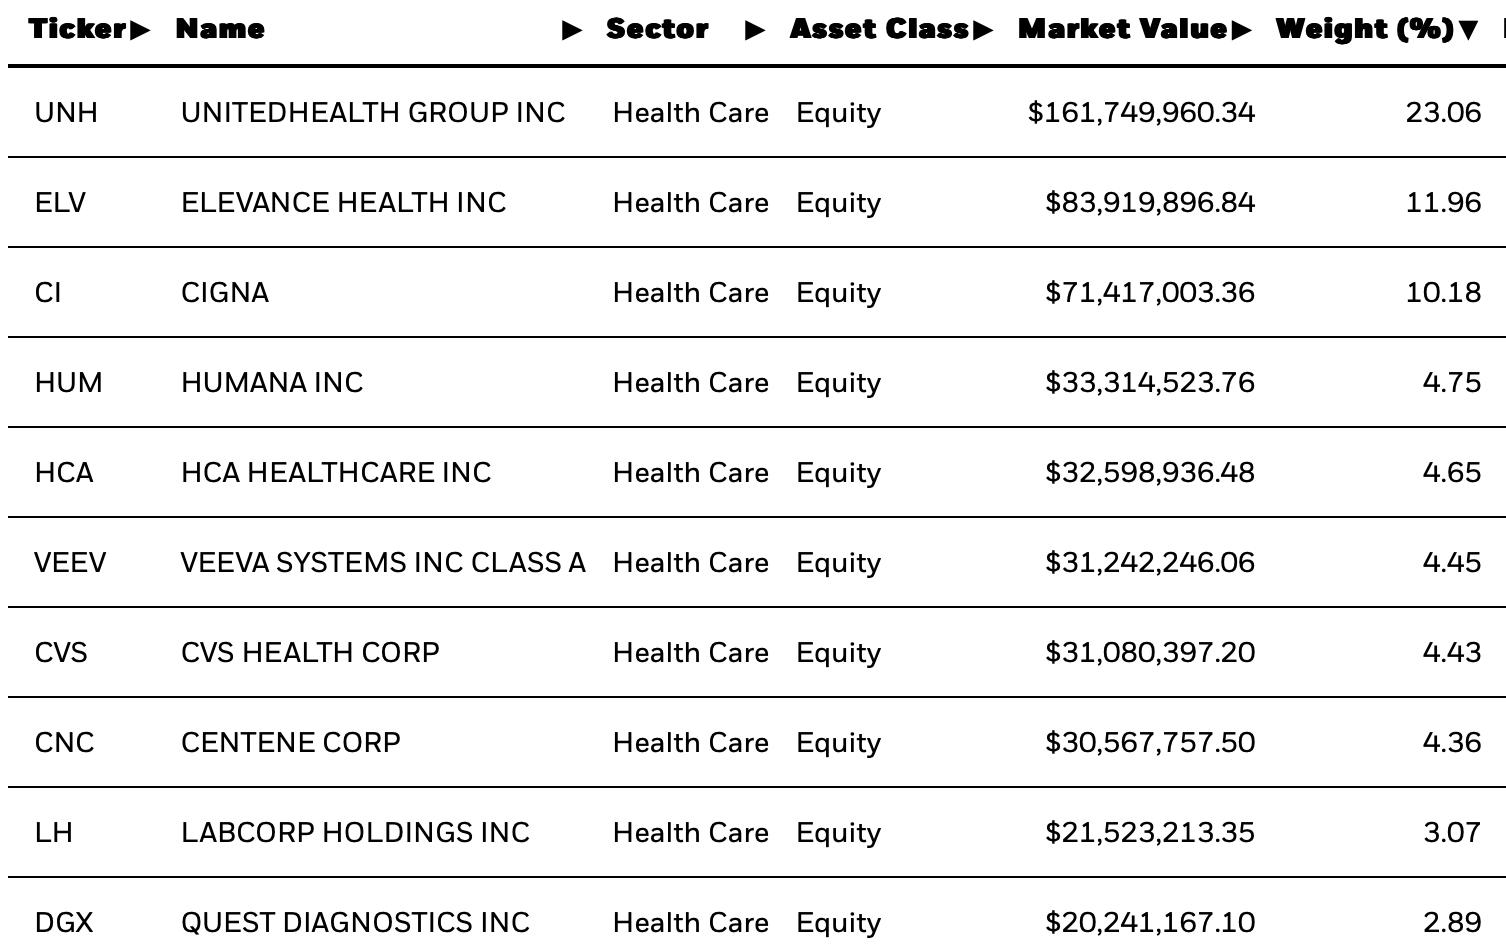
iShares U.S. Healthcare Providers ETF (IHF)
EARNINGS: N/A
IHF tracks a cap-weighted index of US companies that provide healthcare services. Click HERE for more information.
Predefined Scans Triggered: None.
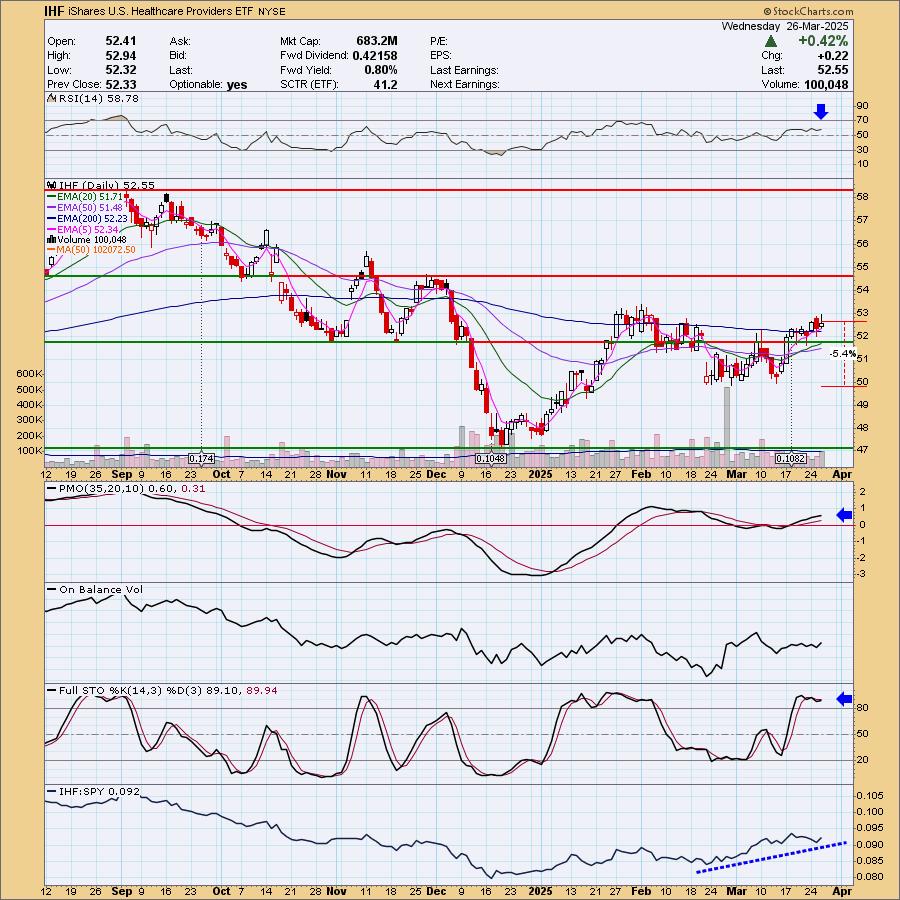
IHF is down -1.69% in after hours trading so it could be pulling back to the prior breakout point first. You never know with after hours trading. This looks like a good bottoming formation, possibly a complex reverse head and shoulders. Price rallied above the 200-day EMA and we have a recent Silver Cross of the 20/50-day EMAs. The RSI is healthy and not overbought. The PMO is rising above the zero line. Stochastics are oscillating above 80 indicating internal strength. We can also see that it has been outperforming the SPY. I also like this ETF because it is in defensive Healthcare sector. The stop doesn't have to be deep. I set it beneath support at 5.4% or $49.71.
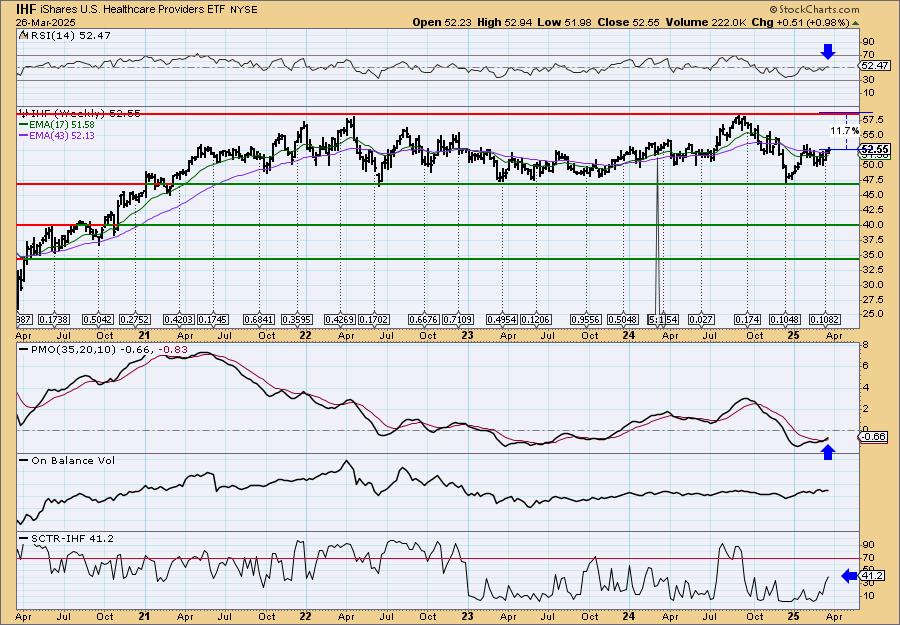
We are playing the trading range here, but it isn't out of the question that it could breakout there. Since our stop is thin, our upside target can be lower. I like my target to be twice the stop percentage and we've got that. The chart looks very good in the intermediate term. The weekly RSI is positive and the weekly PMO just gave us a Crossover BUY Signal. The StockCharts Technical Rank (SCTR) is not in the hot zone* but it is headed there quickly.
*If a stock is in the "hot zone" above 70, it implies that it is stronger than 70% of its universe (large-, mid-, small-caps and ETFs) primarily in the intermediate to long terms.
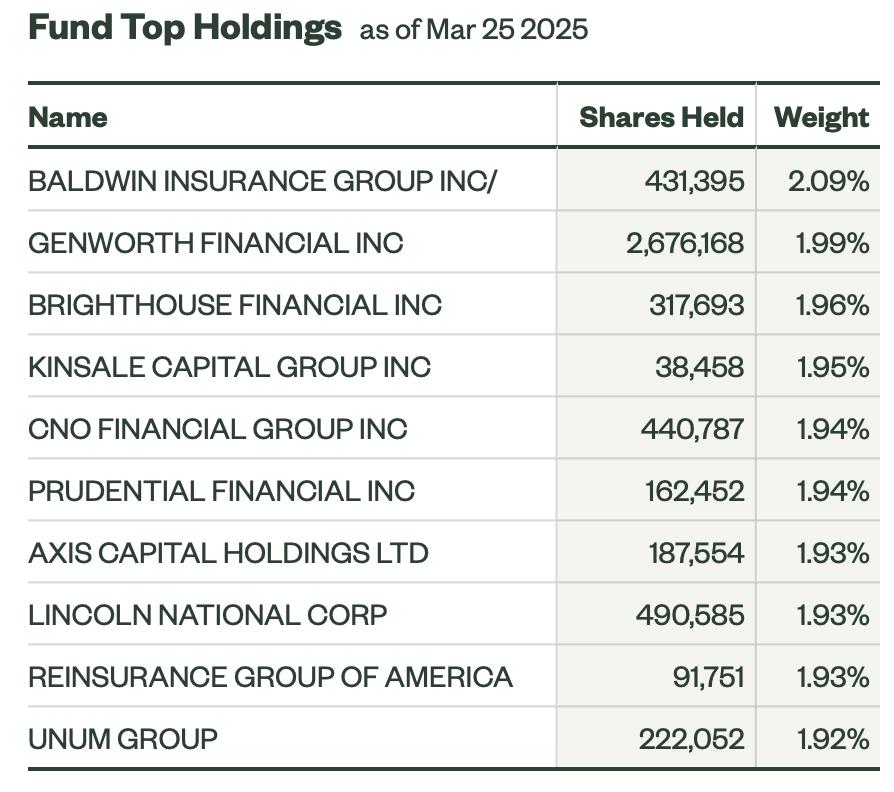
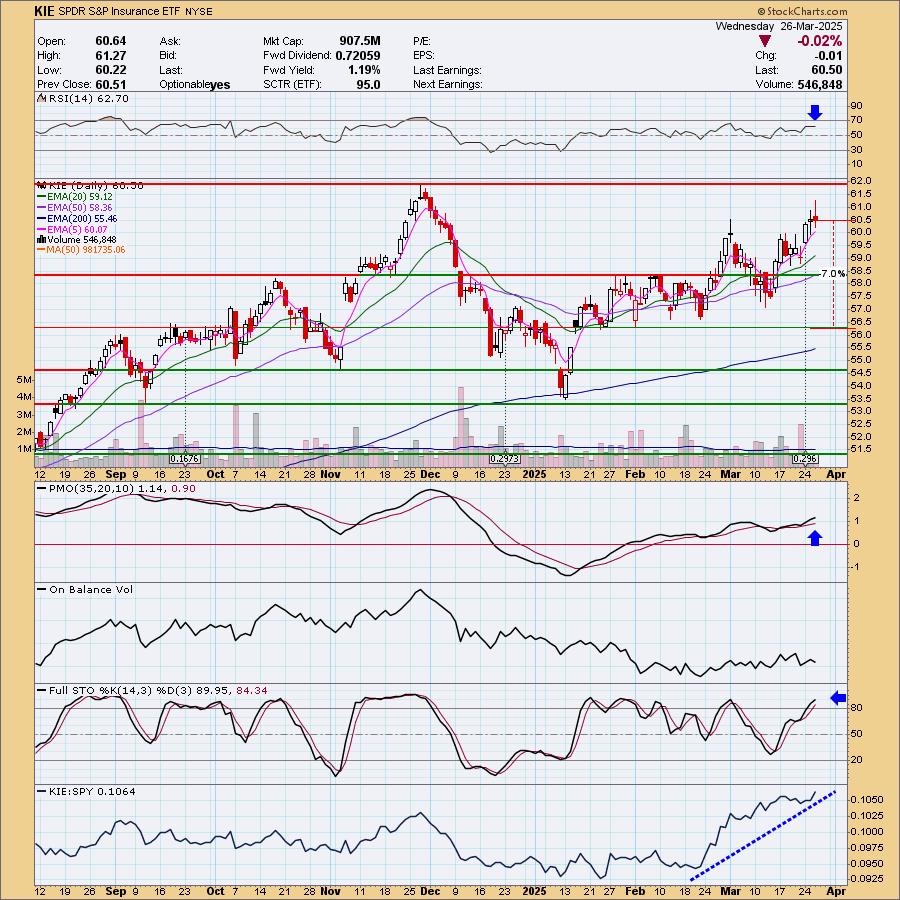
SPDR S&P Insurance ETF (KIE)
EARNINGS: N/A
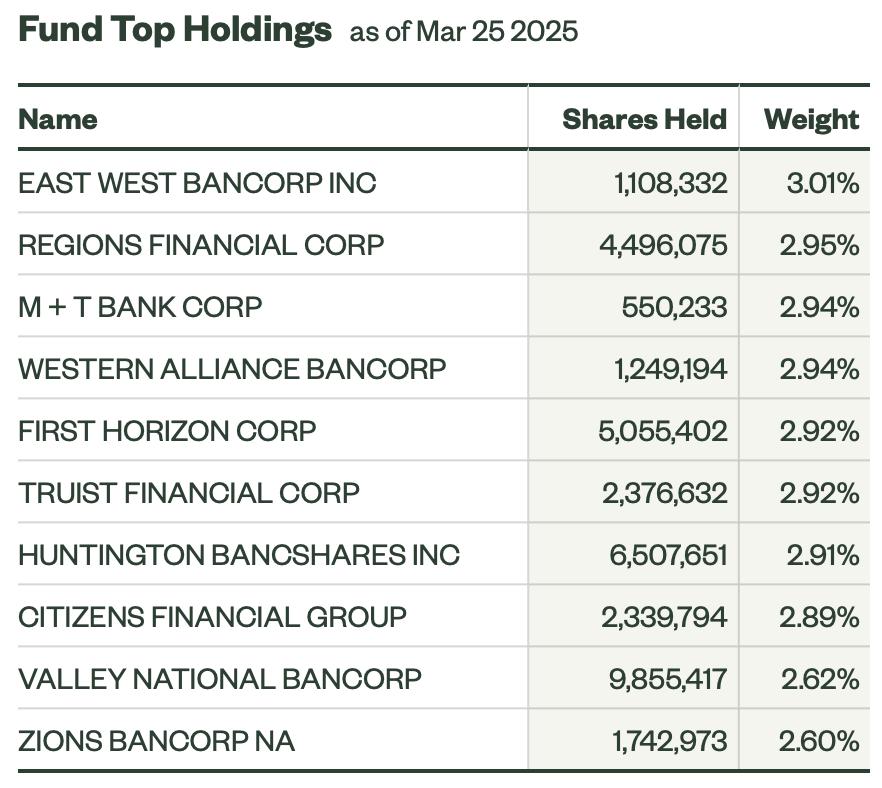
KIE tracks an equal-weighted-index of insurance companies, as defined by GICS. Click HERE for more information.
Predefined Scans Triggered: None.
KIE is up +1.29% in after hours trading. This is probably the best chart as we have an established rising trend despite what's going on in the market. It is getting close to overhead resistance, but this rising trend looks pretty good. The RSI is positive and not overbought. The PMO is rising and putting margin between it and its signal line. It is also showing a Crossover BUY Signal above the zero line. Stochastics are above 80 and relative strength is still on the rise. I set the stop beneath support at 7% or $56.26.
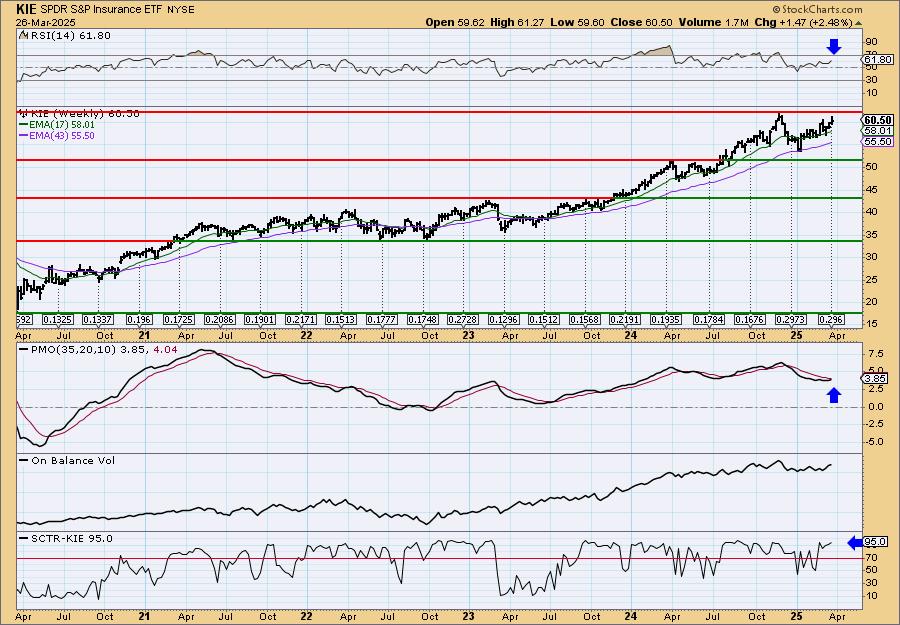
There is a strong rising trend on the weekly chart that does imply that we'll get a breakout. The weekly RSI is positive and not overbought despite the rally. The weekly PMO is nearing a Crossover BUY Signal and the SCTR is at the top of the hot zone. Consider a 17% upside target to about $70.79.
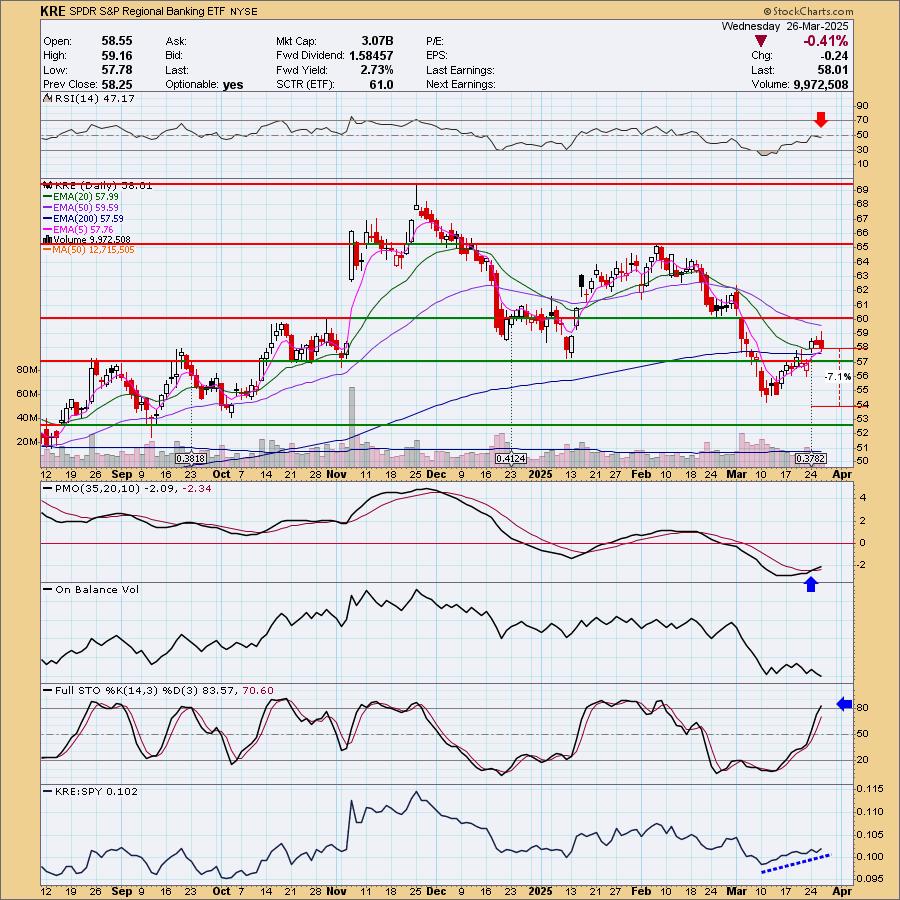
SPDR S&P Regional Banking ETF (KRE)
EARNINGS: N/A
KRE tracks an equal-weighted index of US regional banking stocks. Click HERE for more information.
Predefined Scans Triggered: Ichimoku Cloud Turned Green.
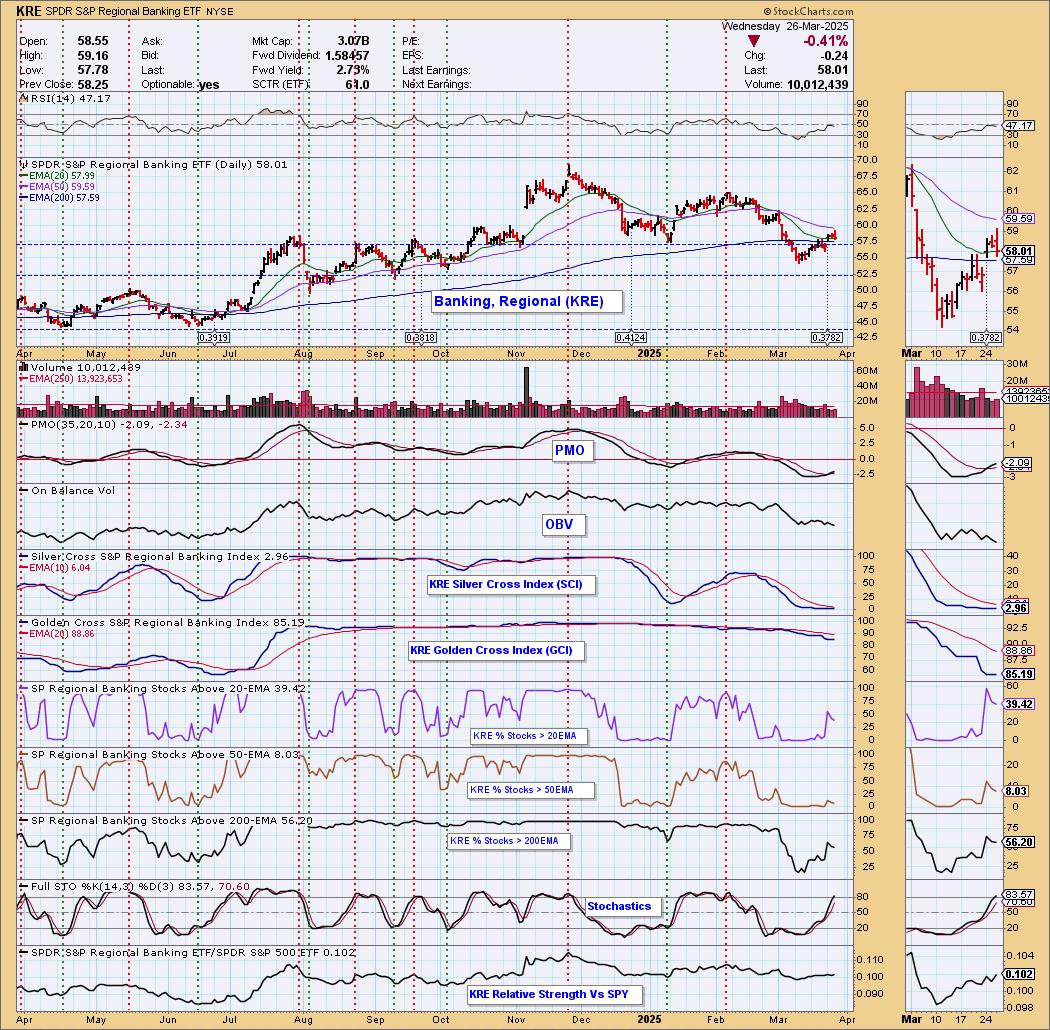
KRE is up +0.10% in after hours trading. I liked the reversal that took place before support was reached. We also have a rally above the 200-day EMA. The RSI is not positive, but it is very close. The PMO is on a new Crossover BUY Signal. I'm not thrilled with the shape of the On Balance Volume (OBV). Stochastics look very good as they have just cleared 80. Relative strength looks good as it rises. There are a few troublesome areas on the chart so be sure and set the stop or tighten it.
Let's look under the hood since we can. We had a nice move up on participation of stocks above their 20-day EMA. The Silver Cross Index is unfortunately in the basement right now. I like the rising trend on stocks above their 200-day EMA. This isn't that strong, but it does suggest to me that we could see some more upside. Participation needs to pick up though.
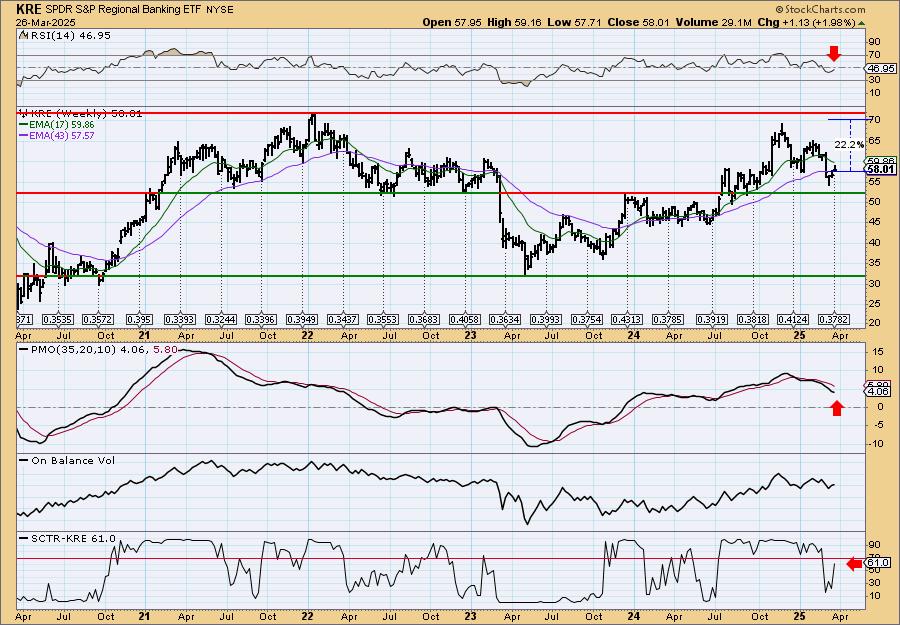
It still looks a little toppy on the weekly chart, but you can see this is a strong area of support that it is rallying off. The indicators aren't great due to the recent decline, but at least the weekly RSI and SCTR are improving. The weekly PMO may be decelerating, but it is hard to see/determine. We still have a rising trend on the weekly chart out of the 2023 low. I would look for the prior high to eventually be reached.
Don't forget, on Thursdays I look at reader-requested symbols, click HERE to send me an email. I read every email I receive and try to answer them all!
Current Market Outlook:
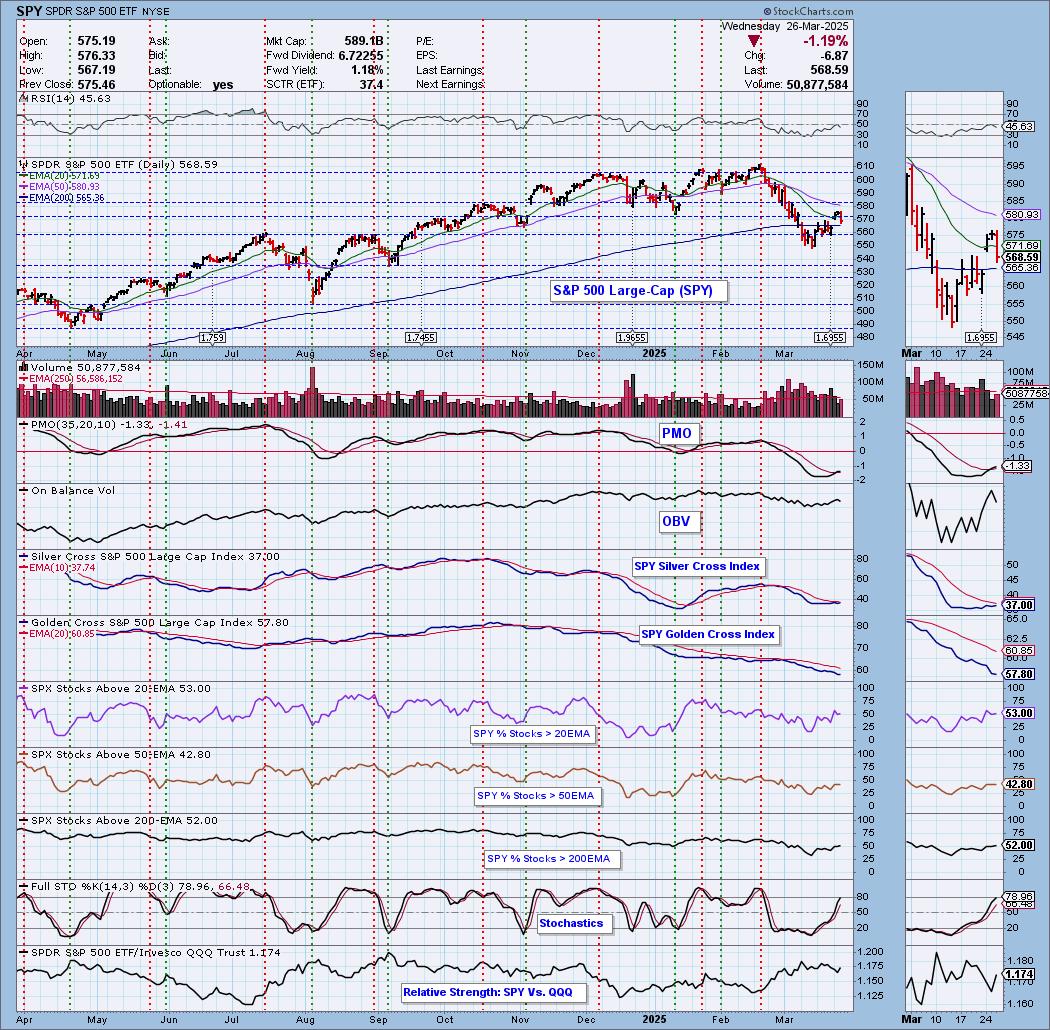
Market Environment: It is important to consider the odds for success by assessing the market tides. The following chart uses different methodologies for objectively showing the depth and trend of participation for intermediate- and long-term time frames.
- The Silver Cross Index (SCI) shows the percentage of SPX stocks on IT Trend Model BUY signals (20-EMA > 50-EMA)
- The Golden Cross Index (GCI) shows the percentage of SPX stocks on LT Trend Model BUY signals (50-EMA > 200-EMA)
Don't forget that as a "Diamonds" member, you have access to our "Under the Hood" curated ChartList on DecisionPoint.com. You'll find it under "Members Only" links on the left side on the Blogs and Links Page.
Here is the current chart:
Full Disclosure: I am 15% long, 0% short.
I'm required to disclose if I currently own a stock I mention and/or may buy/short it within the next 72 hours.
"Technical Analysis is a windsock, not a crystal ball." - Carl Swenlin
(c) Copyright 2025 DecisionPoint.com
Watch the latest episode of DecisionPoint Trading Room with Carl Swenlin & Erin Swenlin Mondays on the DecisionPoint YouTube channel here!
NOTE: The stocks reported herein are from mechanical trading model scans that are based upon moving average relationships, momentum and volume. DecisionPoint analysis is then applied to get five selections from the scans. The selections given should prompt readers to do a chart review using their own analysis process. This letter is not a call for a specific action to buy, sell or short any of the stocks provided. There are NO sure things or guaranteed returns on the daily selection of "Diamonds in the Rough."
Regarding BUY/SELL Signals: The signal status reported herein is based upon mechanical trading model signals and crossovers. They define the implied bias of the price index/stock based upon moving average relationships and momentum, but they do not necessarily call for a specific action. They are information flags that should prompt chart review. Further, they do not call for continuous buying or selling during the life of the signal. For example, a BUY signal will probably (but not necessarily) return the best results if action is taken soon after the signal is generated. Additional opportunities for buying may be found as price zigzags higher, but the trader must look for optimum entry points. Conversely, exit points to preserve gains (or minimize losses) may be evident before the model mechanically closes the signal.
Helpful DecisionPoint Links:
Price Momentum Oscillator (PMO)
Swenlin Trading Oscillators (STO-B and STO-V)
For more links, go to DecisionPoint.com