
I'm going to keep Reader Request Day around, but it has begun to dry up with one subscriber consistently sending in symbols while everyone else remains quiet. Feel free to send in any symbols during the week for review on Thursday. It's a great opportunity to get a read on a portfolio position or any prospective candidates you're considering.
I did a cursory look at my scans. I found a Healthcare Provider which falls in line with yesterday's ETF pick for that industry group. It came through on my Surge Scan. The Reader Request I picked is an Insurance stock and that also falls under the Insurance ETF I picked yesterday. The other is short. Semiconductors look terrible right now so I expect this Semiconductor stock to languish.
Tomorrow is the Diamond Mine Trading Room. We'd love to have you join us, but remember you can always download or view online the recording.
Good Luck & Good Trading,
Erin
Today's "Diamonds in the Rough": AMAT (Short), CI and ROL.
Other Requests: PHYS, ORI.

Diamond Mine Trading Room:
RECORDING & DOWNLOAD LINK (3/21/2025):
Topic: DecisionPoint Diamond Mine (3/21/2025) LIVE Trading Room
Download & Recording Link
Passcode: March#21
REGISTRATION for 3/28/2025:
When: March 28, 2025 09:00 AM Pacific Time (US and Canada)
Topic: DecisionPoint Diamond Mine LIVE Trading Room
Register in advance for this webinar HERE
After registering, you will receive a confirmation email containing information about joining the webinar.

Below is the latest free DecisionPoint Trading Room recording from 3/24. You'll find these recordings posted on Mondays to our DP YouTube Channel. Be sure and subscribe HERE.
Welcome to DecisionPoint Diamonds, wherein I highlight ten "Diamonds in the Rough" per week. These are selected from the results of my DecisionPoint Scans which search for stocks that could benefit from the trend and condition of the market. Remember, these are not recommendations to buy or sell, but are the most interesting of the stocks that surfaced in my scans. My objective is to save you the work of the initial, tedious culling process, but you need to apply your own analysis to see if these stocks pique your interest as well. There are no guaranteed winners here!
"Predefined Scans Triggered" are taken from StockCharts.com using the "Symbol Summary" option instead of a "SharpChart" on the workbench.
Stop levels are all rounded down.
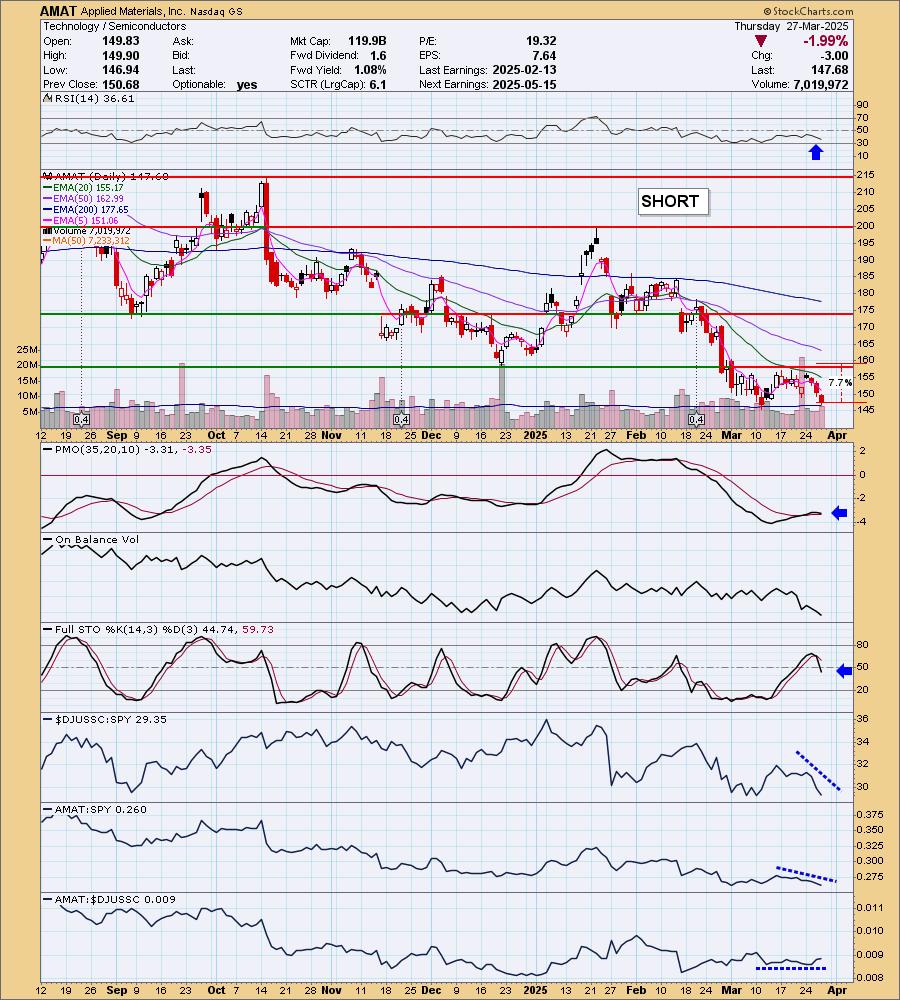
Applied Materials, Inc. (AMAT)
EARNINGS: 2025-05-15 (AMC)
Applied Materials, Inc. provides manufacturing equipment, services and software to the semiconductor, display and related industries. It operates through the following segments: Semiconductor Systems, Applied Global Services, and Display & Adjacent Markets. The Semiconductor Systems segment includes semiconductor capital equipment for etch, rapid thermal processing, deposition, chemical mechanical planarization, metrology and inspection, wafer packaging, and ion implantation. The Applied Global Services segment provides solutions to optimize equipment, performance, and productivity. The Display & Adjacent Markets segment offers products for manufacturing liquid crystal displays, organic light-emitting diodes, equipment upgrades, and other display technologies for TVs, monitors, laptops, personal computers, smart phones, and other consumer-oriented devices. The company was founded on November 10, 1967 and is headquartered in Santa Clara, CA.
Predefined Scans Triggered: P&F Double Bottom Breakdown, New CCI Sell Signals and Parabolic SAR Sell Signals.
AMAT is down -0.33% in after hours trading. Price hit overhead resistance at the December low and 20-day EMA and turned down. It hasn't broken support yet, but it appears destined to given the poor indicators. The RSI is in negative territory and is not oversold yet. The PMO topped well below the zero line and is nearing a Crossover SELL Signal. Stochastics are dropping vertically in negative territory. You can see the group is seriously underperforming the market. AMAT is underperforming as well, although it is traveling inline with the group. That's fine given the group is doing so terribly. The upside stop is set above resistance at 7.7% or $159.05.
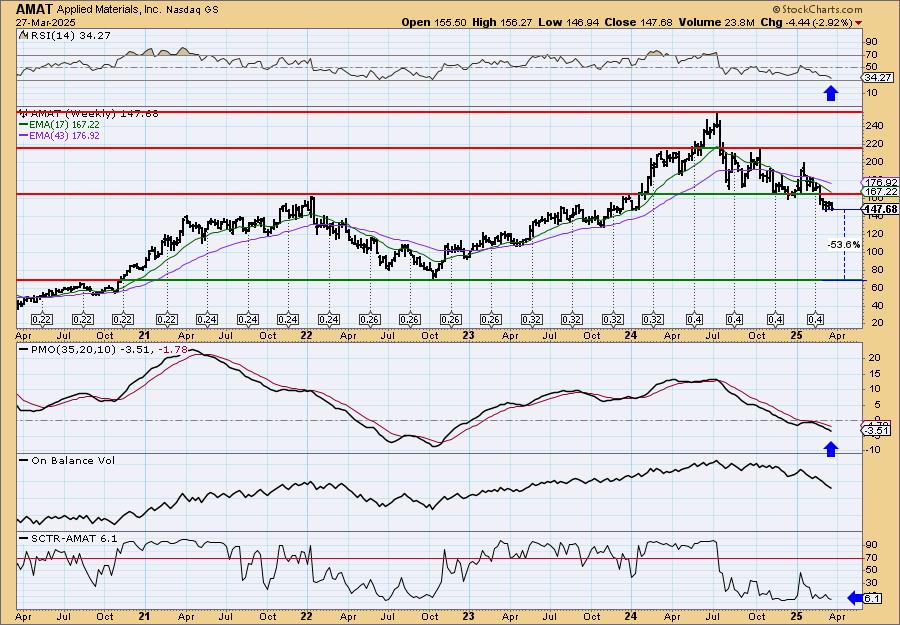
We can see that strong support was lost at the 2021 high. The weekly RSI is negative and not oversold yet. The weekly PMO is declining below the zero line and the StockCharts Technical Rank (SCTR) is in the basement, far away from the hot zone*. I don't know that we'll see a drop of more than 50%, but I certainly expect more correction.
*If a stock is in the "hot zone" above 70, it implies that it is stronger than 70% of its universe (large-, mid-, small-caps and ETFs) primarily in the intermediate to long terms.
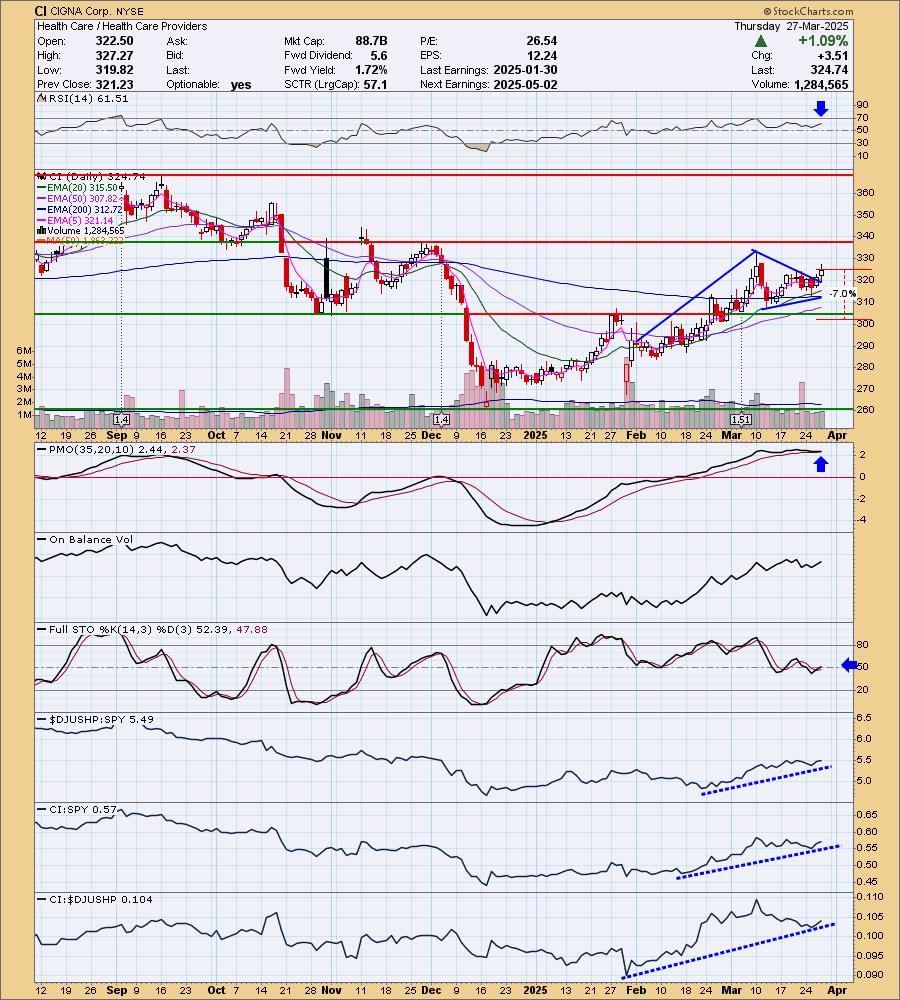
CIGNA Corp. (CI)
EARNINGS: 2025-05-02 (BMO)
The Cigna Group is a global health company, which engages in the provision of global health services. It operates through the following segments: Evernorth Health Services, Cigna Healthcare, Other Operations, and Corporate. The Evernorth Health Services segment partners with health plans, employers, governmental organizations, and health care providers to solve challenges in the areas of pharmacy benefits, home delivery pharmacy, specialty pharmacy, specialty distribution, and care delivery and management solutions. The Cigna Healthcare segment includes the U.S. Healthcare and International Health operating segments, which provide comprehensive medical and coordinated solutions to clients and customers. The Other Operations segment consists of the remainder of business operations, which includes certain ongoing businesses and exited businesses. The Corporate segment refers to net interest expense, certain litigation matters, expense associated with frozen pension plans, charitable contributions, operating severance, certain overhead and enterprise-wide project costs, and eliminations for products and services sold between segments. The company was founded in 1792 and is headquartered in Bloomfield, CT.
Predefined Scans Triggered: New CCI Buy Signals.
CI is unchanged in after hours trading. I liked the industry group first off, but this one caught my eye due to the bull flag, basically a pennant on the end of a flagpole. This week we've seen a rally out of the pennant and that calls for followthrough. The RSI is not overbought. The PMO has surged (bottomed) above the signal line today and is well above the zero line. Stochastics are back in positive territory. I like relative strength in the intermediate term. Of late it hasn't been performing that well against its group, but intermediate term it is. I've set the stop below support at 7% or $302.00.
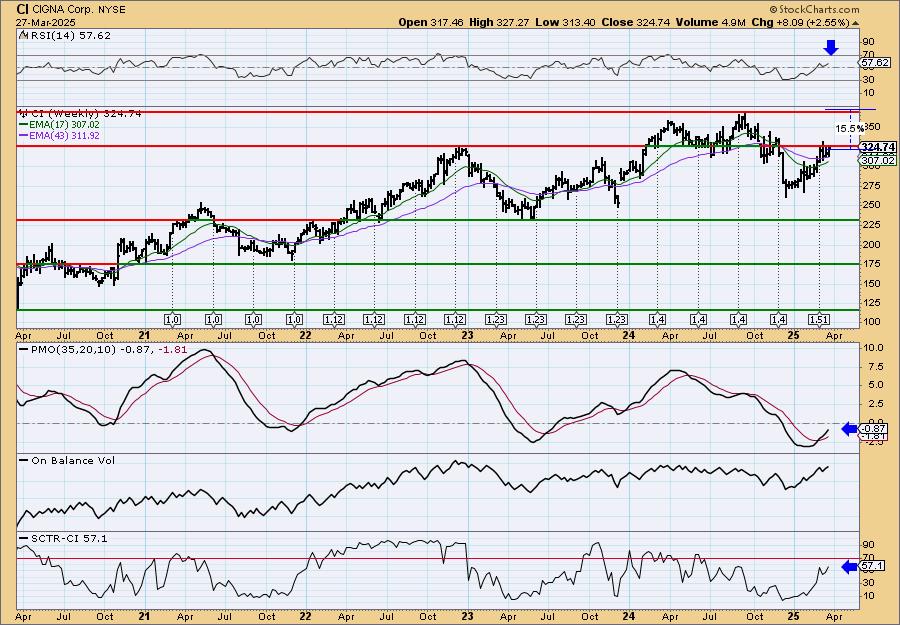
We see a nice rising trend near-term. Price reversed before testing support which is bullish. The weekly PMO is positive and not at all overbought right now. The weekly PMO is rising on a Crossover BUY Signal. The SCTR isn't in the hot zone, but it is close by and headed in that direction. I'm looking for a breakout.
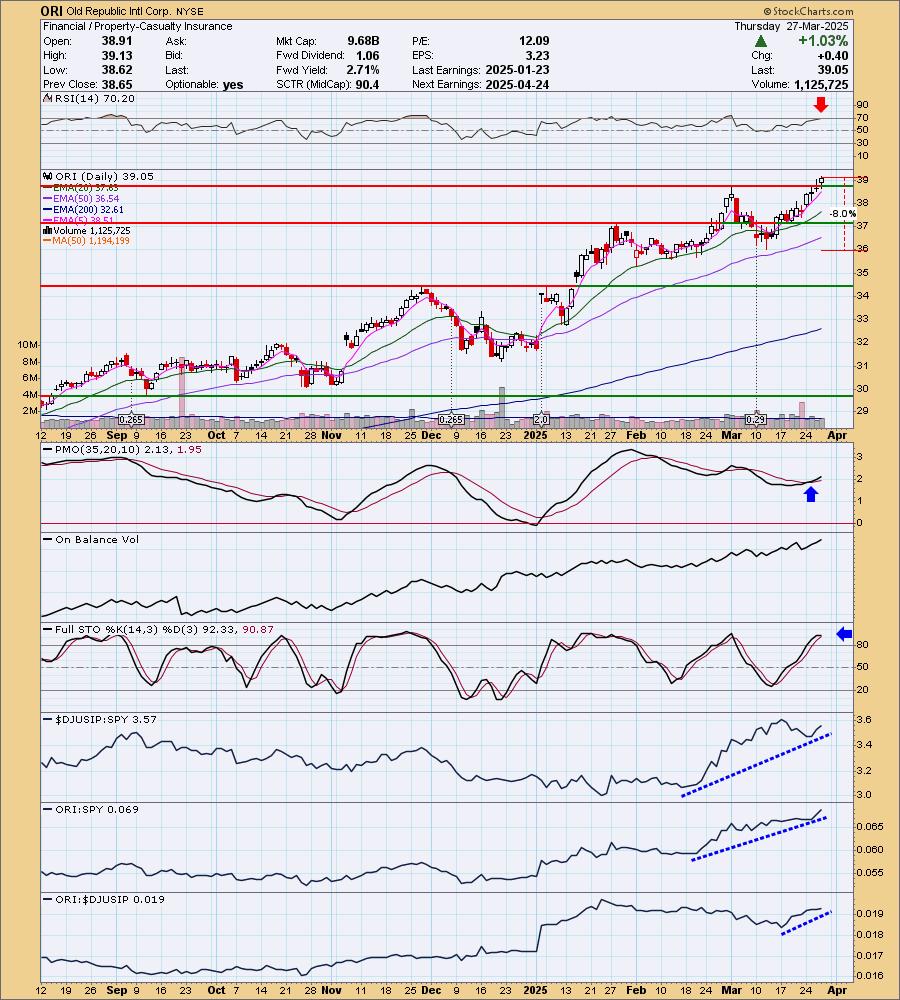
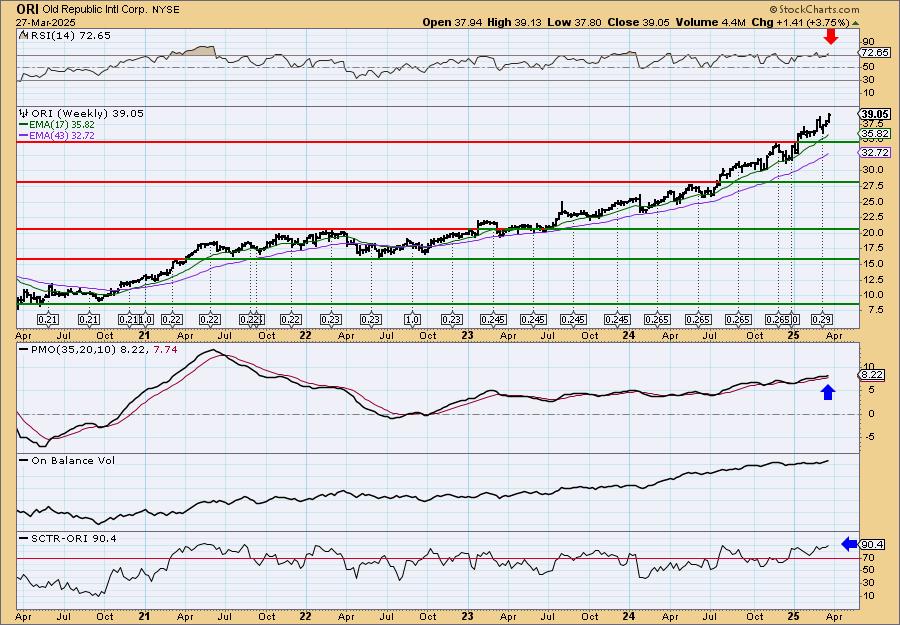
Old Republic Intl Corp. (ORI)
EARNINGS: 2025-04-24 (BMO)
Old Republic International Corp. is a holding company, which engages in the business of insurance underwriting. It operates through the following segments: General Insurance, Title Insurance, Republic Financial Indemnity Group (RFIG) Run-Off, and Corporate and Other. The General Insurance segment provides property and liability insurance primarily to commercial clients. The Title Insurance segment is involved in the issuance of policies to real estate purchasers and investors based upon searches of the public records which contain information concerning interests in real property. The RFIG Run-Off segment focuses on mortgage guaranty and consumer credit indemnity operations. The Corporate and Other segment includes a small life and accident insurance business. The company was founded in 1923 and is headquartered in Chicago, IL.
Predefined Scans Triggered: Moved Above Upper Bollinger Band, Moved Above Upper Price Channel, P&F Ascending Triple Top Breakout, P&F Double Top Breakout, Moved Above Upper Keltner Channel and New 52-week Highs.
ORI is up +0.49% in after hours trading. I liked the industry group first off and then I reviewed the chart and liked that this is a breakout to all-time highs. The one problem I do see is that the RSI is overbought currently. We've seen that it can often times continue higher even while overbought, but we should be on the lookout for at least a pause soon. The PMO suggests it has further to go up given its Crossover BUY Signal which occurred above the zero line. Stochastics are above 80. Relative strength lines are all rising. I've set the stop beneath support at 8% or $35.92.
This is a very strong rally that has been in the works since its breakout in 2022. The weekly RSI is overbought, but we can see it doesn't have too much trouble holding that condition. The weekly PMO is rising well above the zero line on a Crossover BUY Signal. The SCTR is well within the hot zone. Consider a 17% upside target to about $45.69.
Don't forget, on Thursdays I look at reader-requested symbols, click HERE to send me an email. I read every email I receive and try to answer them all!
Current Market Outlook:
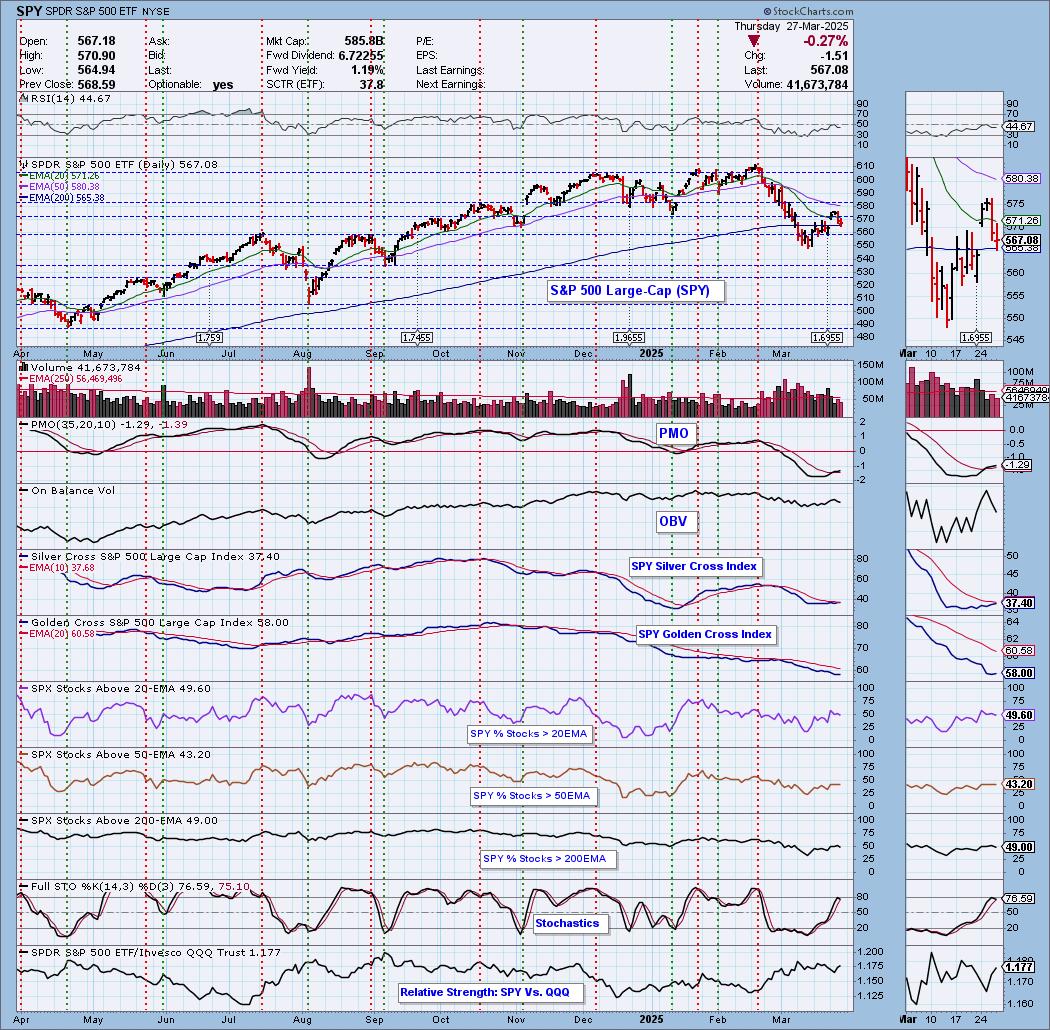
Market Environment: It is important to consider the odds for success by assessing the market tides. The following chart uses different methodologies for objectively showing the depth and trend of participation for intermediate- and long-term time frames.
- The Silver Cross Index (SCI) shows the percentage of SPX stocks on IT Trend Model BUY signals (20-EMA > 50-EMA)
- The Golden Cross Index (GCI) shows the percentage of SPX stocks on LT Trend Model BUY signals (50-EMA > 200-EMA)
Don't forget that as a "Diamonds" member, you have access to our "Under the Hood" curated ChartList on DecisionPoint.com. You'll find it under "Members Only" links on the left side on the Blogs and Links Page.
Here is the current chart:
Full Disclosure: I am 15% long, 0% short.
I'm required to disclose if I currently own a stock I mention and/or may buy/short it within the next 72 hours.
"Technical Analysis is a windsock, not a crystal ball." - Carl Swenlin
(c) Copyright 2025 DecisionPoint.com
Watch the latest episode of DecisionPoint Trading Room with Carl Swenlin & Erin Swenlin Mondays on the DecisionPoint YouTube channel here!
NOTE: The stocks reported herein are from mechanical trading model scans that are based upon moving average relationships, momentum and volume. DecisionPoint analysis is then applied to get five selections from the scans. The selections given should prompt readers to do a chart review using their own analysis process. This letter is not a call for a specific action to buy, sell or short any of the stocks provided. There are NO sure things or guaranteed returns on the daily selection of "Diamonds in the Rough."
Regarding BUY/SELL Signals: The signal status reported herein is based upon mechanical trading model signals and crossovers. They define the implied bias of the price index/stock based upon moving average relationships and momentum, but they do not necessarily call for a specific action. They are information flags that should prompt chart review. Further, they do not call for continuous buying or selling during the life of the signal. For example, a BUY signal will probably (but not necessarily) return the best results if action is taken soon after the signal is generated. Additional opportunities for buying may be found as price zigzags higher, but the trader must look for optimum entry points. Conversely, exit points to preserve gains (or minimize losses) may be evident before the model mechanically closes the signal.
Helpful DecisionPoint Links:
Price Momentum Oscillator (PMO)
Swenlin Trading Oscillators (STO-B and STO-V)
For more links, go to DecisionPoint.com