
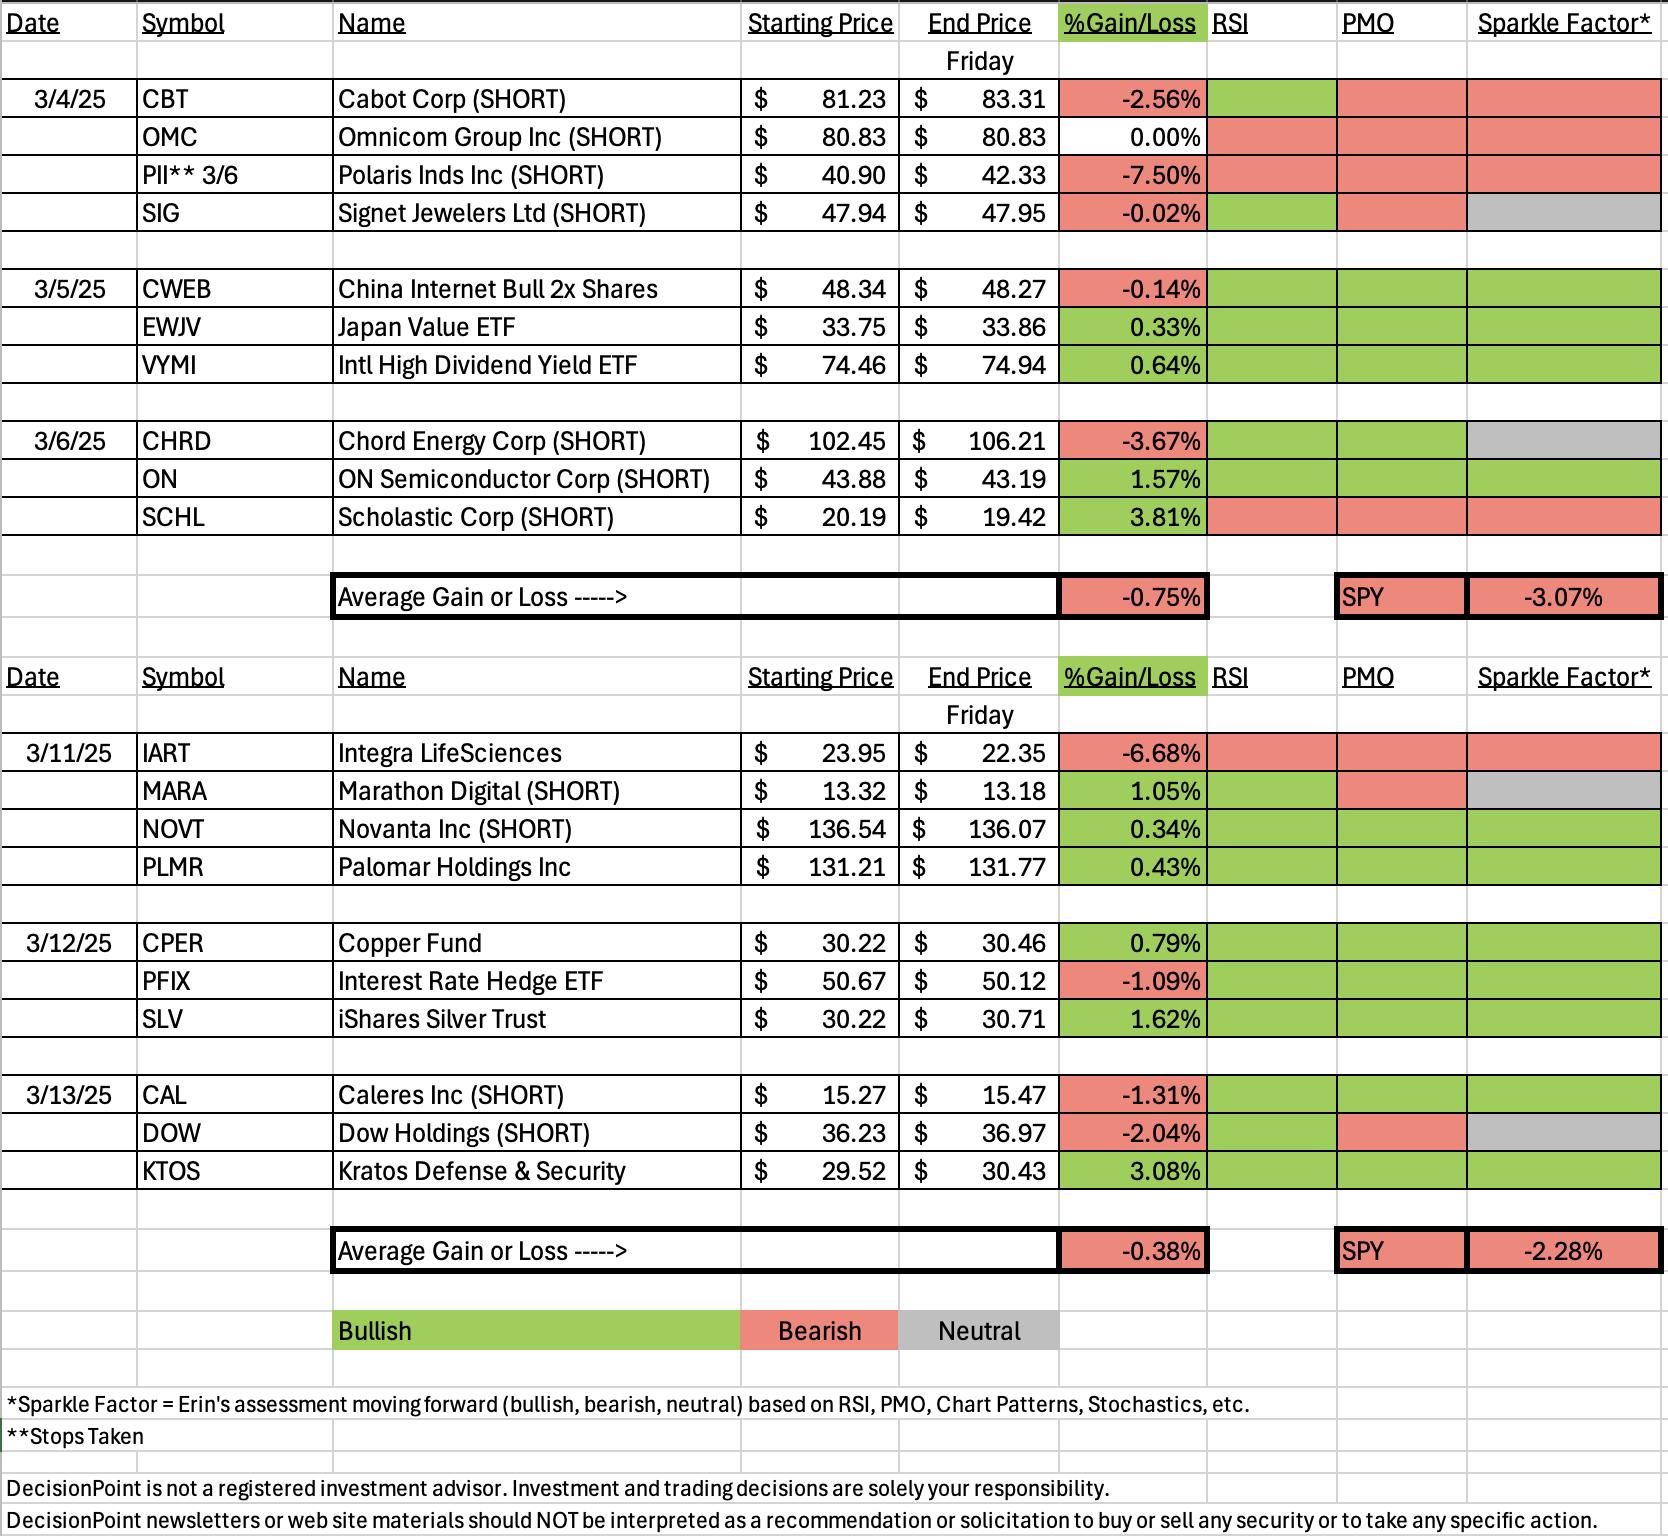
It wasn't a perfect week, but ultimately "Diamonds in the Rough" finished higher than the SPY by quite a bit. I prefer to see a positive average to the week, but I'll accept a SPY beat.
The market does look set up to continue its rally next week. With the overall geopolitical environment not really changing though I think that upside will be somewhat limited. It may be a time to expand your portfolio a bit, I decided to expand my exposure somewhat. I opted to pick up yesterday's KTOS as we do have increased defense spending in the stop gap bill that should be signed today. ETF ITA also looks like a good choice.
This week's Sector to Watch is Financials (XLF). The PMO hasn't technically bottomed yet, but it made an effort to do so on today's rally. Runner-ups would be Energy (XLE) and Utilities (XLU). Technology (XLK) could be very interesting next week if this rally sees a continuation, but it is still a bearish chart and thus I didn't pick it today.
The Industry Group to Watch is Specialty Finance. There weren't a huge amount of choices within the group as it is just now beginning to turn up, but I did find: KREF, MSCI and IX as possibilities to watch next week.
I will say that I was tempted to select Semiconductors (SMH) as this week's industry group to watch. They are rebounding now and should find favor next week on a rally continuation. MTSI was one that came up in the scans today. May be worth a watch as well.
This week's "Darling" was Kratos Defense (KTOS) which as I mentioned above I picked up. This week's "Dud" was Integra LifeSciences (IART). We'll discuss these further down.
I did have time to run two scans to finish the trading room today. It was interesting because most of the symbols were Energy stocks so I did wonder if I chose the right Sector to Watch. I liked the following symbols: CTRA, RRC, TXNM, AR, FICO, OKE and MTSI.
Have a very good weekend! I'll see you in Monday's free trading room!
Good Luck & Good Trading,
Erin

Diamond Mine Trading Room:
RECORDING & DOWNLOAD LINK (3/14/2025):
Topic: DecisionPoint Diamond Mine (3/14/2025) LIVE Trading Room
Download & Recording Link
Passcode: March#14
REGISTRATION for 3/21/2025:
When: March 21, 2025 09:00 AM Pacific Time (US and Canada)
Topic: DecisionPoint Diamond Mine LIVE Trading Room
Register in advance for this webinar HERE
After registering, you will receive a confirmation email containing information about joining the webinar.

Below is the latest free DecisionPoint Trading Room recording from 3/10. You'll find these recordings posted on Mondays to our DP YouTube Channel. Be sure and subscribe HERE.
A few items about the spreadsheet: I've put on the spreadsheet whether the RSI is positive (green) or negative (red). The PMO column tells you if it is rising (green) or falling (red). Finally I've added my own "Sparkle Factor" that gives you my assessment going forward, bullish (green), bearish (red) or neutral (gray). The Sparkle Factor is basically my thoughts on whether I expect it to rise or fall. A neutral means it could really go either way so it could be added to a watch list. If you're in a stock I consider "neutral" going forward, the ball is in your court.
Darling:
Kratos Defense & Security Solutions, Inc. (KTOS)
EARNINGS: 2025-05-06 (AMC)
Kratos Defense & Security Solutions, Inc. engages in the provision of mission critical products, services and solutions for United States national security priorities. It operates through the Kratos Government Solutions (KGS) and Unmanned Systems (US) segments. The KGS segment consists of an aggregation of KGS operating segments, including microwave electronic products, space, satellite and cyber, training solutions. The US segment refers to the unmanned aerial, unmanned ground, unmanned seaborne and related command, control and communications system businesses. The company was founded on December 19, 1994, and is headquartered in Round Rock, TX.
Predefined Scans Triggered: Hollow Red Candles.
Below are the commentary and chart from Thursday, 3/13:
"KTOS is up +0.03% in after hours trading. It is on a nice rally off horizontal support and the 200-day EMA. The RSI is positive and not at all overbought. The PMO is rising strongly on a Crossover BUY Signal. It is below the zero line but it is showing new strength in my opinion. The OBV is rising with price to confirm the rising trend. Stochastics are above 80. Relative strength lines are all rising strongly. I've set the stop arbitrarily at 7.8% or $27.21."
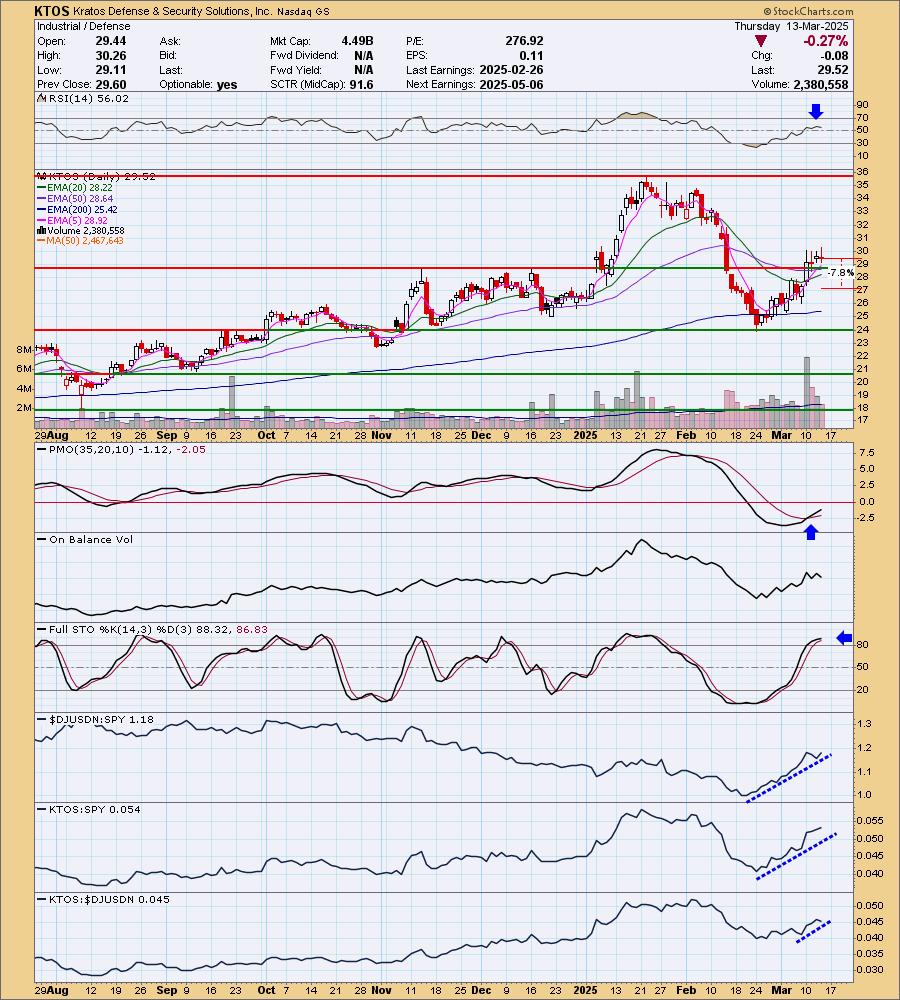
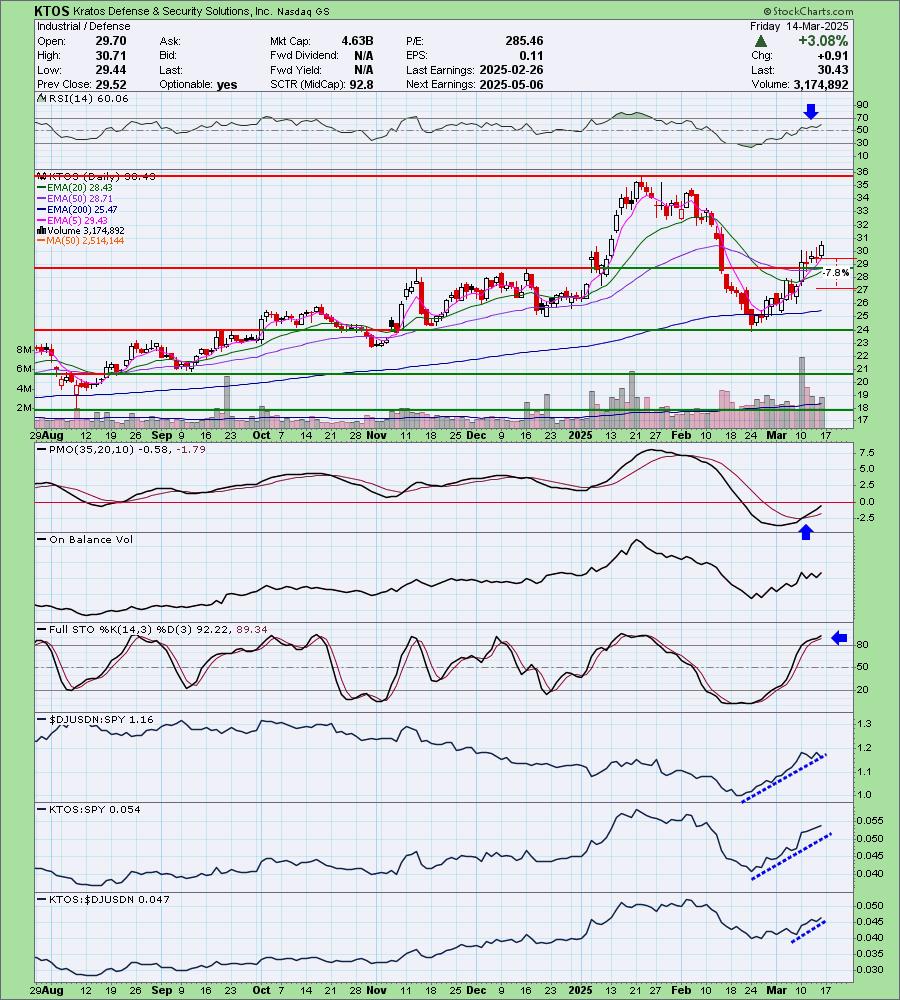
Here is today's chart:
The rally continues and the indicators continue to ripen and look very positive. The nice thing is that it is still not at all overbought and could accommodate far more upside. Overhead resistance doesn't arrive for awhile so upside potential looks very good. It's only been one day since being picked so it makes sense that the chart is still very favorable.
Don't forget, on Thursdays I look at reader-requested symbols, so shoot me an email at erin@decisionpoint.com. I read every email I receive and try to answer them all!
Dud:
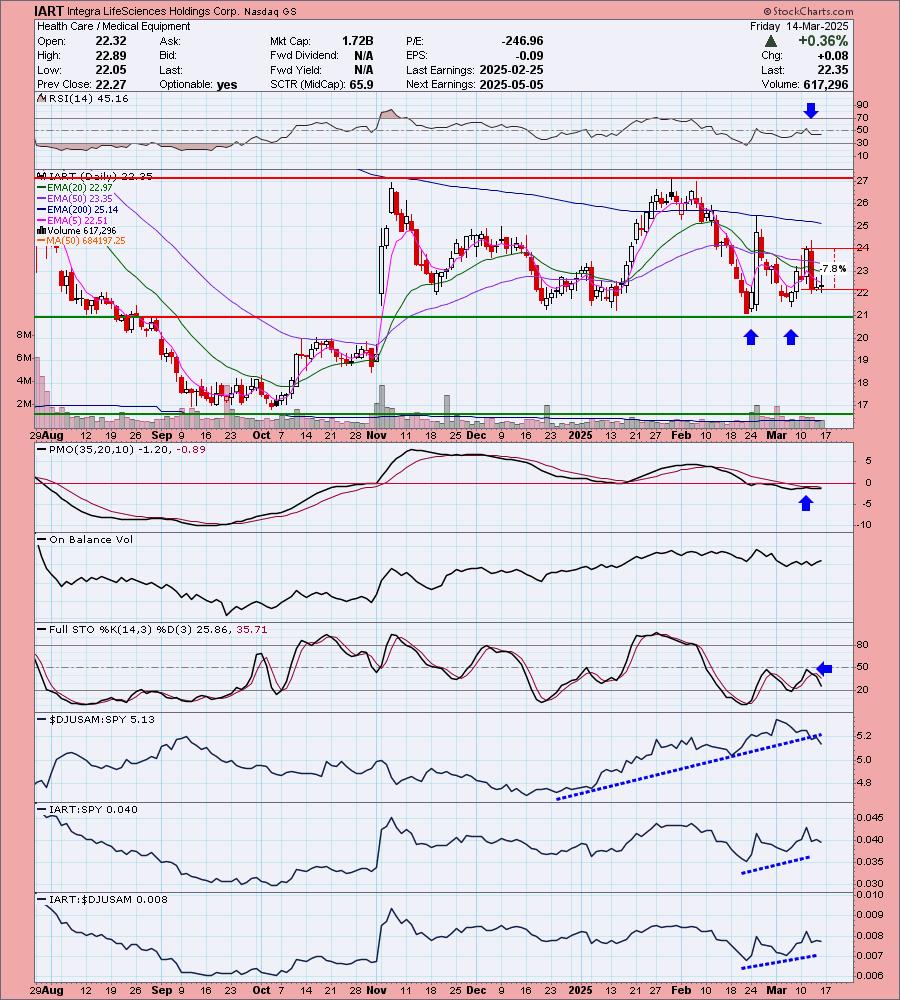
Integra LifeSciences Holdings Corp. (IART)
EARNINGS: 2025-05-05 (BMO)
Integra LifeSciences Holdings Corp. engages in the provision of regenerative tissue technologies and neurological solutions dedicated to limiting uncertainty for clinicians. It operates under the Codman Specialty Surgical (CSS) and Tissue Technologies (TT) segments. The CSS segment includes technologies and instrumentation used for neurosurgery, neurocritical care, and otolaryngology. The TT segment focuses on complex wound surgery, surgical reconstruction, and peripheral nerve repair. The company was founded by Richard E. Caruso in 1989 and is headquartered in Princeton, NJ.
Predefined Scans Triggered: Elder Bar Turned Green, Bullish MACD Crossovers and Bullish 50/200-day MA Crossovers.
Below are the commentary and chart from Tuesday, 3/11:
"IART is unchanged in after hours trading. I liked the double bottom pattern coming off strong support. The minimum upside target of the pattern implies an impending breakout. The RSI just moved into positive territory and the PMO is nearing a Crossover BUY Signal. It isn't that far beneath the zero line. Stochastics are rising again. Relative strength studies are very positive with the group and IART all outperforming the SPY. IART is also showing leadership within the group. The stop is set arbitrarily at 7.8% or $22.08."
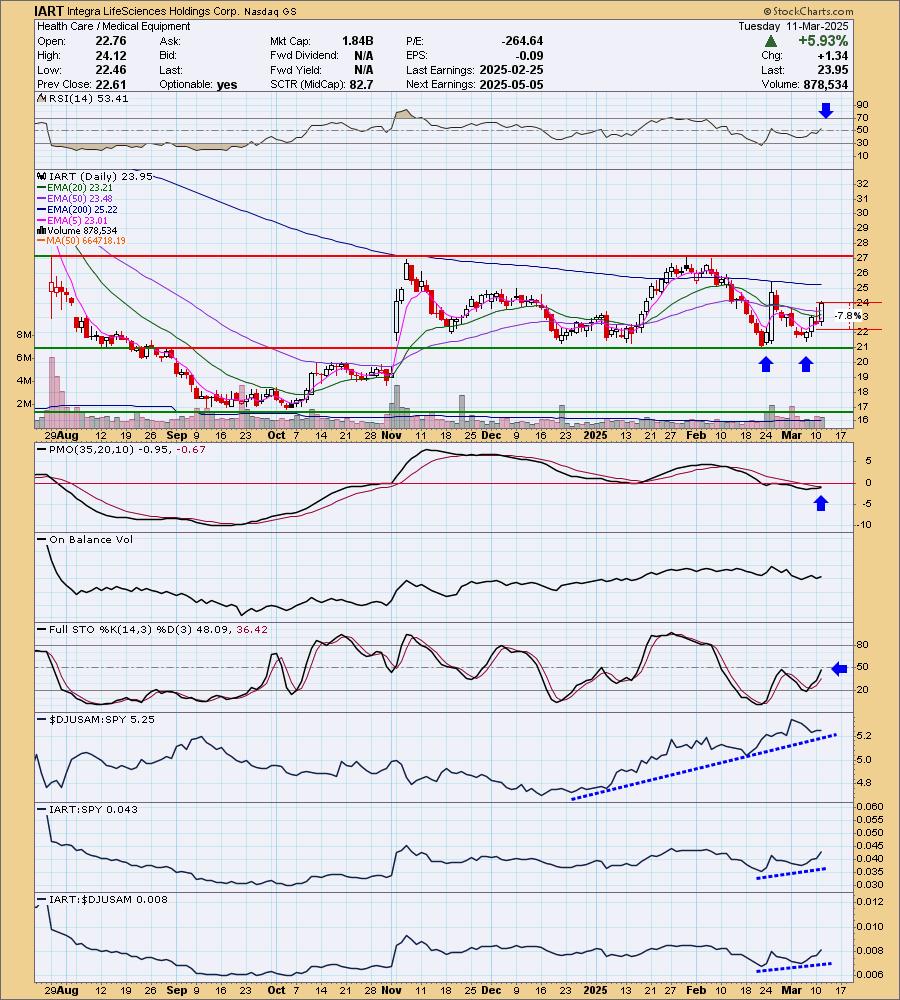
Here is today's chart:
I really loved the setup on this chart and was very surprised to see the immediate drawdown that followed it being picked. We had a nice double bottom. What went wrong? Well we can see that the group started to really underperform and that likely put some downside pressure on it. Earnings were well received back in February and the PMO and Stochastics were lined up well. Since then the chart has gone south so while we could see a rally here, the chart just isn't bullish right now.
THIS WEEK's Performance:
DecisionPoint Market Scoreboard (Mechanical Trend Model Signals):
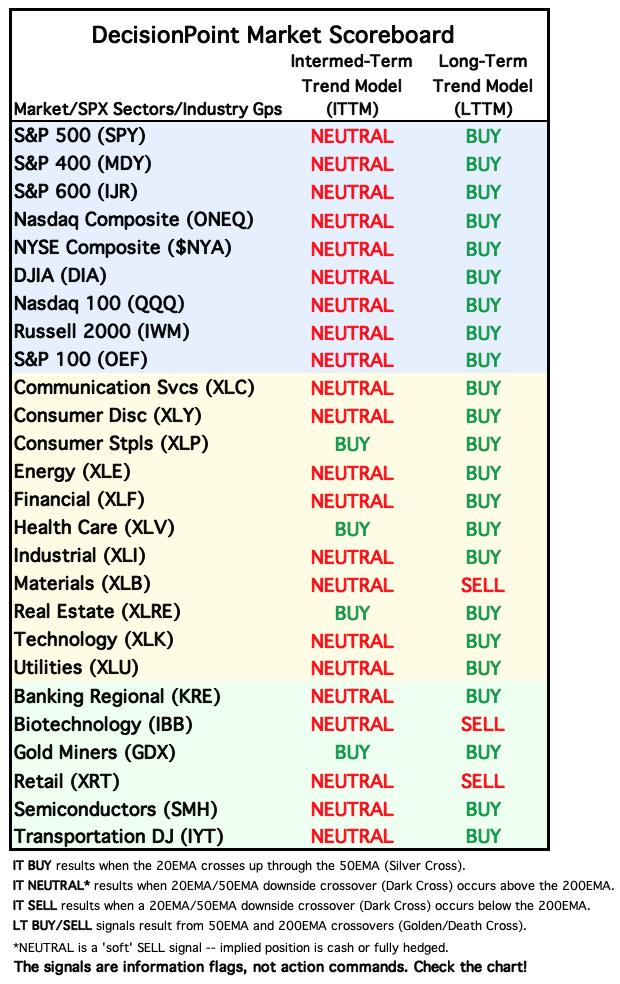
Friday signal changes are outlined in purple.
Click Here to view Carl's annotated "Under the Hood" ChartList!
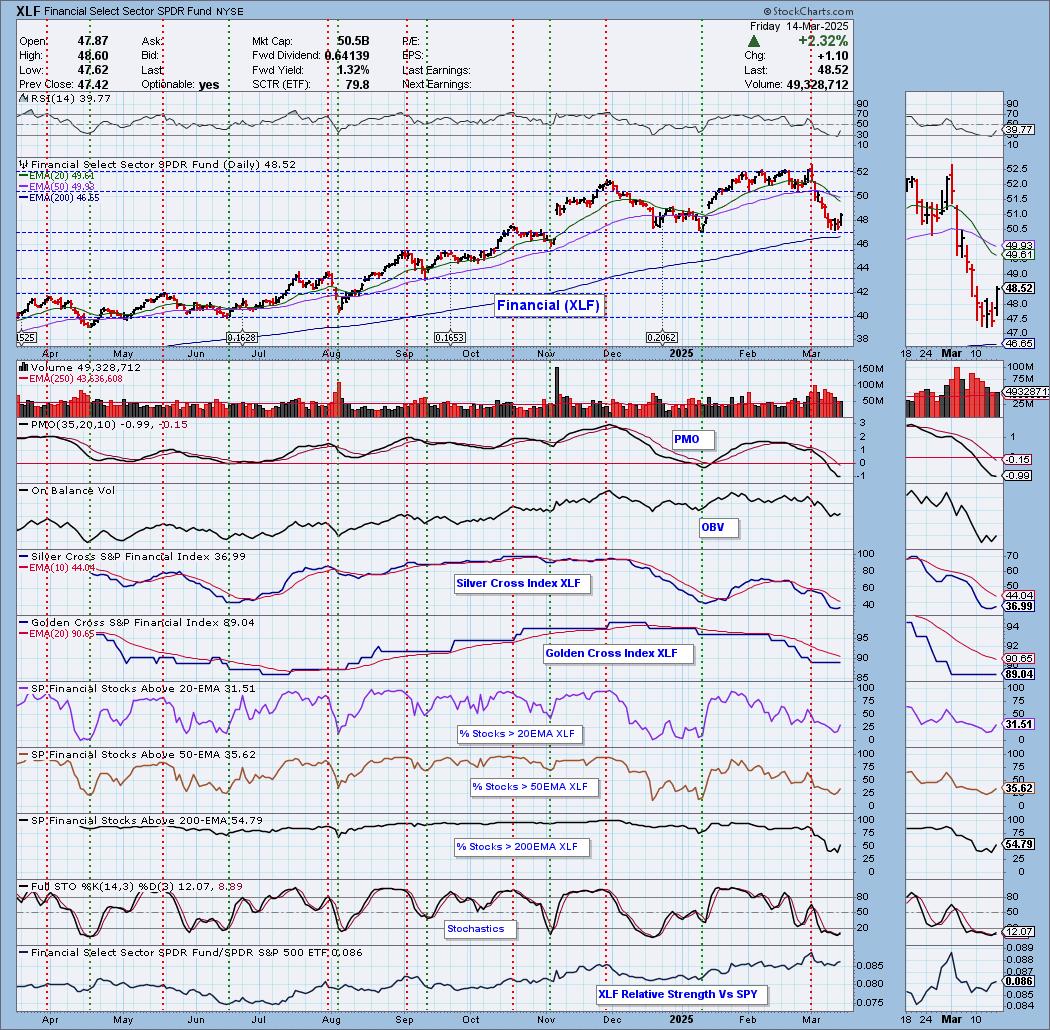
Sector to Watch: Financials (XLF)
Price saw a nice rally today off strong support. This is what attracted me this morning. We do have a Dark Cross of the 20/50-day EMAs and the PMO is quite rising yet, but we are seeing a little bit of improvement in participation. Participation numbers are low but aren't that low so there are some stocks out there that could support a reversal. Stochastics just turned back up as did the Silver Cross Index. I think we'll see some followthrough next week.
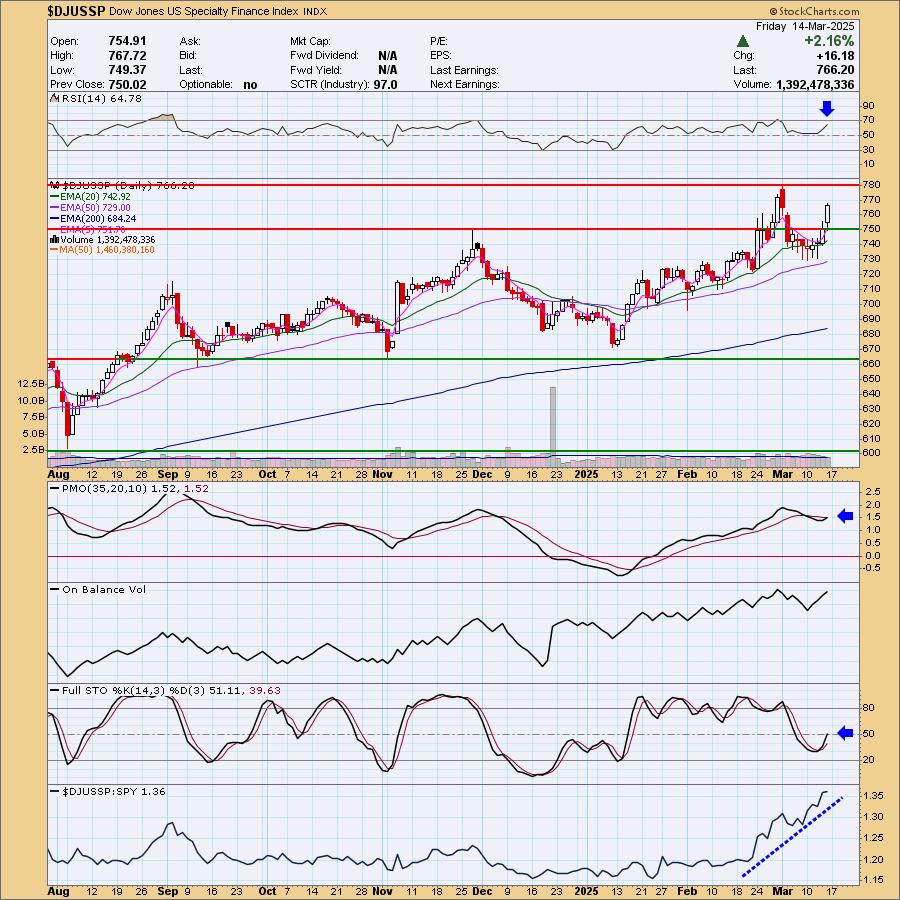
Industry Group to Watch: Specialty Finance ($DJUSSP)
I picked this group primarily due to the strong rising trend out of the January low. It also pulled back and is now headed back up to a likely upside breakout. The PMO is in the process of crossing above its signal line and Stochastics just moved into positive territory above net neutral (50). Relative strength has been out of this world due to its steady rally higher. I did find a few symbols of interest: KREF, MSCI and IX.
Go to our Under the Hood ChartList on DecisionPoint.com to get an in-depth view of all the sectors. On StockCharts.com you can find the Industry Summary.
Good Luck & Good Trading!
- Erin
erin@decisionpoint.com
Full Disclosure: I'm 20% long, 0% short.
Watch the latest episode of the DecisionPoint Trading Room with Carl & Erin Swenlin HERE!
Technical Analysis is a windsock, not a crystal ball. --Carl Swenlin
NOTE: The stocks reported herein are from mechanical trading model scans that are based upon moving average relationships, momentum and volume. DecisionPoint analysis is then applied to get selections from the scans. The selections given should prompt readers to do a chart review using their own analysis process. This letter is not a call for a specific action to buy, sell or short any of the stocks provided. There are NO sure things or guaranteed returns on the selection of "diamonds in the rough."
Helpful DecisionPoint Links:
DecisionPoint Shared ChartList and DecisionPoint Chart Gallery
Price Momentum Oscillator (PMO)
Swenlin Trading Oscillators (STO-B and STO-V)
(c) Copyright 2025 DecisionPoint.com