
Shout out to Fred who never disappoints on Reader Request Day. He was the only one to send in requests this week.
I liked every position he brought to the table. I didn't include the Gold Miners he sent in, but those charts look very good. I'm still unsure about the Dollar wanting to reverse higher so I opted not to present them. Gold however, is performing very well and given the market's decline, it could continue to outperform and that will work in their favor.
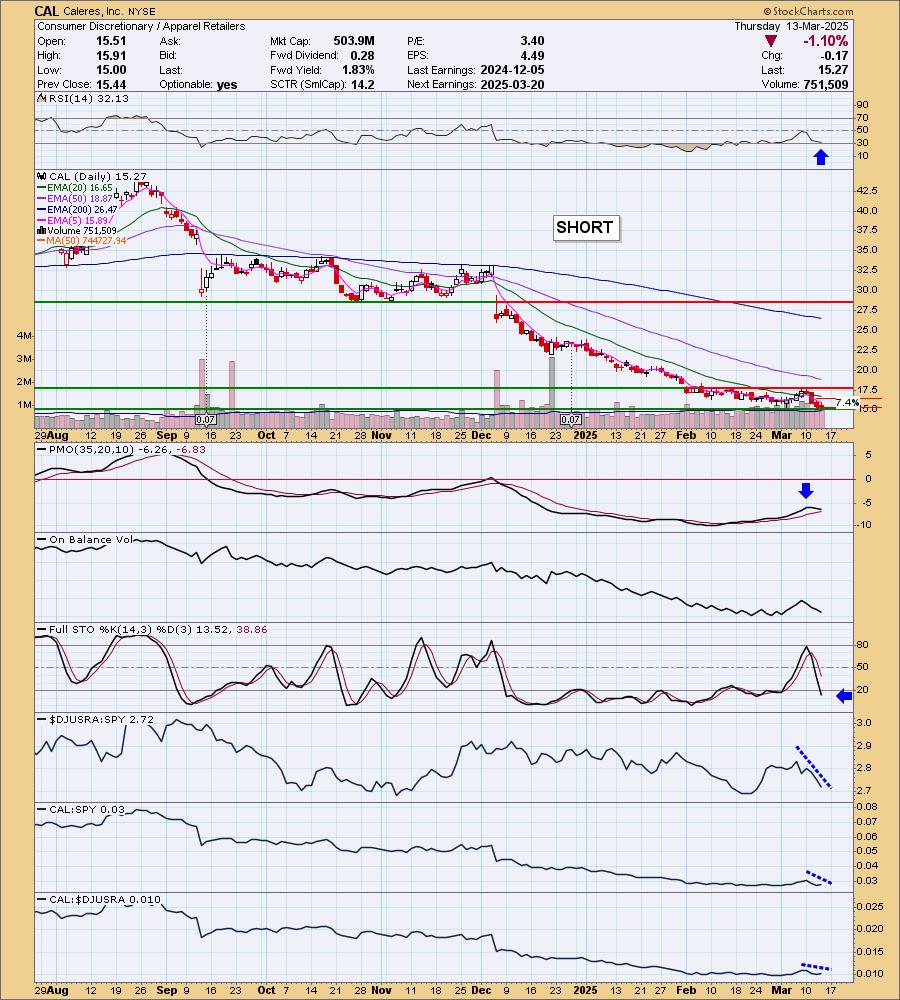
He only included one short and I decided we needed another one so I found a stinker from today's Diamond Dog Scan results. I used the PMO sort to be sure and find one with a very low PMO reading. It is CAL which has incredible downside potential.
The Defense stock that he presented as a long this week also looked very good so I decided to include it rather than the Gold Miners.
Tomorrow is the Diamond Mine trading room! Be sure and register below! We love to see new faces in the room.
Good Luck & Good Trading,
Erin
Today's "Diamonds in the Rough": CAL (Short), DOW (Short) and KTOS.
Other requests: AGI and GFI.

Diamond Mine Trading Room:
RECORDING & DOWNLOAD LINK (3/7/2025):
Topic: DecisionPoint Diamond Mine (3/7/2025) LIVE Trading Room
Download and Recording Link
Passcode: March#7th
REGISTRATION for 3/14/2025:
When: March 14, 2025 09:00 AM Pacific Time (US and Canada)
Topic: DecisionPoint Diamond Mine LIVE Trading Room
Register in advance for this webinar HERE
After registering, you will receive a confirmation email containing information about joining the webinar.

Below is the latest free DecisionPoint Trading Room recording from 3/10. You'll find these recordings posted on Mondays to our DP YouTube Channel. Be sure and subscribe HERE.
Welcome to DecisionPoint Diamonds, wherein I highlight ten "Diamonds in the Rough" per week. These are selected from the results of my DecisionPoint Scans which search for stocks that could benefit from the trend and condition of the market. Remember, these are not recommendations to buy or sell, but are the most interesting of the stocks that surfaced in my scans. My objective is to save you the work of the initial, tedious culling process, but you need to apply your own analysis to see if these stocks pique your interest as well. There are no guaranteed winners here!
"Predefined Scans Triggered" are taken from StockCharts.com using the "Symbol Summary" option instead of a "SharpChart" on the workbench.
Stop levels are all rounded down.
Caleres, Inc. (CAL) - SHORT
EARNINGS: 2025-03-20 (BMO) ** Reports Next Week **
Caleres, Inc. engages in the provision of athletic, casual, and dress footwear products. It operates through the Famous Footwear and Brand Portfolio segments. The Famous Footwear segment provides branded footwear for the entire family. The Brand Portfolio segment sources, manufactures, and markets branded, licensed, and private-labeled footwear primarily to online retailers, national chains, department stores, mass merchandisers, and independent retailers. The company was founded by George Warren Brown in 1878 and is headquartered in St. Louis, MO.
Predefined Scans Triggered: P&F Double Bottom Breakdown, P&F Descending Triple Bottom Breakdown and New 52-week Lows.
CAL is unchanged in after hours trading. In the very near term, price is at support. The recent failed rally made it interesting to me. Tariffs on China are likely to hurt this company which I suspect gets their products from there. You'd have to check that to confirm though. The RSI is negative and not oversold yet. The PMO has topped well below the zero line and Stochastics are below 20 indicating extreme internal weakness. Relative strength is moving lower as we would want on a short position. The upside stop is set near the 20-day EMA at 7.4% or $14.14.
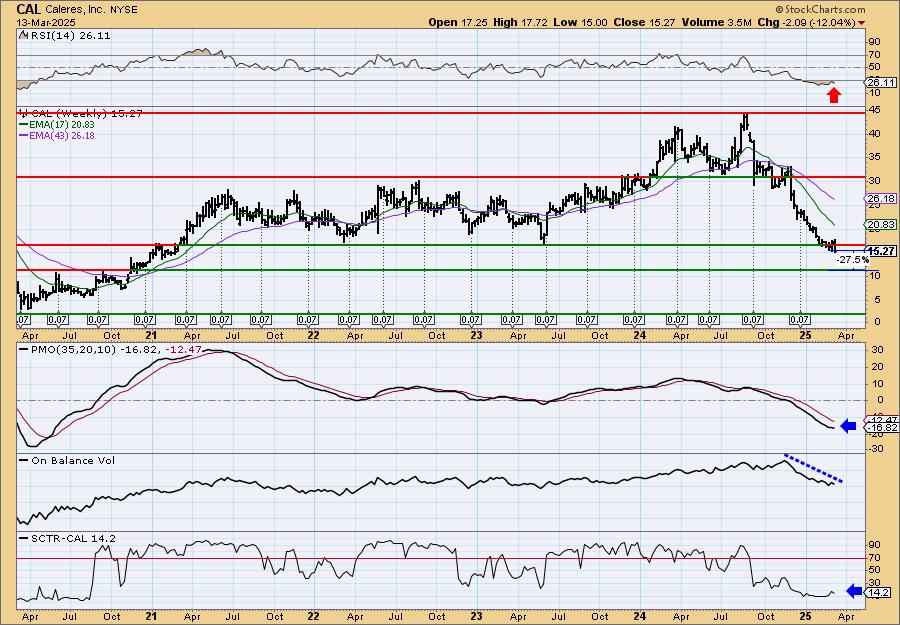
On the weekly chart we see that very strong support has been broken. It is showing as oversold right now but those conditions can persist in a bearish configuration. It's been oversold for weeks and it hasn't helped. The weekly PMO is still in decline and the OBV is confirming the decline with a decline of its own. The StockCharts Technical Rank (SCTR) is extremely low and outside of the hot zone* above 70. We have excellent downside potential.
*If a stock is in the "hot zone" above 70, it implies that it is stronger than 70% of its universe (large-, mid-, small-caps and ETFs) primarily in the intermediate to long terms.
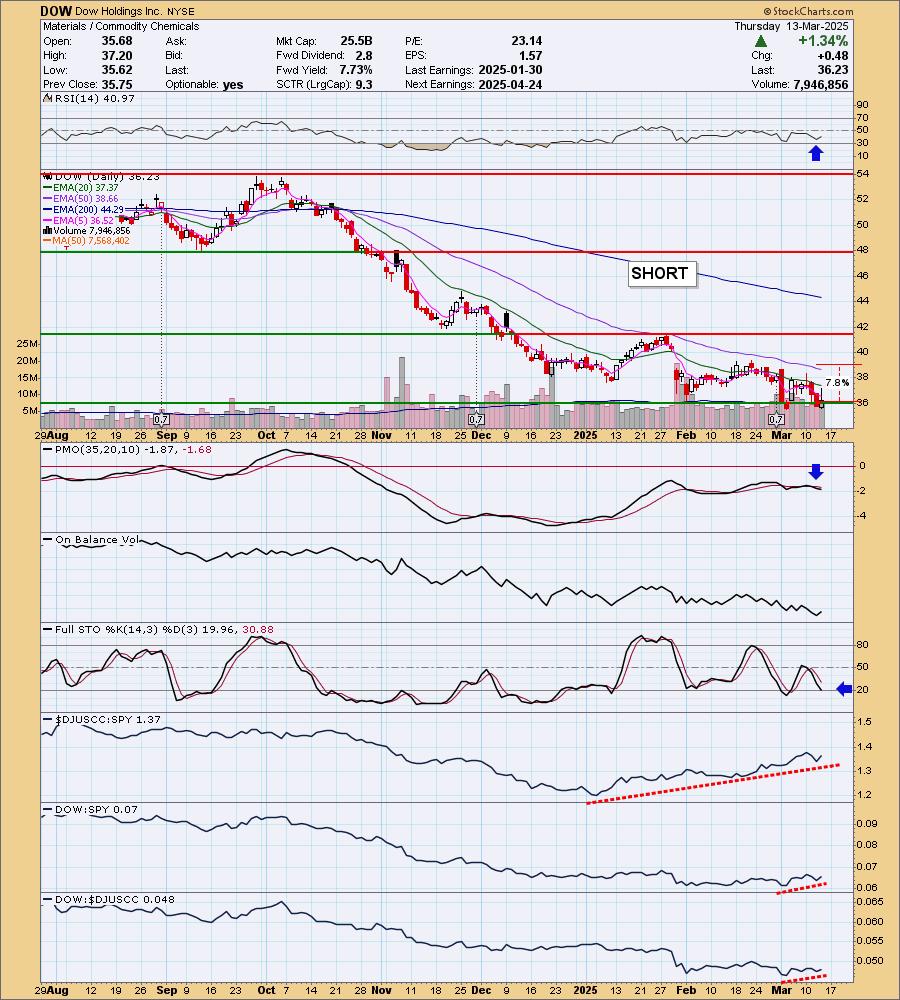
Dow Holdings Inc. (DOW) - SHORT
EARNINGS: 2025-04-24 (BMO)
Dow, Inc. is a materials science company, which engages in the development of innovative solutions. It operates through the following segments: Packaging and Specialty Plastics, Industrial Intermediates and Infrastructure, and Performance Materials and Coatings. The Packaging and Specialty Plastics segment consists of hydrocarbons and energy and packaging and specialty plastics. The Industrial Intermediates and Infrastructure segment covers the industrial solutions and polyurethanes and construction chemicals. The Performance Materials and Coatings segment includes coatings and performance monomers and consumer solutions. The company was founded in 1897 and is headquartered in Midland, MI.
Predefined Scans Triggered: None.
DOW is up +0.26% in after hours trading. I picked this one as did Fred based on the weekly chart. We do see that support is currently holding in the very short term. A sizable rally would set up a bullish double bottom so be careful with that. The declining trend is pronounced so I'm expecting more downside. The RSI is negative and not oversold. The PMO has topped for a second time below the zero line and is headed lower. Stochastics have moved below 20 indicating weakness. Unfortunately, relative strength is not what I'd like to see as it is rising across the board. This could make it slow going on this short. The upside stop is set above resistance and the 50-day EMA at 7.8% or $33.40. So not the best looking short on the daily chart but the weekly chart...
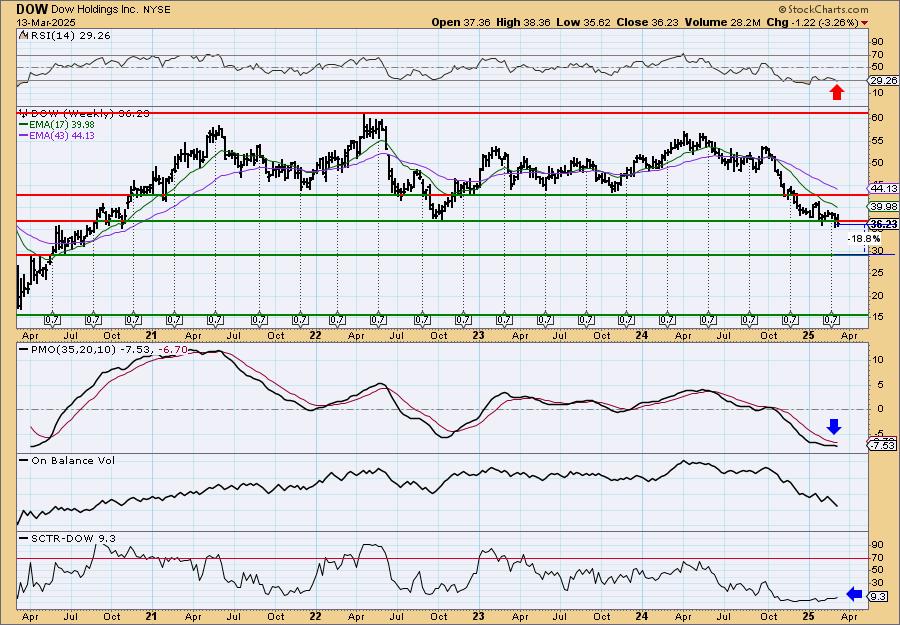
The weekly chart shows a drop beneath long-term support. The weekly PMO has topped beneath the signal line and the SCTR is in the basement. It is showing oversold on the weekly RSI, but it could get further oversold based on where it has been recently. Downside potential is very good.
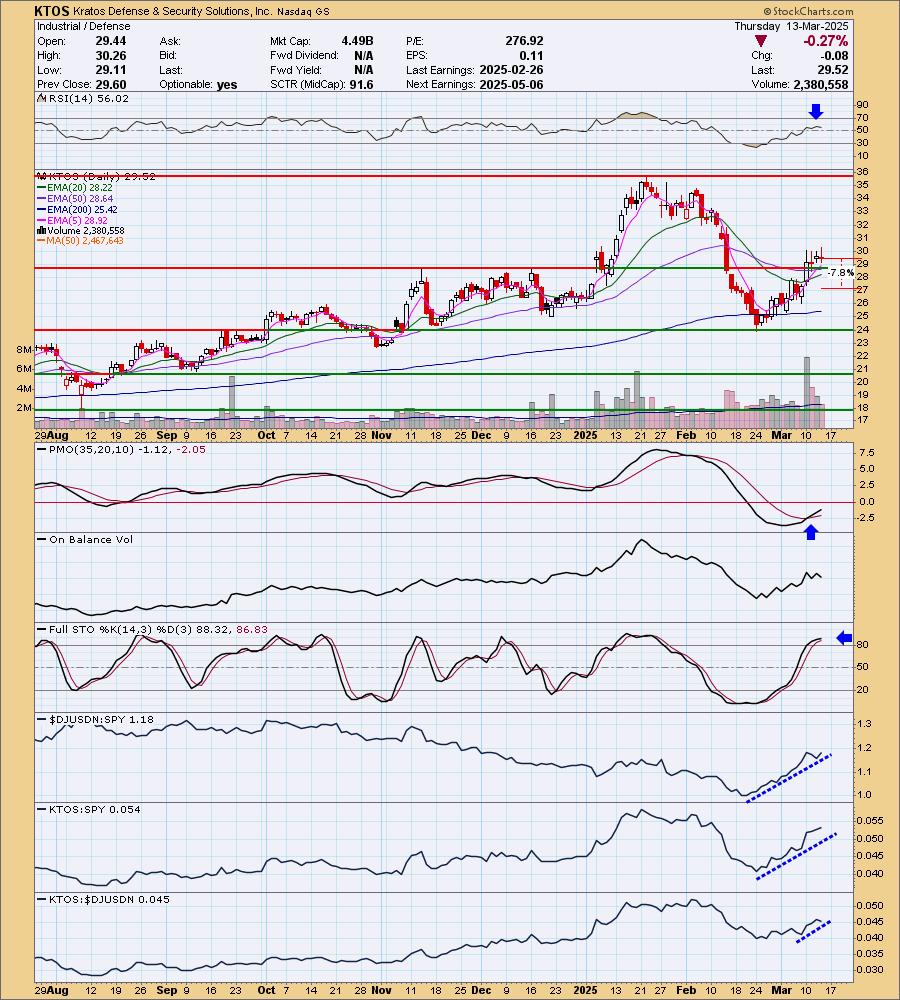
Kratos Defense & Security Solutions, Inc. (KTOS)
EARNINGS: 2025-05-06 (AMC)
Kratos Defense & Security Solutions, Inc. engages in the provision of mission critical products, services and solutions for United States national security priorities. It operates through the Kratos Government Solutions (KGS) and Unmanned Systems (US) segments. The KGS segment consists of an aggregation of KGS operating segments, including microwave electronic products, space, satellite and cyber, training solutions. The US segment refers to the unmanned aerial, unmanned ground, unmanned seaborne and related command, control and communications system businesses. The company was founded on December 19, 1994, and is headquartered in Round Rock, TX.
Predefined Scans Triggered: Hollow Red Candles.
KTOS is up +0.03% in after hours trading. It is on a nice rally off horizontal support and the 200-day EMA. The RSI is positive and not at all overbought. The PMO is rising strongly on a Crossover BUY Signal. It is below the zero line but it is showing new strength in my opinion. The OBV is rising with price to confirm the rising trend. Stochastics are above 80. Relative strength lines are all rising strongly. I've set the stop arbitrarily at 7.8% or $27.21.
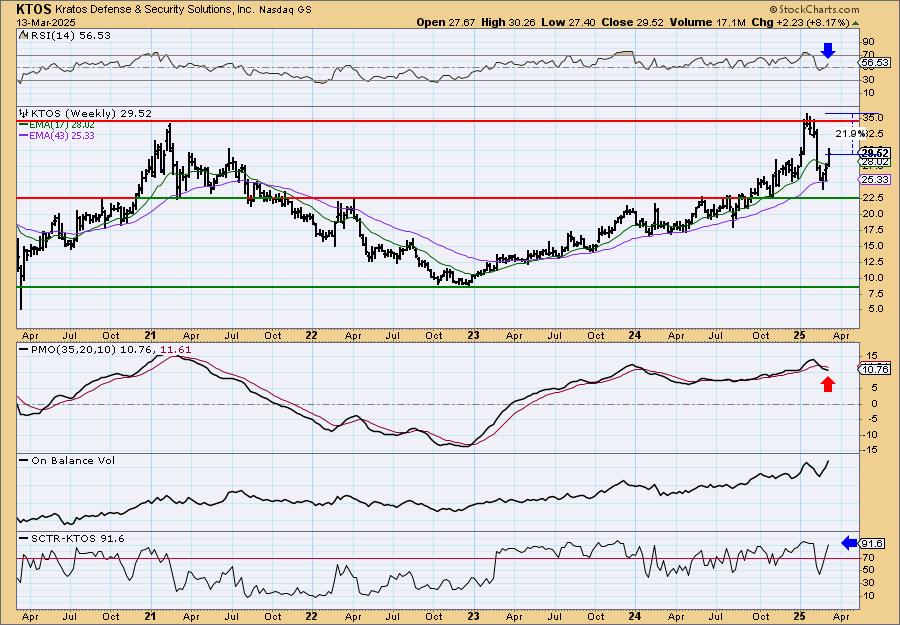
The weekly chart is solid minus the declining weekly PMO. The deep decline pushed it lower and it is still trying to dig out from under that. The weekly RSI is positive and not overbought. The SCTR is at the top of the hot zone. There is excellent upside potential if it can get back to its last high.
Don't forget, on Thursdays I look at reader-requested symbols, click HERE to send me an email. I read every email I receive and try to answer them all!
Current Market Outlook:
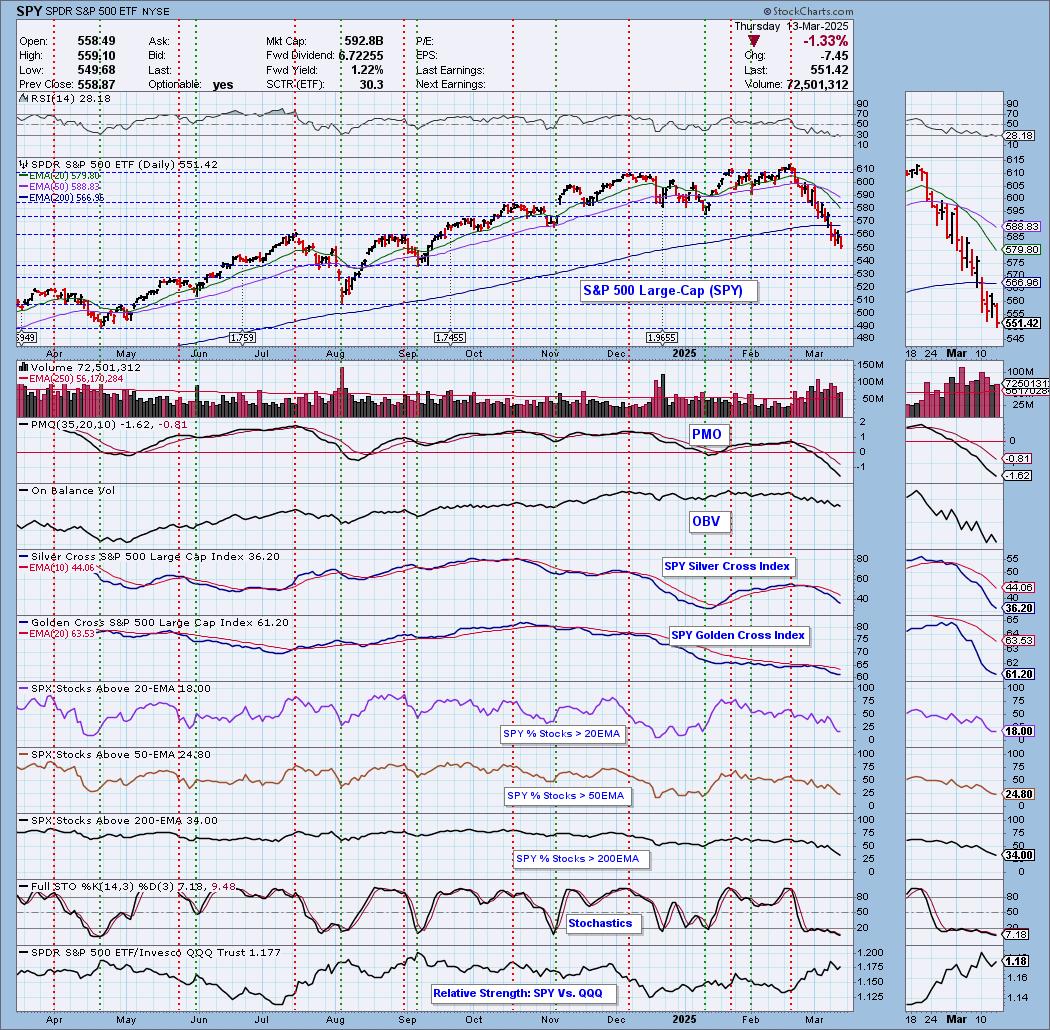
Market Environment: It is important to consider the odds for success by assessing the market tides. The following chart uses different methodologies for objectively showing the depth and trend of participation for intermediate- and long-term time frames.
- The Silver Cross Index (SCI) shows the percentage of SPX stocks on IT Trend Model BUY signals (20-EMA > 50-EMA)
- The Golden Cross Index (GCI) shows the percentage of SPX stocks on LT Trend Model BUY signals (50-EMA > 200-EMA)
Don't forget that as a "Diamonds" member, you have access to our "Under the Hood" curated ChartList on DecisionPoint.com. You'll find it under "Members Only" links on the left side on the Blogs and Links Page.
Here is the current chart:
Full Disclosure: I am 10% long, 0% short.
I'm required to disclose if I currently own a stock I mention and/or may buy/short it within the next 72 hours.
"Technical Analysis is a windsock, not a crystal ball." - Carl Swenlin
(c) Copyright 2025 DecisionPoint.com
Watch the latest episode of DecisionPoint Trading Room with Carl Swenlin & Erin Swenlin Mondays on the DecisionPoint YouTube channel here!
NOTE: The stocks reported herein are from mechanical trading model scans that are based upon moving average relationships, momentum and volume. DecisionPoint analysis is then applied to get five selections from the scans. The selections given should prompt readers to do a chart review using their own analysis process. This letter is not a call for a specific action to buy, sell or short any of the stocks provided. There are NO sure things or guaranteed returns on the daily selection of "Diamonds in the Rough."
Regarding BUY/SELL Signals: The signal status reported herein is based upon mechanical trading model signals and crossovers. They define the implied bias of the price index/stock based upon moving average relationships and momentum, but they do not necessarily call for a specific action. They are information flags that should prompt chart review. Further, they do not call for continuous buying or selling during the life of the signal. For example, a BUY signal will probably (but not necessarily) return the best results if action is taken soon after the signal is generated. Additional opportunities for buying may be found as price zigzags higher, but the trader must look for optimum entry points. Conversely, exit points to preserve gains (or minimize losses) may be evident before the model mechanically closes the signal.
Helpful DecisionPoint Links:
Price Momentum Oscillator (PMO)
Swenlin Trading Oscillators (STO-B and STO-V)
For more links, go to DecisionPoint.com