
I decided to go with longs today as the Diamond Dog Scan wasn't that prolific. I'm pretty pleased with the results today. I have a nice long runner-ups list for you.
My one problem with many of the charts right now is that with the decline and rebound, we are seeing what could be bear flags developing on the chart. I'm optimistic that we will see upside and not downside, but it does tell me that we need to honor stops, particularly with the market being so jumpy.
I have two Energy stocks for you today. I'm still a bit leery of this area of the market as I believe Crude will continue to decline, but Energy stocks are looking good on their recent rebound. Again, honor the stops should this sector turn on us.
In included a Technology stock today even though I don't care for the sector that much. If the market is indeed going to rally further though, this will be a good area to be a part of. If the market turns on us, this stock may struggle.
The final stock is from Specialty Chemicals. Materials in general are trying to reverse right now and this stock looked interesting as a possible play on a resurgence in Materials.
Overall we need to be careful going long as the market is acting fishy with today's strong decline after rallying strongly yesterday.
Good Luck & Good Trading,
Erin
Today's "Diamonds in the Rough": GLW, INVX, NOV and VVV.
Runner-ups: FE, AL, VIRT, CVLT, PODD, CRK and RNST..

Diamond Mine Trading Room:
RECORDING & DOWNLOAD LINK (3/14/2025):
Topic: DecisionPoint Diamond Mine (3/14/2025) LIVE Trading Room
Download & Recording Link
Passcode: March#14
REGISTRATION for 3/21/2025:
When: March 21, 2025 09:00 AM Pacific Time (US and Canada)
Topic: DecisionPoint Diamond Mine LIVE Trading Room
Register in advance for this webinar HERE
After registering, you will receive a confirmation email containing information about joining the webinar.

Below is the latest free DecisionPoint Trading Room recording from 3/17. You'll find these recordings posted on Mondays to our DP YouTube Channel. Be sure and subscribe HERE.
Welcome to DecisionPoint Diamonds, wherein I highlight ten "Diamonds in the Rough" per week. These are selected from the results of my DecisionPoint Scans which search for stocks that could benefit from the trend and condition of the market. Remember, these are not recommendations to buy or sell, but are the most interesting of the stocks that surfaced in my scans. My objective is to save you the work of the initial, tedious culling process, but you need to apply your own analysis to see if these stocks pique your interest as well. There are no guaranteed winners here!
"Predefined Scans Triggered" are taken from StockCharts.com using the "Symbol Summary" option instead of a "SharpChart" on the workbench.
Stop levels are all rounded down.
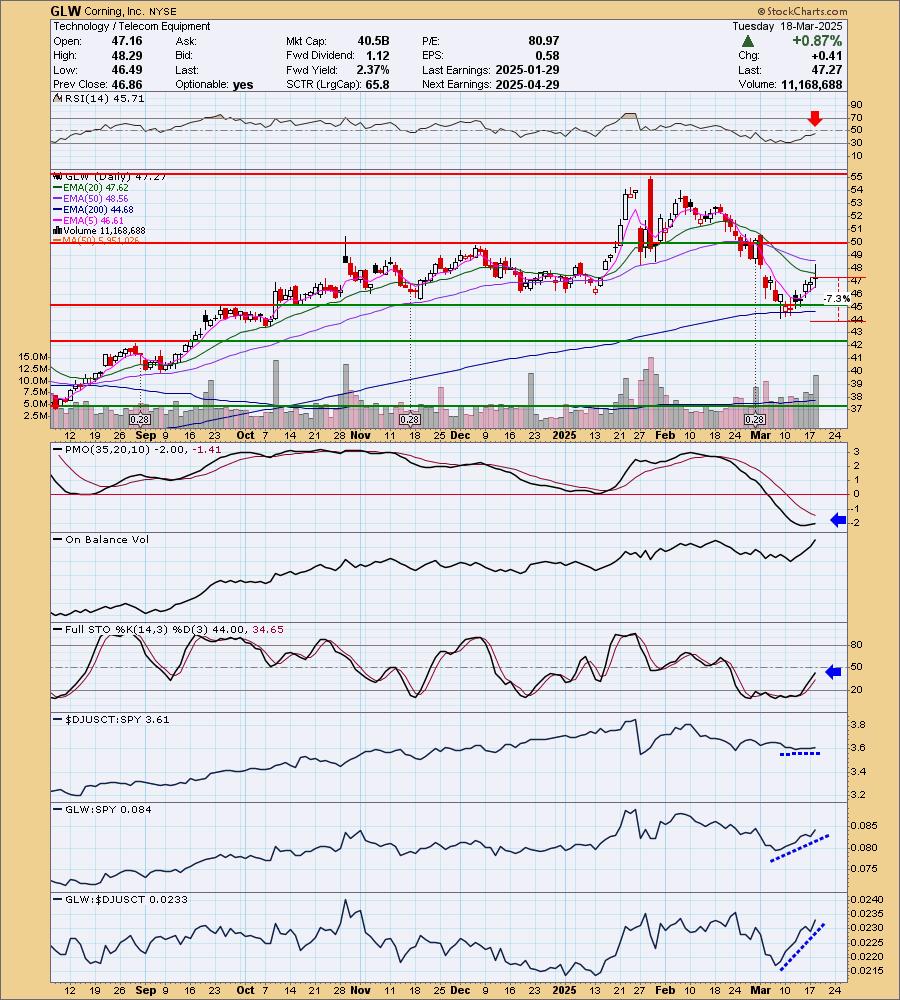
Corning, Inc. (GLW)
EARNINGS: 2025-04-29 (BMO)
Corning, Inc. engages in the provision of glass for notebook computers, flat panel desktop monitors, display televisions, and other information display applications, carrier network and enterprise network products for the telecommunications industry, ceramic substrates for gasoline and diesel engines in automotive and heavy-duty vehicle markets, laboratory products for the scientific community and polymer products for biotechnology applications, optical materials for the semiconductor industry and the scientific community, and polycrystalline silicon products and other technologies. It operates through the following segments: Optical Communications, Display Technologies, Specialty Materials, Environmental Technologies, and Life Sciences. The Optical Communications segment is classified into two main product groupings: carrier and enterprise network. The carrier network group consists of products and solutions for optical-based communications infrastructure for services such as video, data, and voice communications. The enterprise network group consists primarily of optical-based communication networks sold to businesses, governments, and individuals for their own use. The Display Technologies segment manufactures glass substrates for flat panel displays, including organic light-emitting diodes and liquid crystal displays that are used primarily in televisions, notebook computer, desktop monitors, tablets, and handheld devices. The Specialty Materials segment is involved in the manufacture of products that provide material formulations for glass, glass ceramics and crystals, and precision metrology instruments and software. The Environmental Technologies segment focuses on manufacturing ceramic substrates and filter products for emissions control in mobile applications. The Life Sciences segment develops, manufactures, and supplies laboratory products. The company was founded by Amory Houghton Sr. in 1851 and is headquartered in Corning, NY.
Predefined Scans Triggered: Elder Bar Turned Green.
GLW is up +0.15% in after hours trading. I liked this one visually based on the reversal off strong support at the September high and 200-day EMA. This looks like a solid rally. The RSI is negative, but at least that means it isn't overbought. It's also fairly close to net neutral (50). The PMO has turned up and is headed for a Crossover BUY Signal. Notice all the volume coming in on the rally. Stochastics are rising strongly. Relative strength is positive for GLW against both the group and SPY. The group itself isn't really outperforming though. It isn't a perfect chart, but it is hopefully getting us in early enough on this new rally. The stop is set beneath support at 7.3% or $43.81.
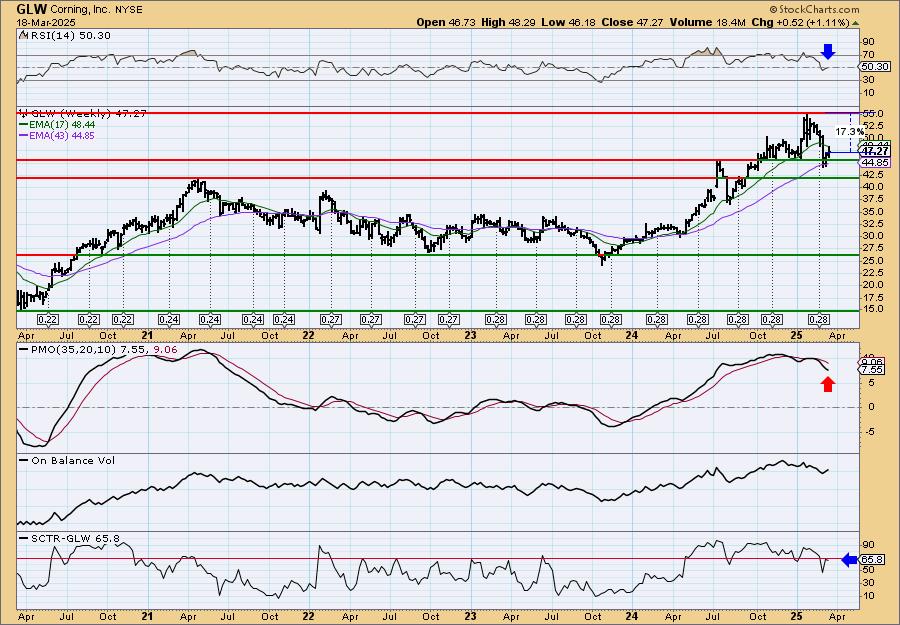
The weekly chart is improving on this rebound, but admittedly it looks a little toppy in the intermediate term and the weekly PMO is still in decline. The StockCharts Technical Rank (SCTR) isn't in the hot zone* yet, but it is very close. Keep this one in the short-term timeframe given the mediocre weekly chart.
*If a stock is in the "hot zone" above 70, it implies that it is stronger than 70% of its universe (large-, mid-, small-caps and ETFs) primarily in the intermediate to long terms.
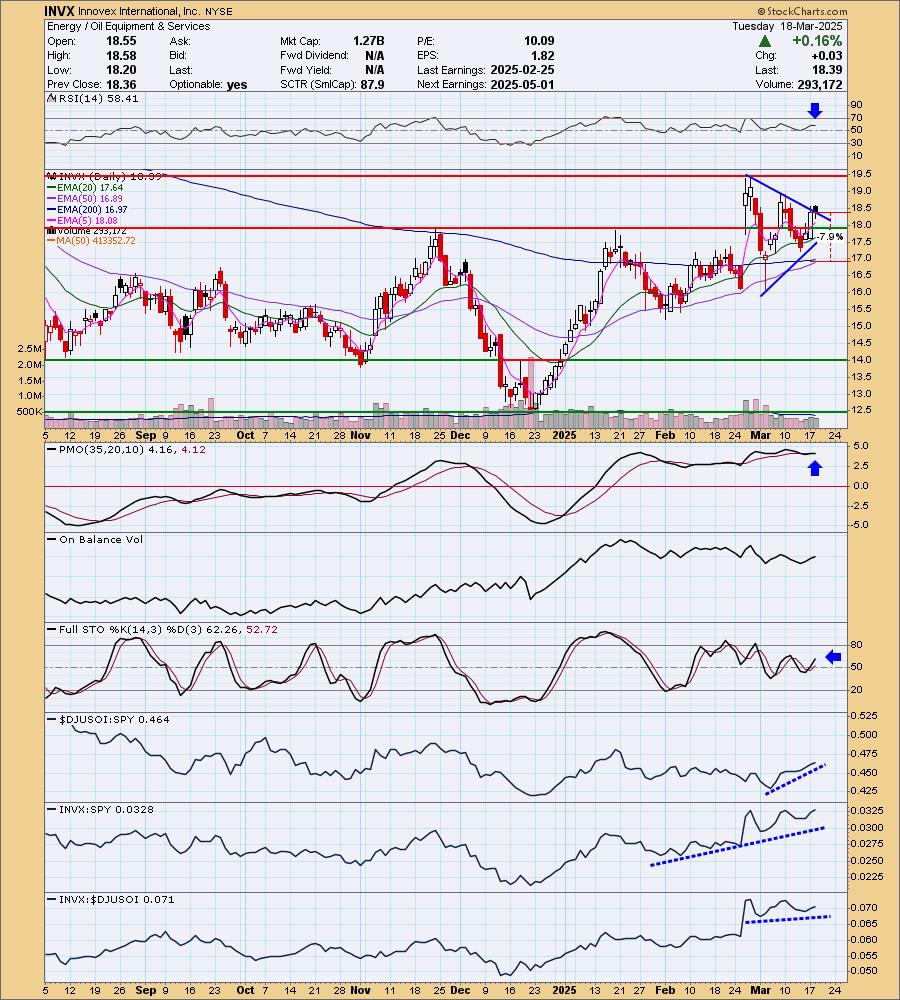
Innovex International, Inc. (INVX)
EARNINGS: 2025-05-01 (AMC)
Innovex International, Inc. engages in the provision of solutions for both onshore and offshore applications within the oil and gas industry. The company was founded on September 15, 2016 and is headquartered in Humble, TX.
Predefined Scans Triggered: Filled Black Candles.
INVX is unchanged in after hours trading. I liked the symmetrical triangle on the chart with a small breakout (unfortunately it is a filled black candlestick which implies a decline tomorrow). These are continuation patterns so the expectation is a breakout move given the prior trend was up. We have a positive RSI that isn't overbought. The PMO is on a new Crossover BUY Signal well above the zero line. Stochastics are rising in positive territory. Relative strength is very positive as all relative strength lines are rising. I also note that it is close to having a Golden Cross of the 50/200-day EMAs. The stop is set beneath the 200-day EMA at 7.9% or $16.93.
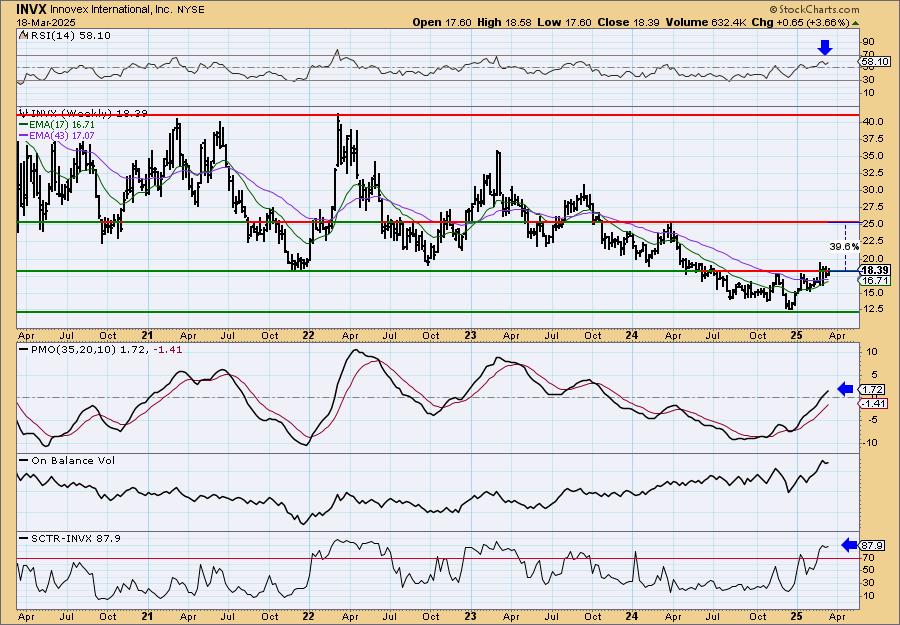
I like the weekly chart a great deal. We have a clear bottoming formation, a rounded bottom. The weekly RSI is positive and not overbought. The weekly PMO is rising above the zero line. The SCTR is in the hot zone. Upside potential is very good if it can hold a breakout.
NOV Inc (NOV)
EARNINGS: 2025-04-24 (AMC)
NOV, Inc. engages in the equipment and technology to the upstream oil and gas industry. It operates through the Energy Products and Services, and Energy Equipment segments. The Energy Products and Services segment provides the critical tools, equipment, and services to safely maximize efficiency, reliability, and economics in the upstream oil and gas, renewables, and industrial markets. The Energy Equipment segment designs, builds, and supports capital equipment and integrated systems used in oil and gas exploration and production. The company was founded in 1862 and is headquartered in Houston, TX.
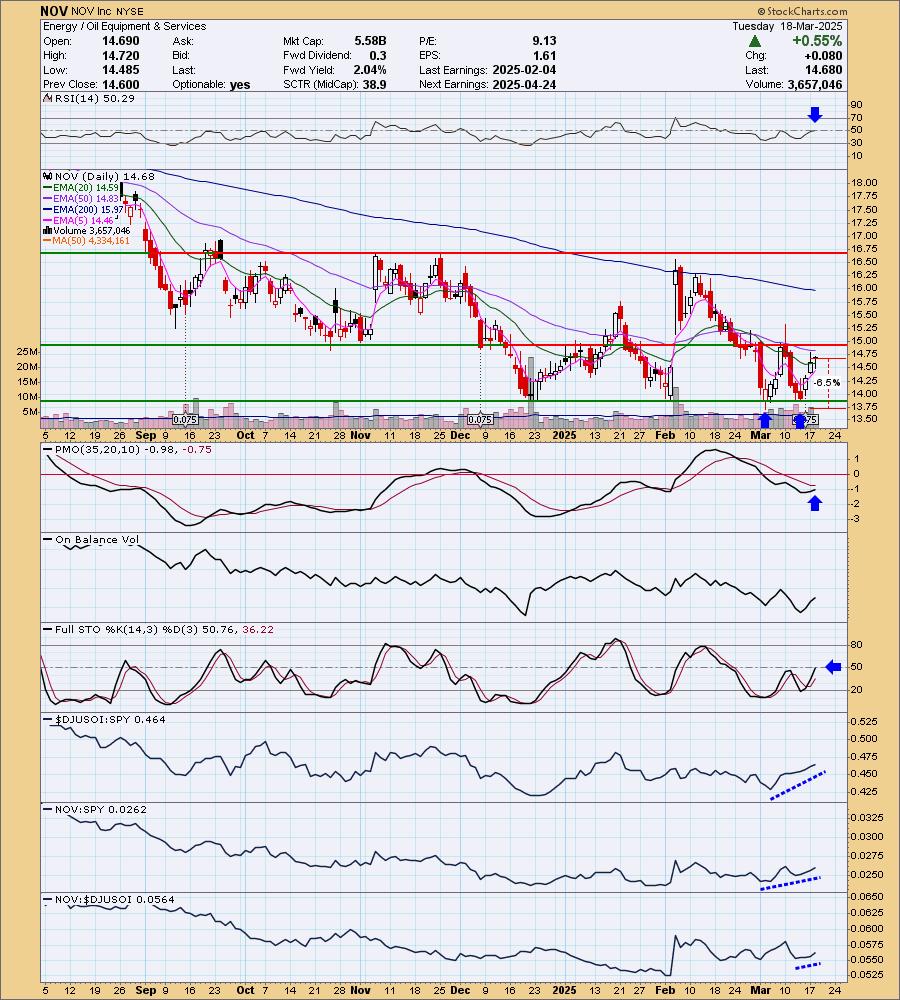
Predefined Scans Triggered: Bullish MACD Crossovers.
NOV is unchanged in after hours trading. This one caught my eye because of the bullish double bottom that has formed. It will need a breakout for confirmation, but this looks good coming off strong support. The RSI just moved into positive territory. The PMO is rising toward a Crossover BUY Signal. Stochastics just moved above net neutral (50) and relative strength looks good for both the group and NOV which is outperforming the group now. The stop doesn't have to be that deep. It is set beneath the bottoms as a breakdown there would bust the bullish chart pattern. The stop is 6.5% or $13.72.
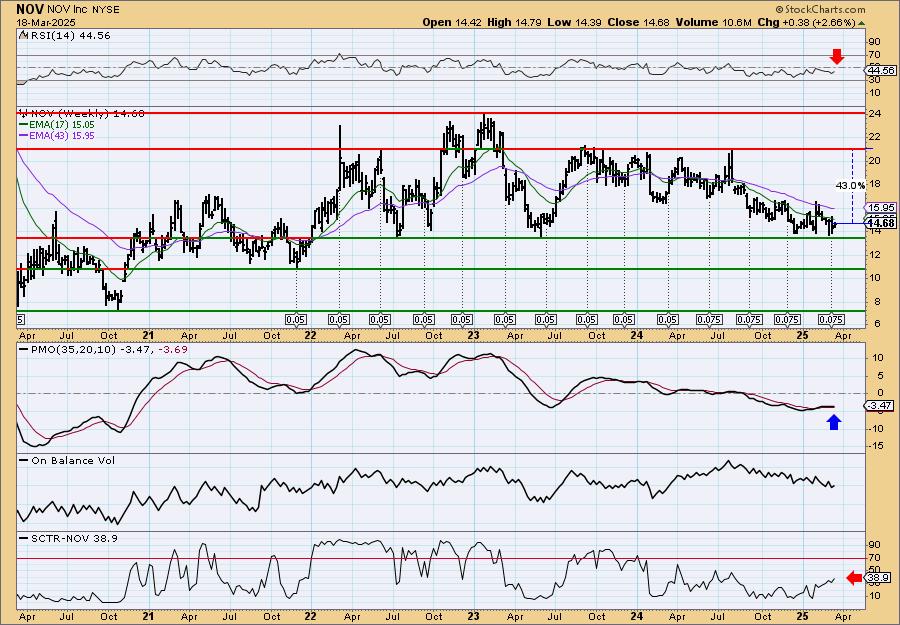
There is still a declining trend on the weekly chart, but price has halted on support. The weekly RSI is not positive and the SCTR is not in the hot zone so we need to watch this one closely. The weekly PMO is on a Crossover BUY Signal.
Valvoline Inc. (VVV)
EARNINGS: 2025-05-07 (BMO)
Valvoline, Inc. engages in the production, marketing, and supply of engine and automotive maintenance products and services. It operates through the Retail Services segment. The Retail Services segment services the passenger car and light truck quick lube market in the US and Canada with preventive maintenance services done through company operated and independent franchise care stores. The company was founded by John Ellis in 1866 and is headquartered in Lexington, KY.
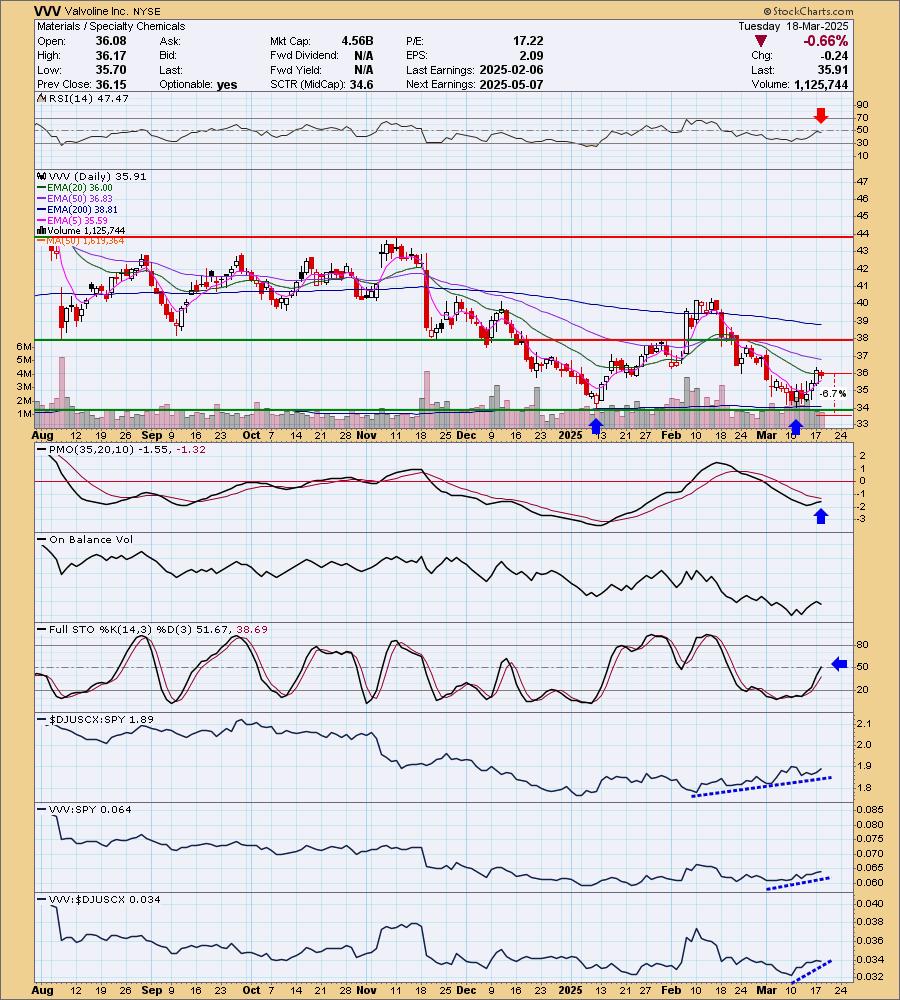
Predefined Scans Triggered: Bullish MACD Crossovers.
VVV is down -0.97% in after hours trading. I really like the double bottom that is forming on VVV. It is far from being confirmed (it needs a breakout above the February top) but this is a good start. The RSI is not positive currently. The PMO looks very good as it rises to a Crossover BUY Signal. Stochastics just moved above net neutral (50). Relative strength is going well for the group and VVV is outperforming the group and the SPY currently. The stop doesn't have to be deep, I chose 6.7% or $33.50 which would essentially bust the possible double bottom pattern.
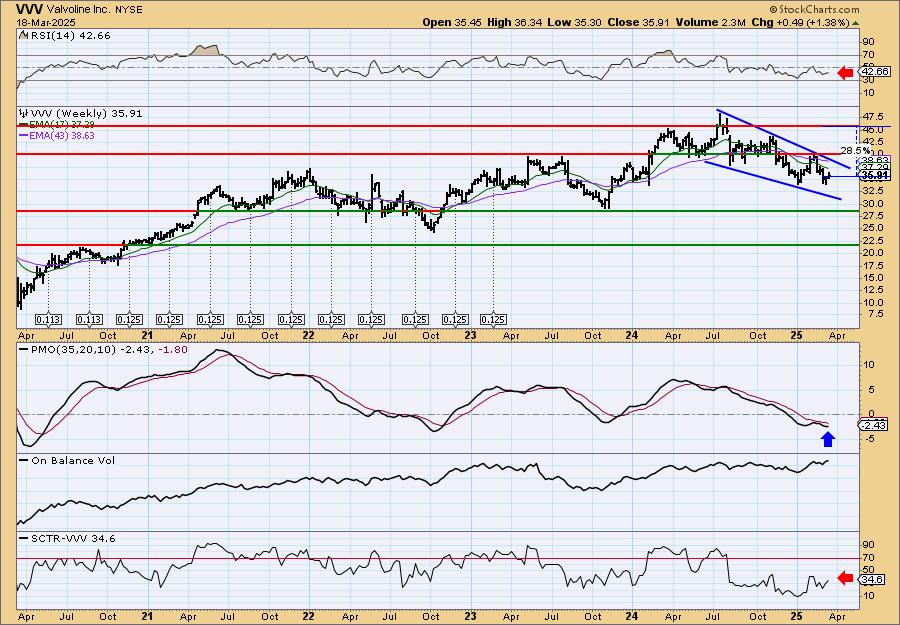
I also like the bullish falling wedge on the weekly chart that implies we'll see an upside breakout. Notice that price didn't have to go all the way down to the bottom of the pattern before reversing. That is a good omen. The weekly RSI is negative as we do have a declining trend in place. The weekly PMO is trying to turn back up. The SCTR needs some help. Keep this short-term for now. If we get the breakout you could hold it longer.
Don't forget, on Thursdays I look at reader-requested symbols, click HERE to send me an email. I read every email I receive and try to answer them all!
Current Market Outlook:
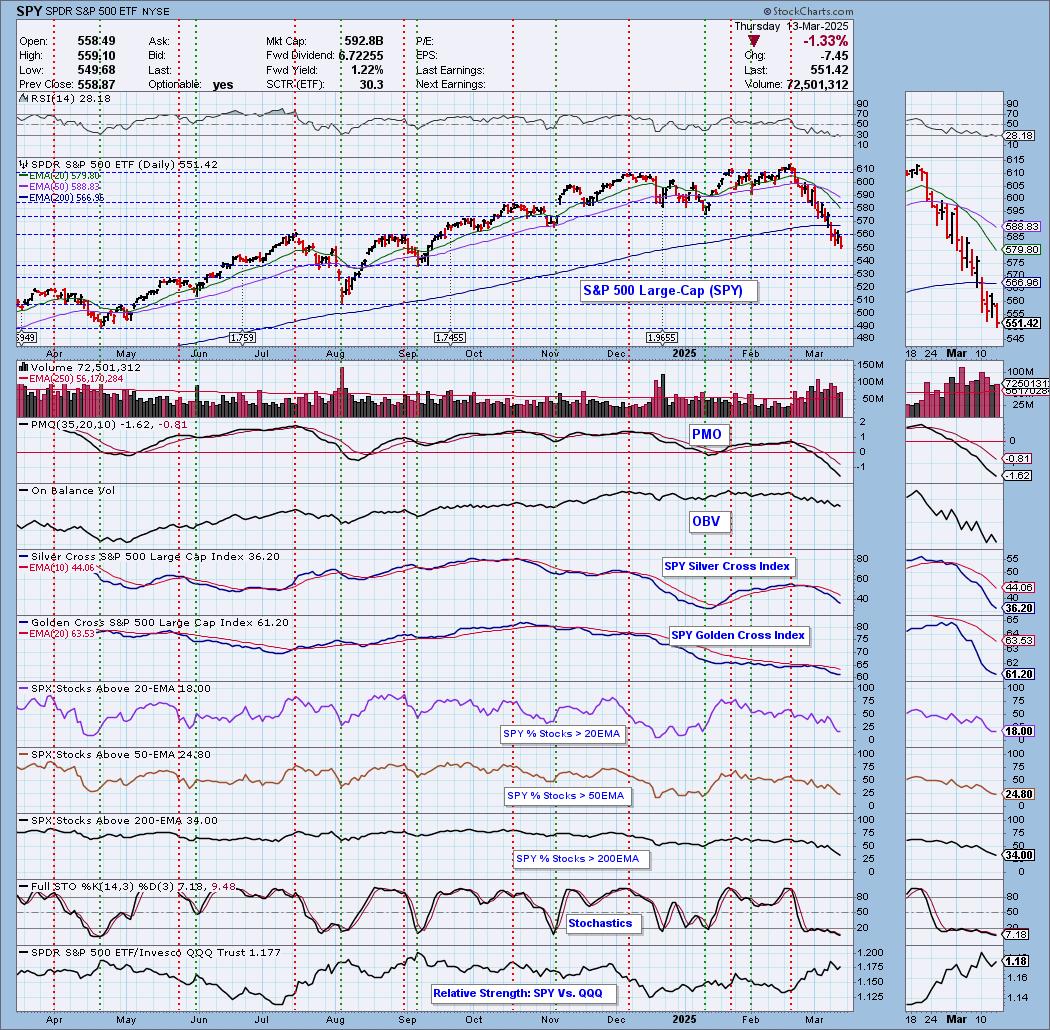
Market Environment: It is important to consider the odds for success by assessing the market tides. The following chart uses different methodologies for objectively showing the depth and trend of participation for intermediate- and long-term time frames.
- The Silver Cross Index (SCI) shows the percentage of SPX stocks on IT Trend Model BUY signals (20-EMA > 50-EMA)
- The Golden Cross Index (GCI) shows the percentage of SPX stocks on LT Trend Model BUY signals (50-EMA > 200-EMA)
Don't forget that as a "Diamonds" member, you have access to our "Under the Hood" curated ChartList on DecisionPoint.com. You'll find it under "Members Only" links on the left side on the Blogs and Links Page.
Here is the current chart:
Full Disclosure: I am 20% long, 0% short.
I'm required to disclose if I currently own a stock I mention and/or may buy/short it within the next 72 hours.
"Technical Analysis is a windsock, not a crystal ball." - Carl Swenlin
(c) Copyright 2025 DecisionPoint.com
Watch the latest episode of DecisionPoint Trading Room with Carl Swenlin & Erin Swenlin Mondays on the DecisionPoint YouTube channel here!
NOTE: The stocks reported herein are from mechanical trading model scans that are based upon moving average relationships, momentum and volume. DecisionPoint analysis is then applied to get five selections from the scans. The selections given should prompt readers to do a chart review using their own analysis process. This letter is not a call for a specific action to buy, sell or short any of the stocks provided. There are NO sure things or guaranteed returns on the daily selection of "Diamonds in the Rough."
Regarding BUY/SELL Signals: The signal status reported herein is based upon mechanical trading model signals and crossovers. They define the implied bias of the price index/stock based upon moving average relationships and momentum, but they do not necessarily call for a specific action. They are information flags that should prompt chart review. Further, they do not call for continuous buying or selling during the life of the signal. For example, a BUY signal will probably (but not necessarily) return the best results if action is taken soon after the signal is generated. Additional opportunities for buying may be found as price zigzags higher, but the trader must look for optimum entry points. Conversely, exit points to preserve gains (or minimize losses) may be evident before the model mechanically closes the signal.
Helpful DecisionPoint Links:
Price Momentum Oscillator (PMO)
Swenlin Trading Oscillators (STO-B and STO-V)
For more links, go to DecisionPoint.com