
The scans were more prolific than they usually are, but ultimately the selections I made came from my simple PMO Crossover Scan. I have listed plenty of symbols for your review.
Some of the themes were growth and value ETFs, international ETFs and Commodities ETFs. I am presenting an international ETF. It is a slow mover it appears, but looks good moving forward with a small stop.
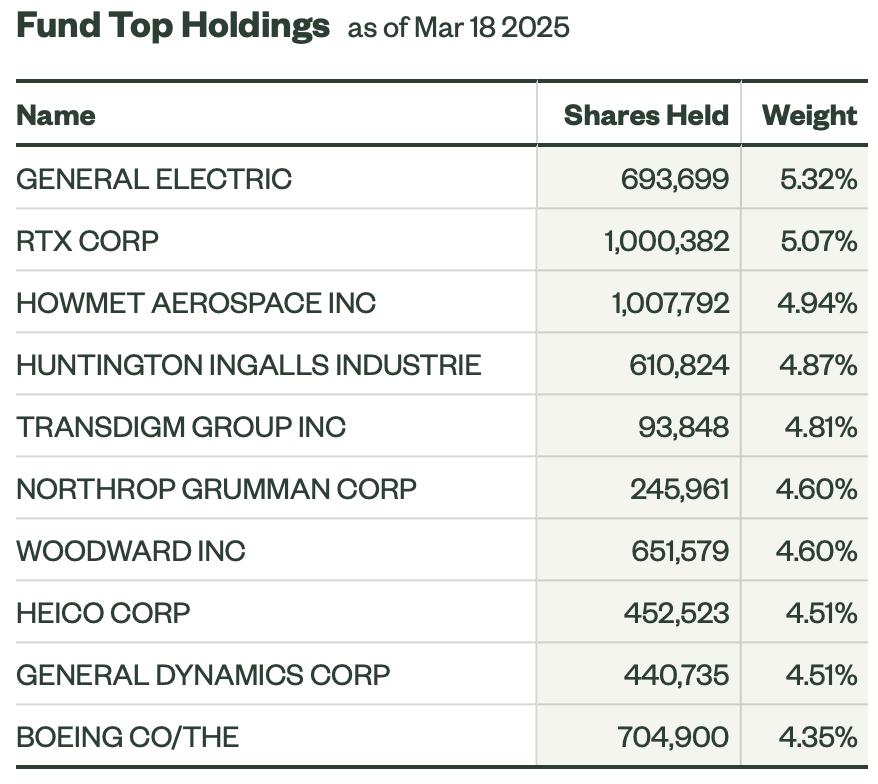
I opted not to present the commodities ETFs as I'm not completely on board this Crude Oil rally. My sense is that it will turn back down soon. I decided to let you figure out which growth or value ETFs you'd like. The majority look good. Mainly I wanted to include the Aerospace and Defense ETF (XAR) as I still like that area of the market.
The final selection is a nuclear and uranium ETF (NLR) which has some great upside potential on a nice reversal.
Good Luck & Good Trading,
Erin
Today's "Diamonds in the Rough": BKIE, NLR and XAR.
Runner-ups: HIPS, IWX, DBA, BUG, IYF, ROBO, MDYV, RYLD, AIQ, COWG, PAVE, KBE, JIRE, VIGI, BCI and PDBC. (Have fun!)

Diamond Mine Trading Room:
RECORDING & DOWNLOAD LINK (3/14/2025):
Topic: DecisionPoint Diamond Mine (3/14/2025) LIVE Trading Room
Download & Recording Link
Passcode: March#14
REGISTRATION for 3/21/2025:
When: March 21, 2025 09:00 AM Pacific Time (US and Canada)
Topic: DecisionPoint Diamond Mine LIVE Trading Room
Register in advance for this webinar HERE
After registering, you will receive a confirmation email containing information about joining the webinar.

Below is the latest free DecisionPoint Trading Room recording from 3/17. You'll find these recordings posted on Mondays to our DP YouTube Channel. Be sure and subscribe HERE.
Welcome to DecisionPoint Diamonds, wherein I highlight ten "Diamonds in the Rough" per week. These are selected from the results of my DecisionPoint Scans which search for stocks that could benefit from the trend and condition of the market. Remember, these are not recommendations to buy or sell, but are the most interesting of the stocks that surfaced in my scans. My objective is to save you the work of the initial, tedious culling process, but you need to apply your own analysis to see if these stocks pique your interest as well. There are no guaranteed winners here!
"Predefined Scans Triggered" are taken from StockCharts.com using the "Symbol Summary" option instead of a "SharpChart" on the workbench.
Stop levels are all rounded down.
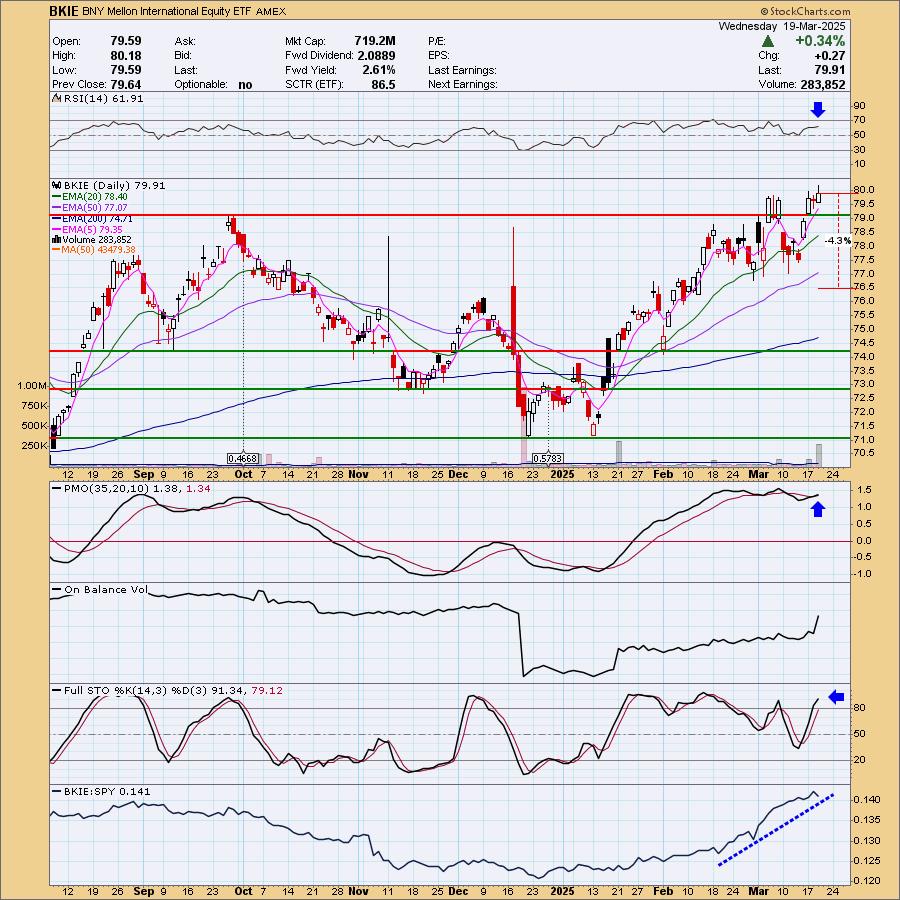
BNY Mellon International Equity ETF (BKIE)
EARNINGS: N/A
BKIE tracks a market cap-weighted index of large- and mid-cap companies from developed markets, excluding the US. Click HERE for more information.
Predefined Scans Triggered: New 52-week Highs, P&F Double Top Breakout, P&F Triple Top Breakout and Strong Volume Gainers.
BKIE is up +0.34% in after hours trading. I liked the strong rising trend combined with a breakout to new 52-week highs. The PMO is flat above the zero line indicating pure strength. This new Crossover BUY Signal is taking place well above the zero line. The RSI is not overbought and Stochastics are rising above 80. Relative strength is excellent! It moves a bit slow so we don't need to have a very deep stop. I set it below support at 4.3% or $76.47.
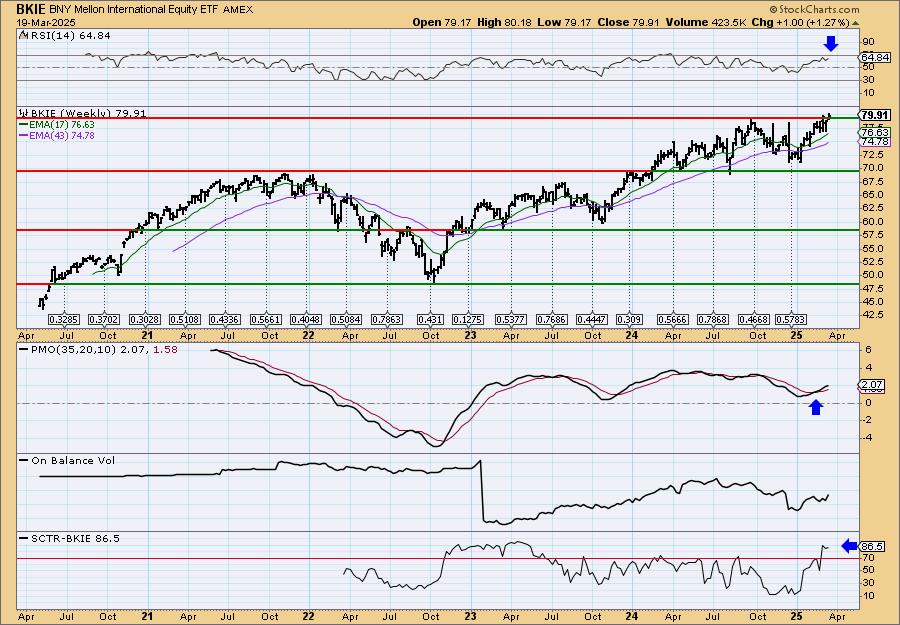
It's a tiny breakout, but a breakout nonetheless. We have a positive and not overbought weekly RSI and the weekly PMO is rising above the zero line on a Crossover BUY Signal. The StockCharts Technical Rank (SCTR) is well within the hot zone* above 70. Consider a 17% upside target to $93.49.
*If a stock is in the "hot zone" above 70, it implies that it is stronger than 70% of its universe (large-, mid-, small-caps and ETFs) primarily in the intermediate to long terms.
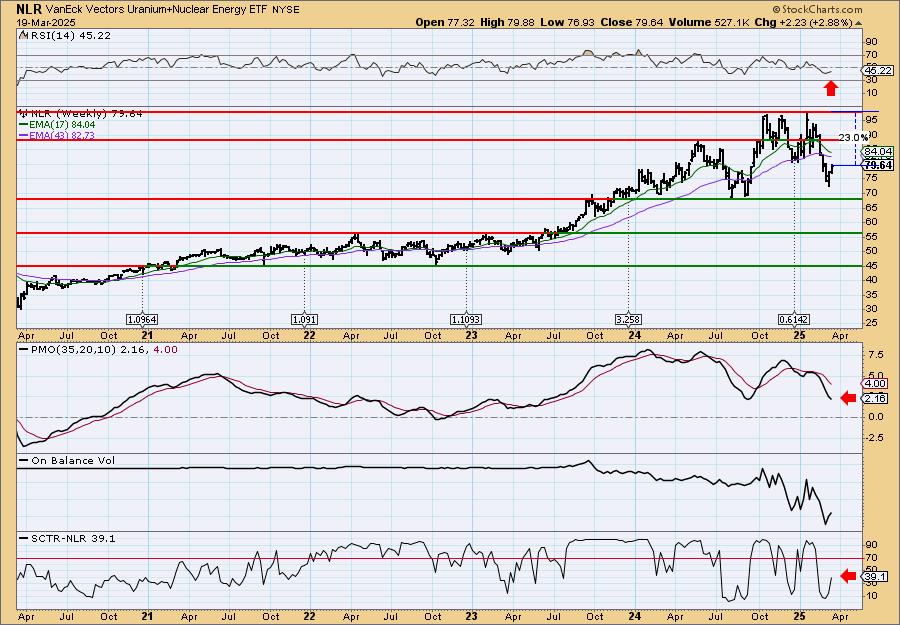
VanEck Vectors Uranium+Nuclear Energy ETF (NLR)
EARNINGS: N/A
NLR tracks a market-cap-weighted index of companies in the global nuclear energy industry. Click HERE for more information.
Predefined Scans Triggered: Elder Bar Turned Green, P&F Bearish Signal Reversal and P&F Double Top Breakout.
NLR is up +0.45% in after hours trading. It was beaten up but it is now reversing strongly. It isn't a perfect chart, but I'm counting on this upside reversal to carry on. This would be considered a reversal candidate given price is below the 200-day EMA. The RSI is not yet positive, but it is rising nicely and should get above net neutral (50) momentarily. The PMO is on a new Crossover BUY Signal. Stochastics are rising strongly and should get above 80 soon. Relative strength is improving. I also like the OBV positive divergence with price lows that started the rally. The stop is set as close to support as possible at 7.9% or $73.34.
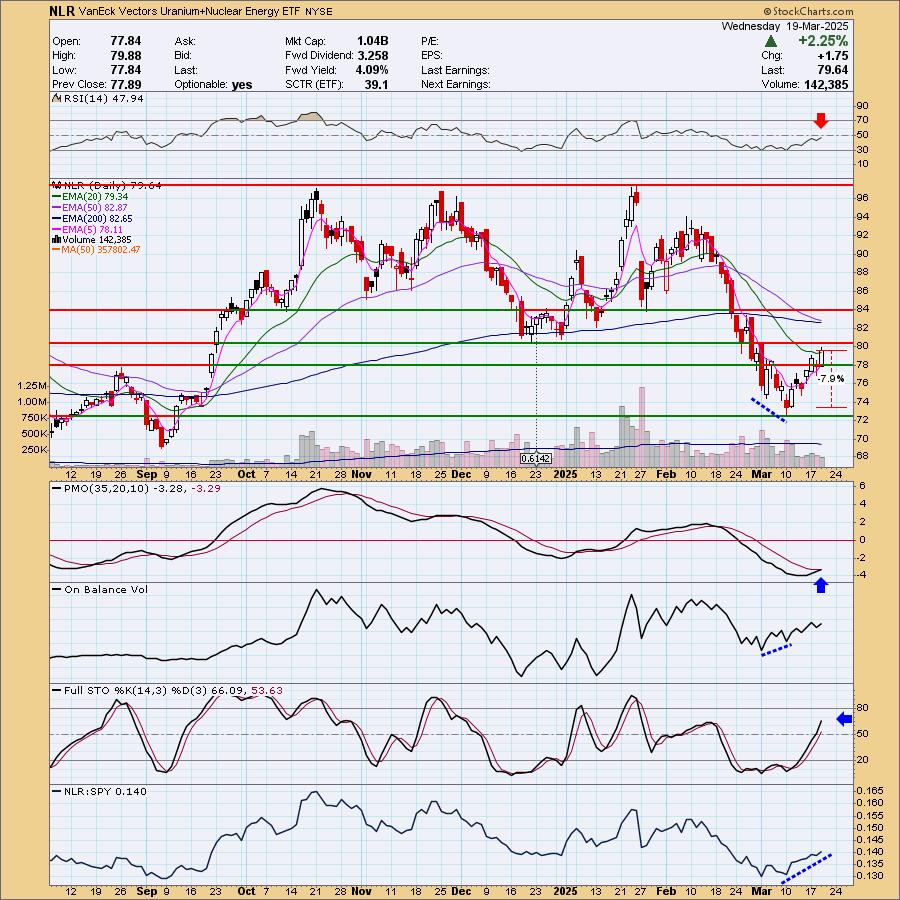
Price is reversing before having to test support which is a good sign. The weekly RSI is still negative and the weekly PMO is in decline given the previous price drop. The SCTR is rising, but isn't in the hot zone yet. Keep this one in the short-term timeframe until this chart ripens.
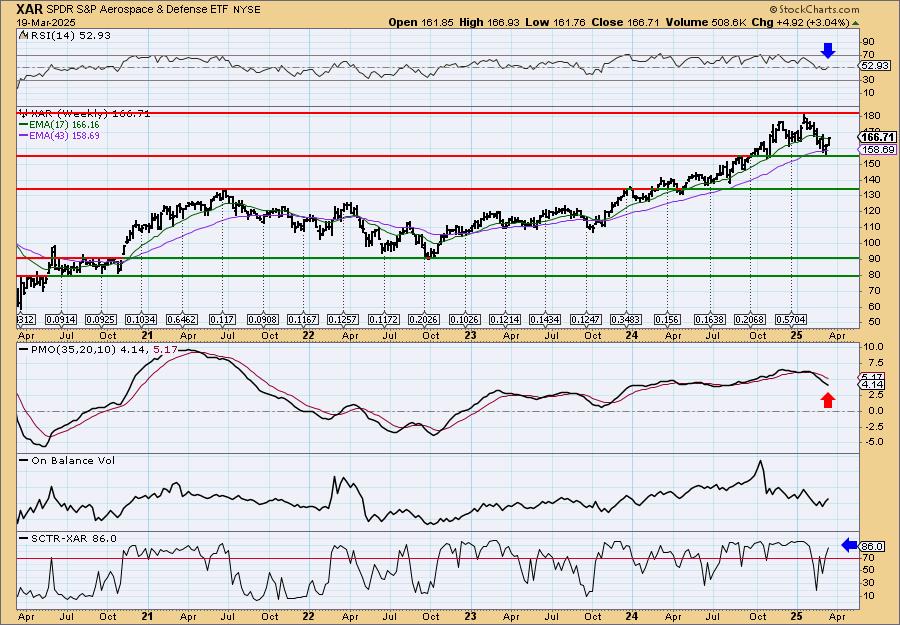
SPDR S&P Aerospace & Defense ETF (XAR)
EARNINGS: N/A
XAR tracks an equal-weighted index of US aerospace & defense companies. Click HERE for more information.
Predefined Scans Triggered: New CCI Buy Signals.
XAR is down -1.87% in after hours trading so it is giving back some of today's gains. It would give us a better entry. I like this space as we did see a little extra defense spending in Friday's non-shutdown bill. Geopolitical uncertainty is likely to lead it higher from here. I liked the breakout from the declining tops trendline. The RSI is now positive and there is a new PMO Crossover BUY Signal. Stochastics are rising strongly toward 80. We see very good outperformance against the SPY. The stop is set beneath support at 7% or $155.04.
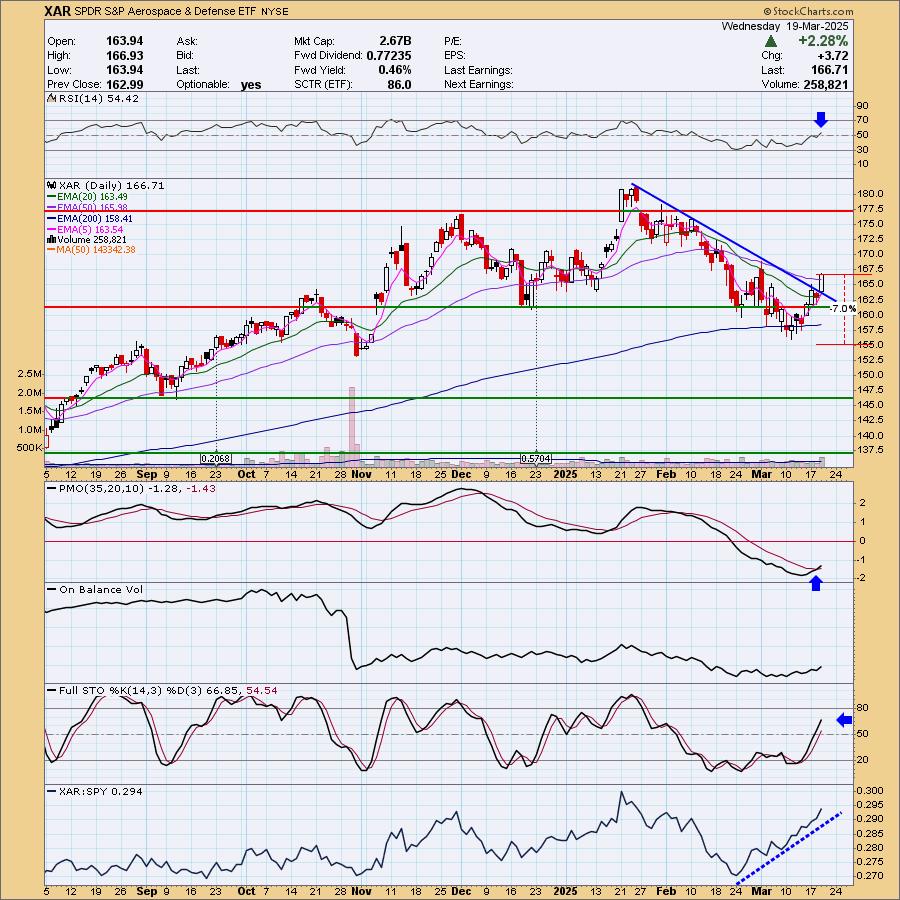
There are some problems here. The first being a possible bearish double top. The weekly PMO is still in decline as well. But the chart also has some merit as the weekly RSI is positive again and the SCTR is in the hot zone. Consider a 17% upside target to about $195.05.
Don't forget, on Thursdays I look at reader-requested symbols, click HERE to send me an email. I read every email I receive and try to answer them all!
Current Market Outlook:
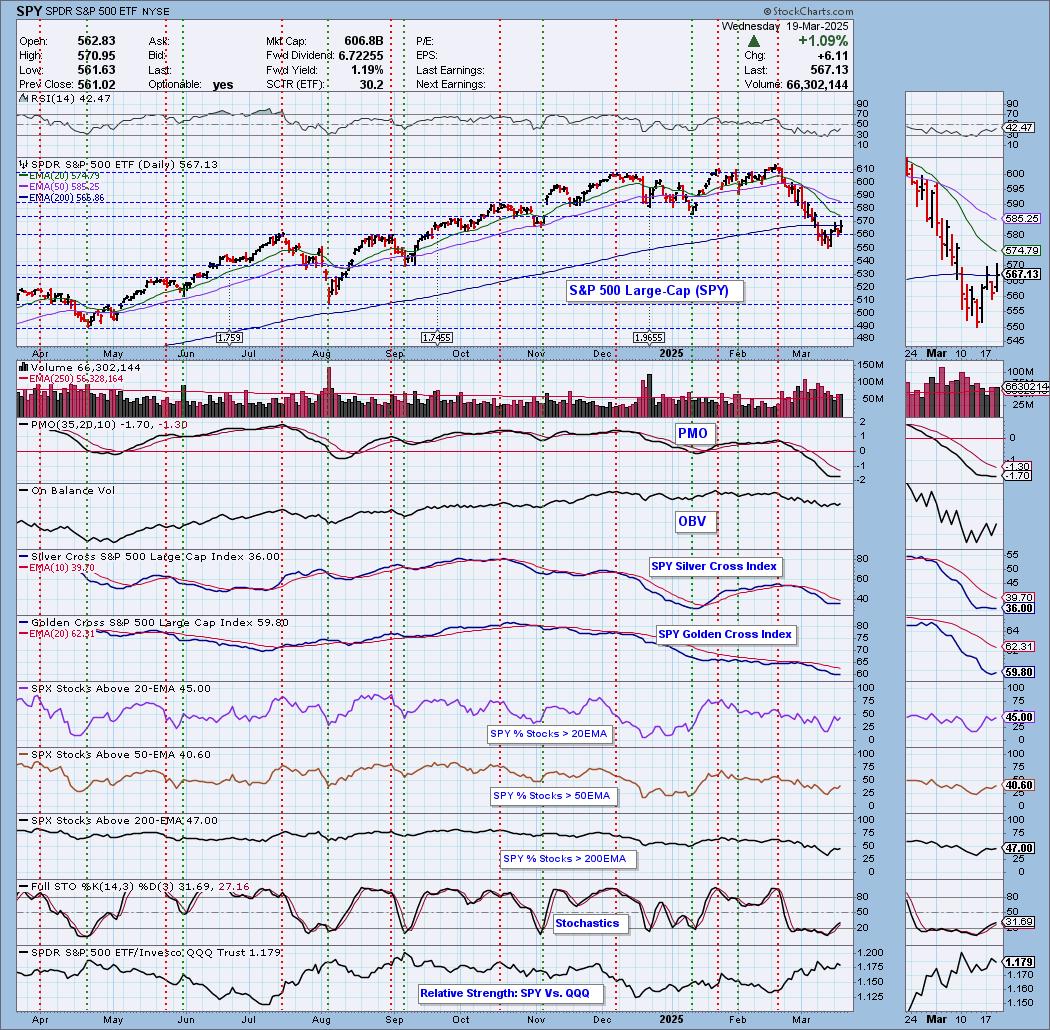
Market Environment: It is important to consider the odds for success by assessing the market tides. The following chart uses different methodologies for objectively showing the depth and trend of participation for intermediate- and long-term time frames.
- The Silver Cross Index (SCI) shows the percentage of SPX stocks on IT Trend Model BUY signals (20-EMA > 50-EMA)
- The Golden Cross Index (GCI) shows the percentage of SPX stocks on LT Trend Model BUY signals (50-EMA > 200-EMA)
Don't forget that as a "Diamonds" member, you have access to our "Under the Hood" curated ChartList on DecisionPoint.com. You'll find it under "Members Only" links on the left side on the Blogs and Links Page.
Here is the current chart:
Full Disclosure: I am 20% long, 0% short.
I'm required to disclose if I currently own a stock I mention and/or may buy/short it within the next 72 hours.
"Technical Analysis is a windsock, not a crystal ball." - Carl Swenlin
(c) Copyright 2025 DecisionPoint.com
Watch the latest episode of DecisionPoint Trading Room with Carl Swenlin & Erin Swenlin Mondays on the DecisionPoint YouTube channel here!
NOTE: The stocks reported herein are from mechanical trading model scans that are based upon moving average relationships, momentum and volume. DecisionPoint analysis is then applied to get five selections from the scans. The selections given should prompt readers to do a chart review using their own analysis process. This letter is not a call for a specific action to buy, sell or short any of the stocks provided. There are NO sure things or guaranteed returns on the daily selection of "Diamonds in the Rough."
Regarding BUY/SELL Signals: The signal status reported herein is based upon mechanical trading model signals and crossovers. They define the implied bias of the price index/stock based upon moving average relationships and momentum, but they do not necessarily call for a specific action. They are information flags that should prompt chart review. Further, they do not call for continuous buying or selling during the life of the signal. For example, a BUY signal will probably (but not necessarily) return the best results if action is taken soon after the signal is generated. Additional opportunities for buying may be found as price zigzags higher, but the trader must look for optimum entry points. Conversely, exit points to preserve gains (or minimize losses) may be evident before the model mechanically closes the signal.
Helpful DecisionPoint Links:
Price Momentum Oscillator (PMO)
Swenlin Trading Oscillators (STO-B and STO-V)
For more links, go to DecisionPoint.com