
I think I'll keep Reader Request Day around, but this week saw only one subscriber turn in symbols. Rather than cover them all (which I could, they look pretty good), I ran the Diamond PMO Scan and found some candidates to add. We will have one from Fred (our trusty moderator in the trading rooms!) and two from me.
I actually included a Technology stock even though I am timid about that sector right now. Fred brought a REIT to the table and the final choice is a Financial that should do well as that is a sector that I like right now.
Tomorrow is the Diamond Mine trading room! Registration instructions are below. Hope to see you there!
Good Luck & Good Trading,
Erin
Today's "Diamonds in the Rough": BHF, BXMT and VIAV.
Runner-ups: ARLP, EWJ and TDS.

Diamond Mine Trading Room:
RECORDING & DOWNLOAD LINK (3/14/2025):
Topic: DecisionPoint Diamond Mine (3/14/2025) LIVE Trading Room
Download & Recording Link
Passcode: March#14
REGISTRATION for 3/21/2025:
When: March 21, 2025 09:00 AM Pacific Time (US and Canada)
Topic: DecisionPoint Diamond Mine LIVE Trading Room
Register in advance for this webinar HERE
After registering, you will receive a confirmation email containing information about joining the webinar.

Below is the latest free DecisionPoint Trading Room recording from 3/17. You'll find these recordings posted on Mondays to our DP YouTube Channel. Be sure and subscribe HERE.
Welcome to DecisionPoint Diamonds, wherein I highlight ten "Diamonds in the Rough" per week. These are selected from the results of my DecisionPoint Scans which search for stocks that could benefit from the trend and condition of the market. Remember, these are not recommendations to buy or sell, but are the most interesting of the stocks that surfaced in my scans. My objective is to save you the work of the initial, tedious culling process, but you need to apply your own analysis to see if these stocks pique your interest as well. There are no guaranteed winners here!
"Predefined Scans Triggered" are taken from StockCharts.com using the "Symbol Summary" option instead of a "SharpChart" on the workbench.
Stop levels are all rounded down.
Brighthouse Financial, Inc. (BHF)
EARNINGS: 2025-05-07 (AMC)
Brighthouse Financial, Inc. operates as a holding company, which engages in the provision of life insurance and annuities through independent distribution channels and marketing arrangements with a diverse network of distribution partners. It operates through the following segments: Annuities, Life, Run-Off, and Corporate & Others. The Annuities segment product offerings include fixed, structured, income and variable annuities. The Life segment manufactures products to serve its target segments through a broad independent distribution network. The Run-Off segment includes structured settlements, pension risk transfer contracts, certain company-owned life insurance policies, funding agreements and universal life with secondary guarantees. The Corporate & Other segment refers to the general account investments and the separate account assets of the company. The company was founded in June 1863 and is headquartered in Charlotte, NC.
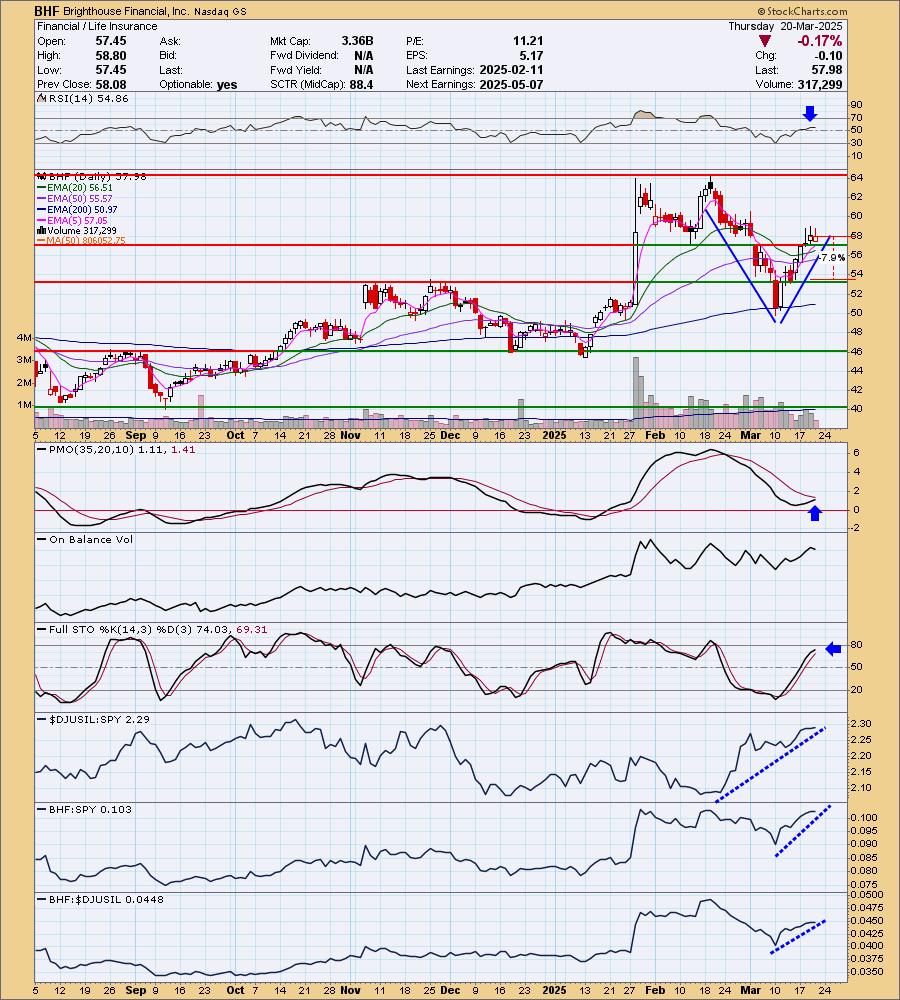
Predefined Scans Triggered: Hollow Red Candles and P&F Double Top Breakout.
BHF is unchanged in after hours trading. I liked the 'V' Bottom chart pattern on the chart. When price retraces up 1/3rd of the pattern we should expect a breakout from the left side of the 'V'. The RSI is positive and not at all overbought yet. The PMO is going in for a Crossover BUY Signal above the zero line. Stochastics are rising toward 80. Relative strength lines are all trending up so the group is outperforming the SPY and BHF is outperforming the group and the SPY. The stop is set as close to support as possible. I chose 7.9% or $53.39.
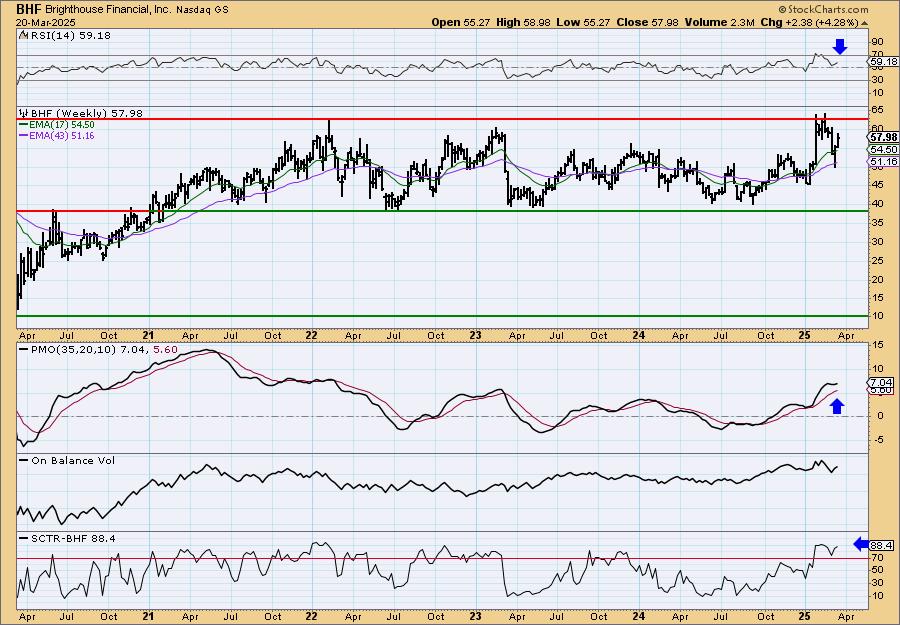
I really would like to see a breakout from this long-term trading range. According the indicators, we should get it. The weekly RSI is positive and not overbought. The weekly PMO is surging above the signal line. The StockCharts Technical Rank (SCTR) is well within the hot zone* above 70. Consider a 17% upside target to about $67.84.
*If a stock is in the "hot zone" above 70, it implies that it is stronger than 70% of its universe (large-, mid-, small-caps and ETFs) primarily in the intermediate to long terms.
Blackstone Mortgage Trust, Inc. (BXMT)
EARNINGS: 2025-04-23 (BMO)
Blackstone Mortgage Trust, Inc. is a real estate finance company, which engages in originating senior loans collateralized by commercial real estate. The company was founded by Samuel Zell, John R. Klopp, and Craig M. Hatkoff in July 1997 and is headquartered in New York, NY.
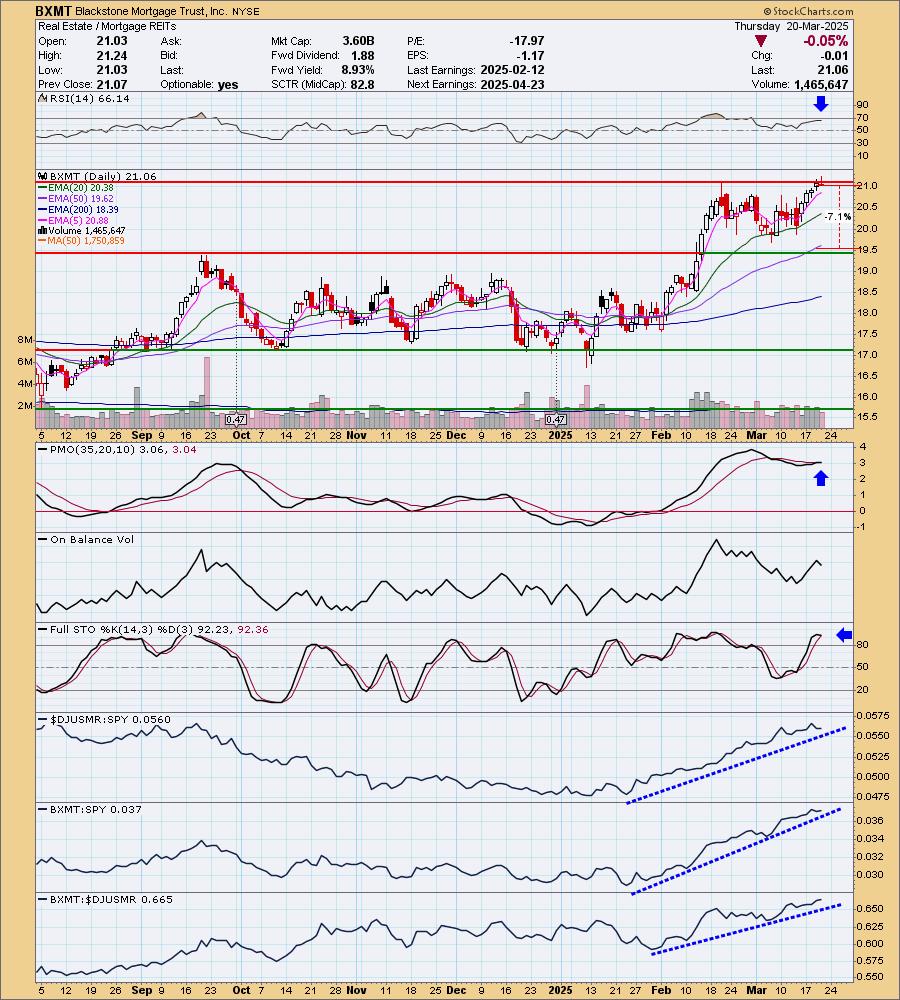
Predefined Scans Triggered: P&F Ascending Triple Top Breakout, P&F Double Top Breakout, New 52-week Highs and Hollow Red Candles.
BXMT is down -0.14% in after hours trading. This one has technically broken out, but I'd like to see more confirmation. Still this is a good set up as you could make a case for a bull flag formation. What I also liked was the new PMO Crossover BUY Signal occurring so far above the zero line. I'd say that is a sign of pure strength. We have a bullish hollow red candlestick. The RSI is not overbought and Stochastics are holding above 80. This one has a big yield of 8.93%, but I would caution as the P/E is negative. I also liked the strongly rising relative strength lines. The other two requests, ARLP and EWJ also look very good. It was hard to decide so I let the breakout lead the way. The stop is set beneath support at 7.1% or $19.56.
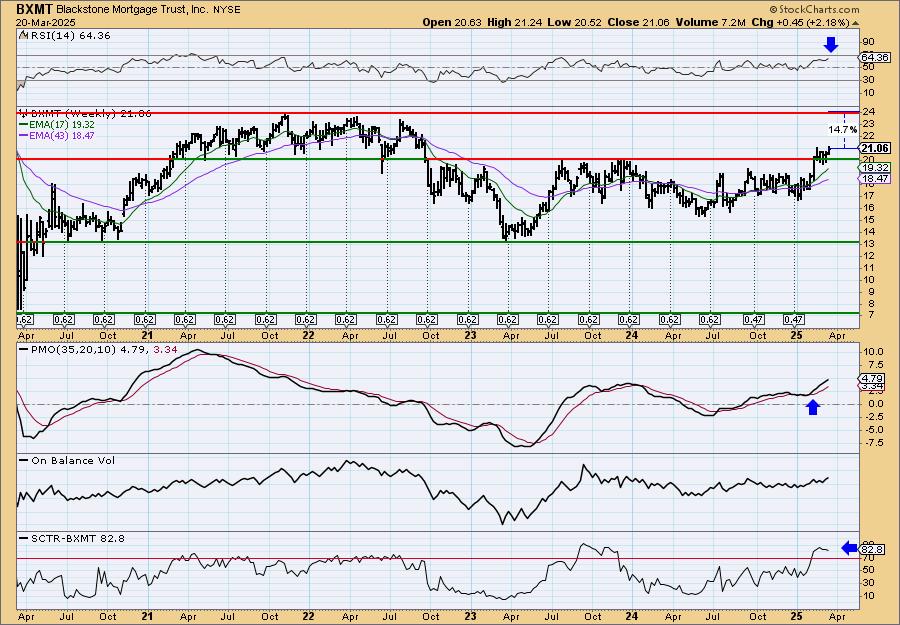
Here is another reason to like BXMT. We have a breakout above a long-term trading range. The weekly RSI is positive and not overbought. The weekly PMO is rising on a Crossover BUY Signal above the zero line. The SCTR is also in the hot zone. I think we can look for 17% upside target to about $24.64.
Viavi Solutions Inc. (VIAV)
EARNINGS: 2025-05-01 (AMC)
Viavi Solutions, Inc. engages in the provision of network test, monitoring, and assurance solutions for communications service providers, enterprises, network equipment manufacturers, government and avionics. It operates through the following segments: Network Enablement, Service Enablement, and Optical Security and Performance. The Network Enablement segment offers an integrated portfolio of testing solutions that access the network to perform build-out and maintenance tasks. The Service Enablement segment covers solutions and services primarily for communication service providers, and enterprises that deliver and/or operate broadband and IP networks (fixed and mobile) supporting voice, video, and data services as well as a wide range of applications. The Optical Security and Performance segment leverages its core optical coating technologies and volume manufacturing capability to design, manufacture, and sell products targeting anti-counterfeiting, consumer and industrial, government, healthcare, and other markets. The company was founded in 1979 and is headquartered in Chandler, AZ.
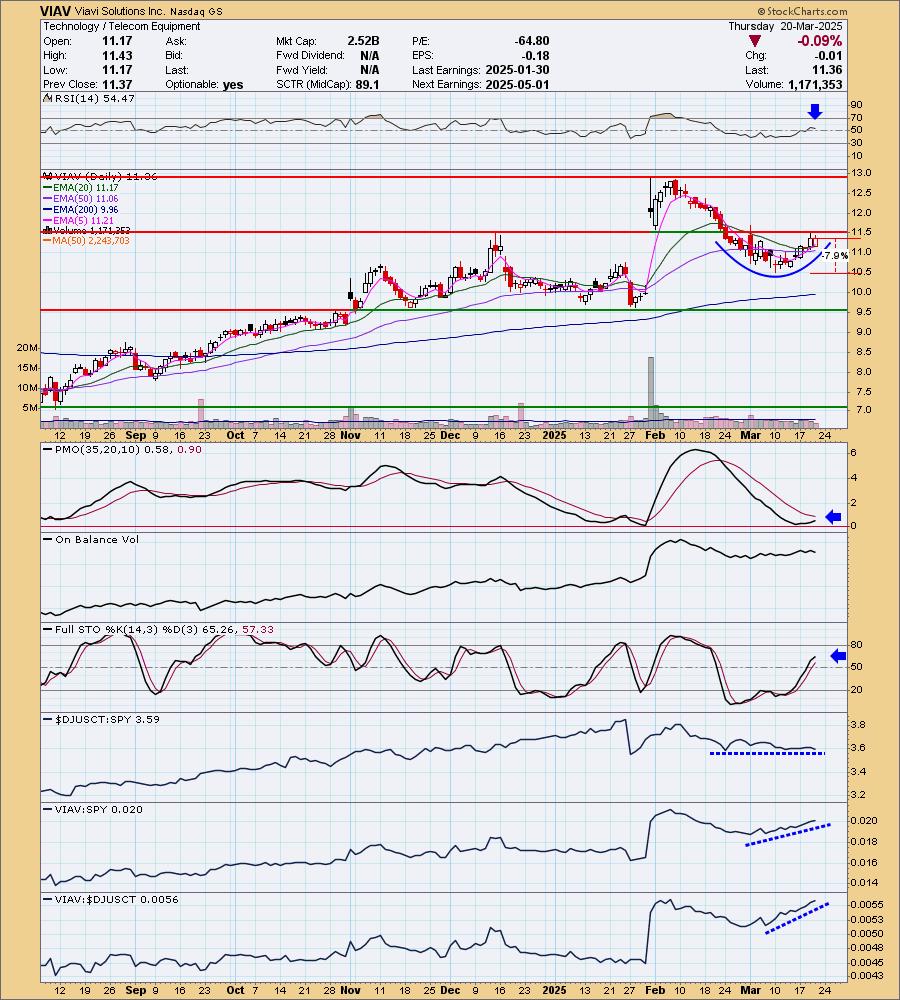
Predefined Scans Triggered: Hollow Red Candles.
VIAV is unchanged in after hours trading. The rounded bottom and upside potential got me on this one. I'd like a breakout. Given today's bullish hollow red candlestick, we could see an attempt tomorrow. The RSI is positive and not overbought. The PMO bottomed above the zero line and is going in for a Crossover BUY Signal. Stochastics are rising toward 80. The group isn't doing that well which does bother me given I'm not fully on board the Technology train. The price pattern just looked too good. VIAV is showing outperformance against the SPY and the group. The stop is set beneath support at 7.9% or $10.46.
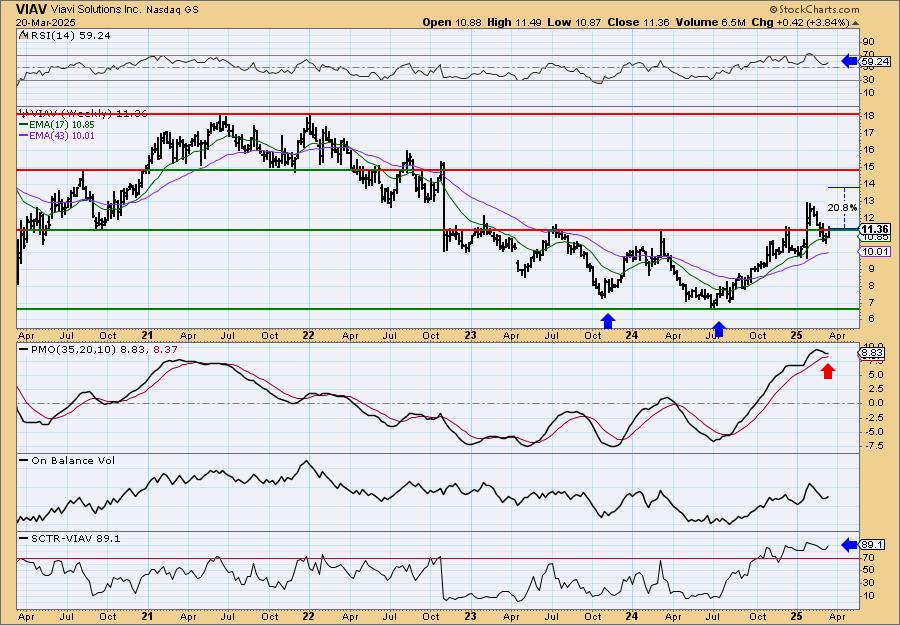
We have a large bullish double bottom on the weekly chart. Price is on a nice rising trend and has confirmed the pattern with an upside breakout above the confirmation line of the chart pattern. The weekly RSI looks good and is not overbought. The SCTR is in the hot zone. The weekly PMO is still declining, but it appears to already be decelerating the decline. There is excellent upside potential if it can break above near-term resistance. The pattern suggests that we'll get a move above the next level of resistance.
Don't forget, on Thursdays I look at reader-requested symbols, click HERE to send me an email. I read every email I receive and try to answer them all!
Current Market Outlook:
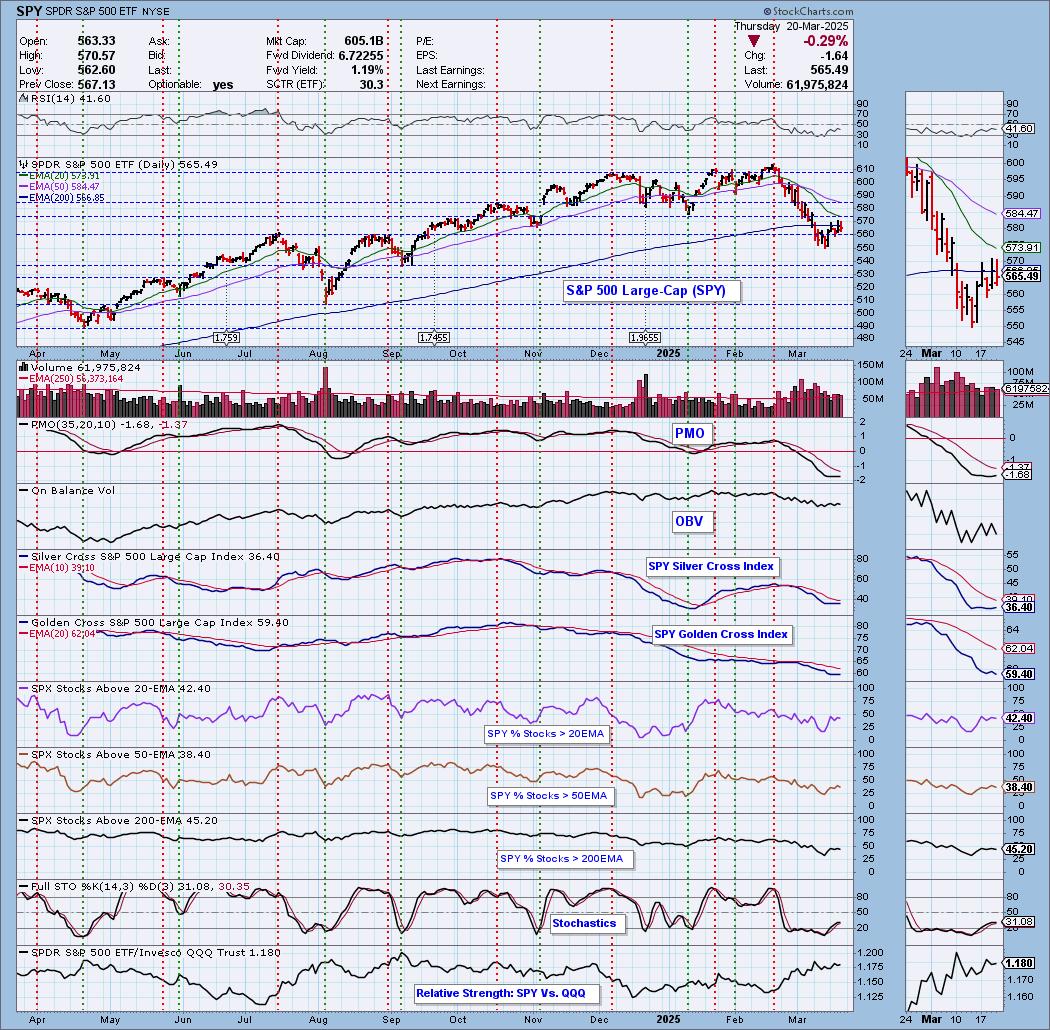
Market Environment: It is important to consider the odds for success by assessing the market tides. The following chart uses different methodologies for objectively showing the depth and trend of participation for intermediate- and long-term time frames.
- The Silver Cross Index (SCI) shows the percentage of SPX stocks on IT Trend Model BUY signals (20-EMA > 50-EMA)
- The Golden Cross Index (GCI) shows the percentage of SPX stocks on LT Trend Model BUY signals (50-EMA > 200-EMA)
Don't forget that as a "Diamonds" member, you have access to our "Under the Hood" curated ChartList on DecisionPoint.com. You'll find it under "Members Only" links on the left side on the Blogs and Links Page.
Here is the current chart:
Full Disclosure: I am 20% long, 0% short. Contemplating BHF.
I'm required to disclose if I currently own a stock I mention and/or may buy/short it within the next 72 hours.
"Technical Analysis is a windsock, not a crystal ball." - Carl Swenlin
(c) Copyright 2025 DecisionPoint.com
Watch the latest episode of DecisionPoint Trading Room with Carl Swenlin & Erin Swenlin Mondays on the DecisionPoint YouTube channel here!
NOTE: The stocks reported herein are from mechanical trading model scans that are based upon moving average relationships, momentum and volume. DecisionPoint analysis is then applied to get five selections from the scans. The selections given should prompt readers to do a chart review using their own analysis process. This letter is not a call for a specific action to buy, sell or short any of the stocks provided. There are NO sure things or guaranteed returns on the daily selection of "Diamonds in the Rough."
Regarding BUY/SELL Signals: The signal status reported herein is based upon mechanical trading model signals and crossovers. They define the implied bias of the price index/stock based upon moving average relationships and momentum, but they do not necessarily call for a specific action. They are information flags that should prompt chart review. Further, they do not call for continuous buying or selling during the life of the signal. For example, a BUY signal will probably (but not necessarily) return the best results if action is taken soon after the signal is generated. Additional opportunities for buying may be found as price zigzags higher, but the trader must look for optimum entry points. Conversely, exit points to preserve gains (or minimize losses) may be evident before the model mechanically closes the signal.
Helpful DecisionPoint Links:
Price Momentum Oscillator (PMO)
Swenlin Trading Oscillators (STO-B and STO-V)
For more links, go to DecisionPoint.com