
It's a tough market out there and given the clear declining trend and neutral condition, it is definitely time to think short. There will certainly be some longs that will be winners, but those are going to get harder and harder to find.
I actually had only one reader send in requests and all were short which I did like. The list was excellent and I've included some of the other requested symbols for your review. I added one of my own from the Diamond Dog Scan.
Speaking of the Diamond Dog Scan, it only had three results today! Shocking really, but I think it is due to the abrupt drop in many stocks that prevented them from hitting my scan which looks for downward momentum over a few days before a Crossover SELL Signal by the PMO. The results from the scan were: JOE, SCHL (a "Diamond in the Rough" today) and WAFD.
It's a wacky market and I actually prefer staying out of it on the long or short side. It reminds me of the COVID drop where one day would be a deep decline and the next a rapid rally. It's extremely difficult to trade in this market environment so be careful out there.
Good Luck & Good Trading,
Erin
Today's "Diamonds in the Rough": CHRD (Short), ON (Short) and SCHL (Short).
Other requests: FDX, HOG, OKE and RYAM (all shorts).

Diamond Mine Trading Room:
RECORDING & DOWNLOAD LINK (2/28/2025):
Topic: DecisionPoint Diamond Mine (2/28/2025) LIVE Trading Room
Recording & Download Link
Passcode: February#28
REGISTRATION for 3/7/2025:
When: March 7, 2025 09:00 AM Pacific Time (US and Canada)
Topic: DecisionPoint Diamond Mine LIVE Trading Room
Register in advance for this webinar HERE
After registering, you will receive a confirmation email containing information about joining the webinar.

Below is the latest free DecisionPoint Trading Room recording from 3/3. You'll find these recordings posted on Mondays to our DP YouTube Channel. Be sure and subscribe HERE.
Welcome to DecisionPoint Diamonds, wherein I highlight ten "Diamonds in the Rough" per week. These are selected from the results of my DecisionPoint Scans which search for stocks that could benefit from the trend and condition of the market. Remember, these are not recommendations to buy or sell, but are the most interesting of the stocks that surfaced in my scans. My objective is to save you the work of the initial, tedious culling process, but you need to apply your own analysis to see if these stocks pique your interest as well. There are no guaranteed winners here!
"Predefined Scans Triggered" are taken from StockCharts.com using the "Symbol Summary" option instead of a "SharpChart" on the workbench.
Stop levels are all rounded down.
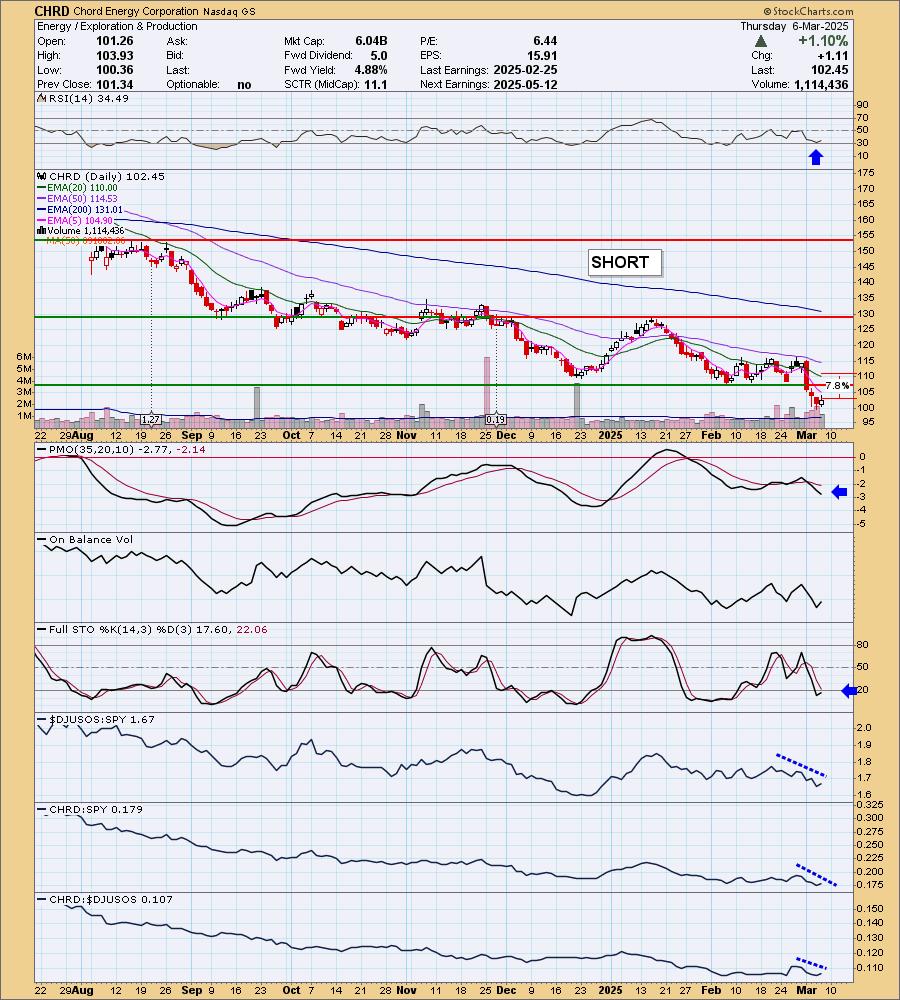
Chord Energy Corporation (CHRD)
EARNINGS: 2025-05-12 (AMC)
Chord Energy Corp. engages in the exploration and production of crude oil, natural gas liquids, and natural gas. The firm's business roots back to the year 2007, when its predecessor, Oasis, was formed. The company was founded on July 1, 2022 and is headquartered in Houston, TX.
Predefined Scans Triggered: P&F Double Bottom Breakdown.
CHRD is unchanged in after hours trading. I really liked that support was broken after a period of consolidation. It is also in a clear declining trend. It is in Energy which has been suffering of late and could continue to see downside pressure as Crude prices fall. It does deal in Nat Gas, but the Nat Gas rally hasn't done anything for it which is another sign of extreme weakness. The RSI is negative and not oversold. The PMO topped and gave us a Crossover SELL Signal well below the zero line. Stochastics did tip upward, but remain in extremely weak territory below 20. The upside stop is set as close to overhead resistance as possible at 7.8% or $110.44.
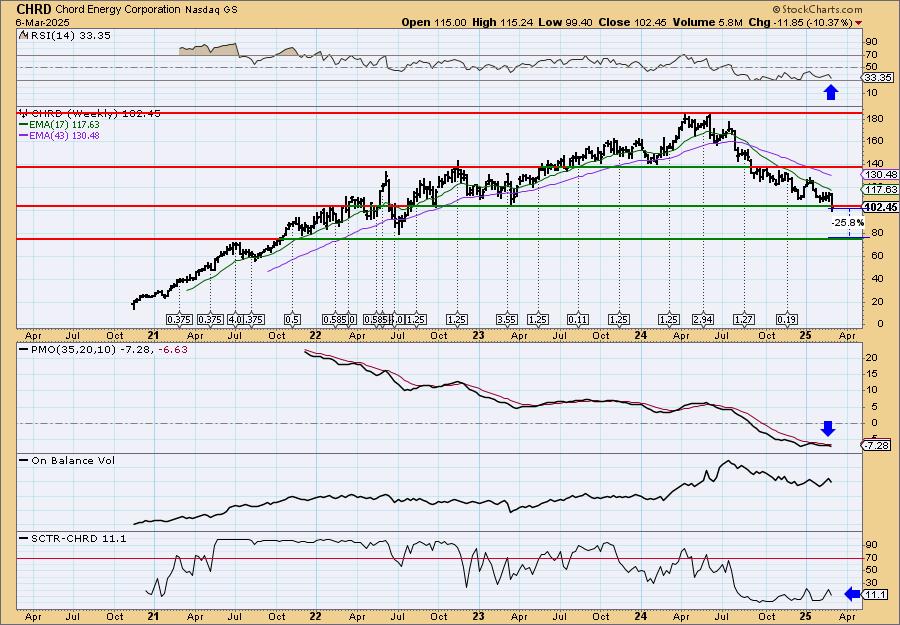
This decline also violated long-term support. The topping formation on the chart is very negative. The weekly RSI is negative and not oversold. The weekly PMO is in decline below the signal line and zero line. The StockCharts Technical Rank (SCTR) is very negative and falling well below the hot zone* above 70. Downside potential is pretty good going into the next support level.
*If a stock is in the "hot zone" above 70, it implies that it is stronger than 70% of its universe (large-, mid-, small-caps and ETFs) primarily in the intermediate to long terms.
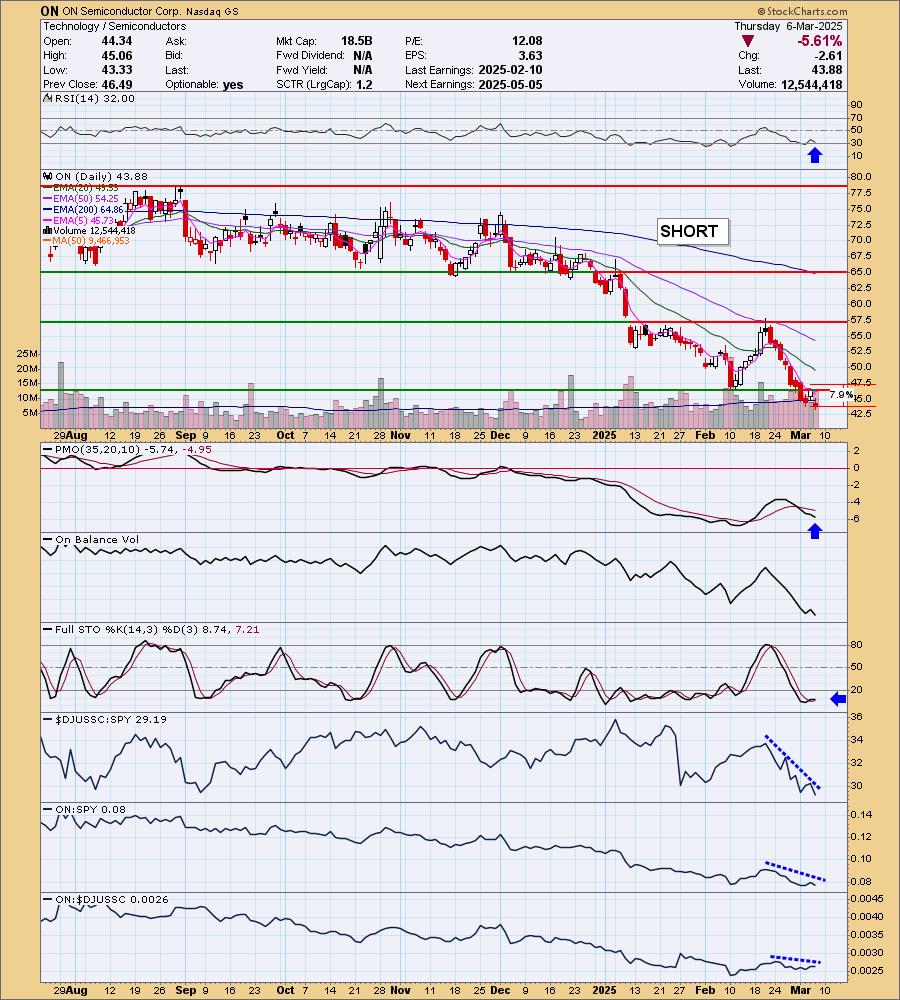
ON Semiconductor Corp. (ON)
EARNINGS: 2025-05-05 (BMO)
ON Semiconductor Corp. engages in the provision of power and sensing solutions, and technologies for electrification of the automotive industry. It operates through the following segments: Power Solutions Group (PSG), Analog and Mixed-Signal Group (AMG), and Intelligent Sensing Group (ISG). The PSG segment offers analog, discrete, module and integrated semiconductor products that perform multiple application functions, including power switching, signal conditioning, and circuit protection. The AMG segment designs and develops analog, mixed-signal, sensor interface devices, power conversion, signal chain, and voltage regulation devices. The ISG segment includes the design and development of complementary metal oxide semiconductor image sensors, image signal processors, single photon detectors, including silicon photomultipliers and single photon avalanche diode arrays, as well as actuator drivers for autofocus and image. The company was founded on July 4, 1999 and is headquartered in Scottsdale, AZ.
Predefined Scans Triggered: P&F Double Bottom Breakdown, New 52-week Lows, Moved Below Lower Price Channel, Elder Bar Turned Red and Moved Below Lower Keltner Channel.
ON is down -0.09% in after hours trading. Here is another one with lost support. It has been sliding lower for quite some time so it could be time for a small bounce, but the Semiconductor space looks very bearish right now so I don't see a big rebound on the horizon. The RSI is very negative and not oversold. The PMO is dropping on a Crossover SELL Signal that arrived below the zero line. Stochastics are moving mostly sideways in territory below 20 which implies internal weakness. Relative strength is tanking for the group and ON is showing weakness against both the group and the SPY right now. The stop is set above resistance at 7.9% or $47.35.
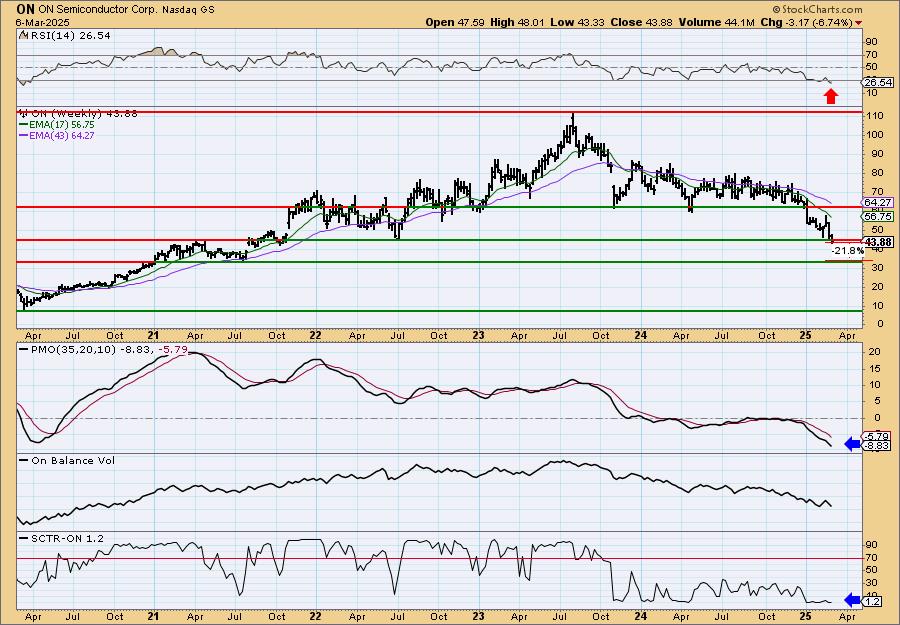
This breakdown is below strong support at the 2022 low. The weekly RSI is oversold, but that condition could persist given the very negative outlook for ON. The weekly PMO is dropping well below the zero line. The SCTR is in the basement. Downside potential is pretty good even if it just drops to the next level of support.
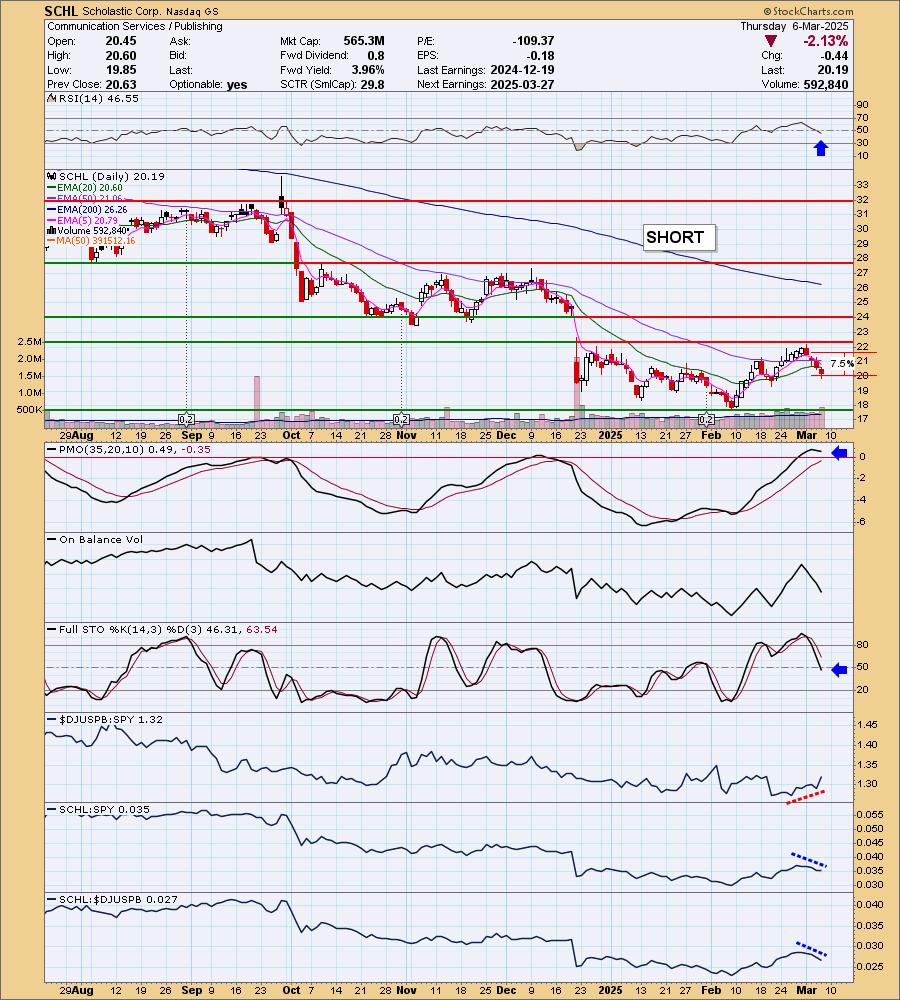
Scholastic Corp. (SCHL)
EARNINGS: 2025-03-27 (AMC)
Scholastic Corp. engages in the publication and distribution of children's books, magazines, and teaching materials. It operates through the following business segments: Children's Book Publishing and Distribution, Education Solutions, and International. The Children's Book Publishing and Distribution segment includes the publication and distribution of children's books, e-books, media, and interactive products. The Education segment publishes and distributes children's books, other print and on-line reference, non-fiction and fiction focused products, classroom magazines and classroom materials to schools and libraries. The International segment offers products and services outside the United States. The company was founded by Maurice R. Robinson in 1920 and is headquartered in New York, NY.
Predefined Scans Triggered: P&F Double Top Breakout and P&F Bearish Signal Reversal.
SCHL is unchanged in after hours trading. This one hit resistance and was immediately turned away. It is now headed to the next level of support which I believe is very weak. The RSI just moved below net neutral (50) and the PMO has topped. Stochastics look very poor dropping into negative territory today. The group is doing alright against the SPY which I'd prefer wasn't the case, but SCHL is showing poor performance against the group and the SPY right now. The stop is set at the second price top at 7.5% or $21.70.
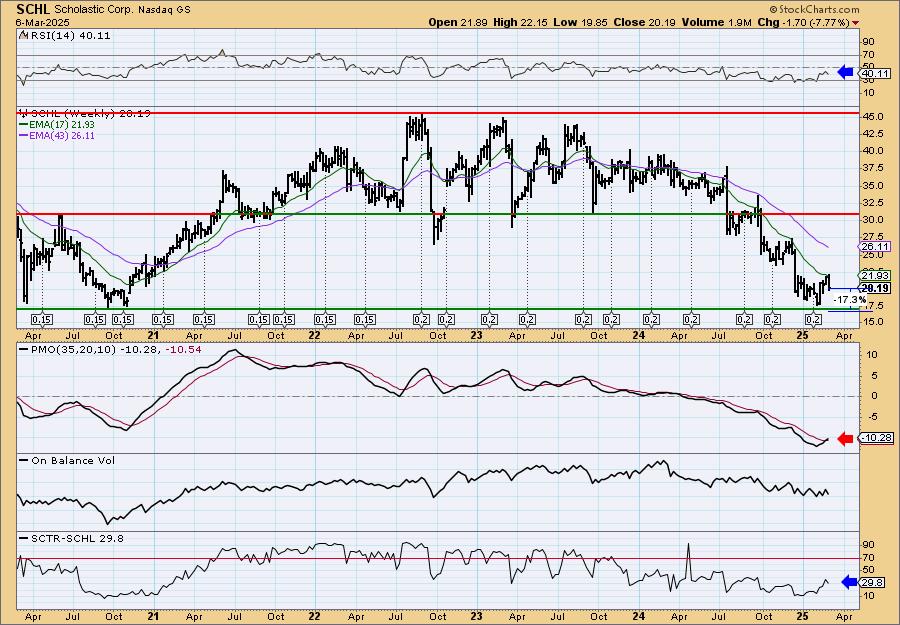
It is bouncing off support on the weekly chart and we do have a weekly PMO Crossover BUY Signal so keep this with a short-term horizon (you should actually do that on shorts anyway). The weekly RSI is negative and has turned down. The SCTR is outside the hot zone above 70. I'm counting on the current declining trend to hold. Downside potential isn't outstanding, but it could drop below the next support level.
Don't forget, on Thursdays I look at reader-requested symbols, click HERE to send me an email. I read every email I receive and try to answer them all!
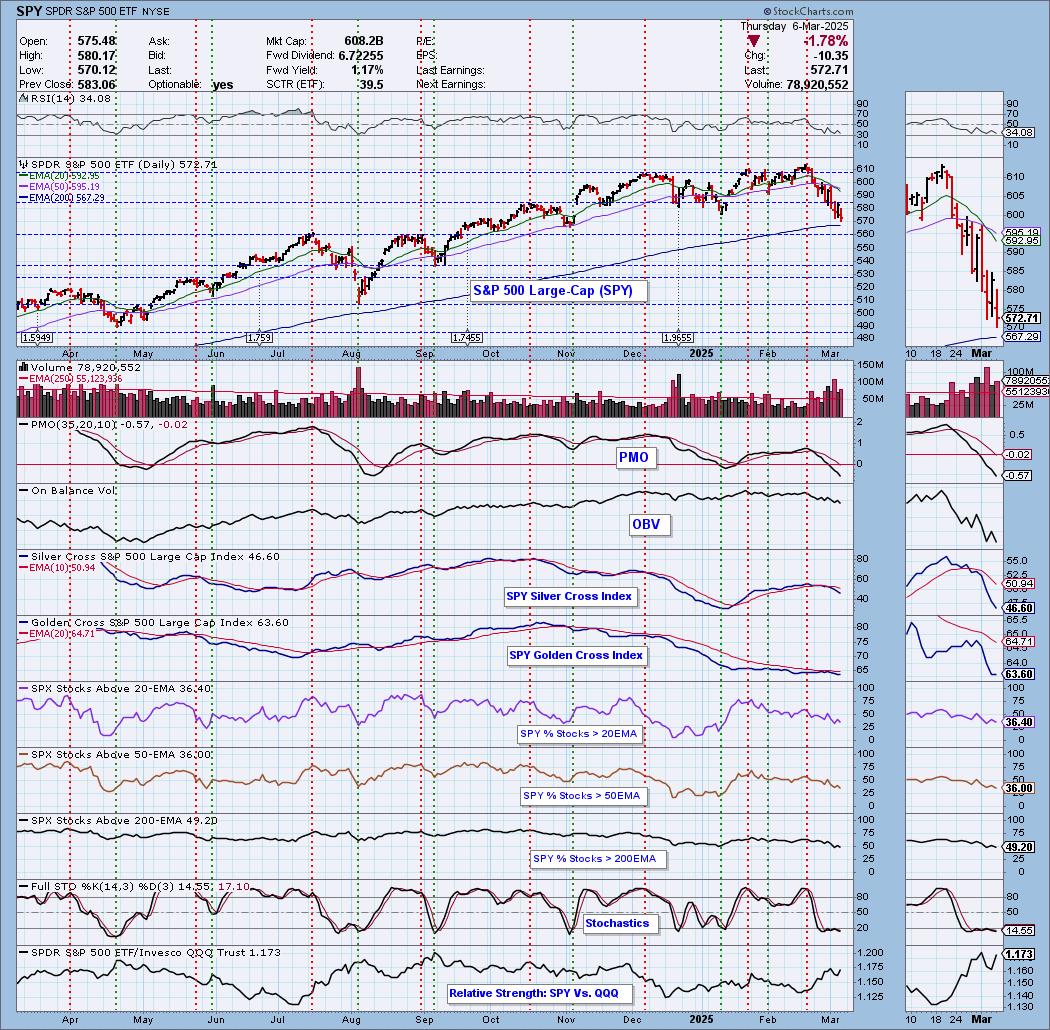
Current Market Outlook:
Market Environment: It is important to consider the odds for success by assessing the market tides. The following chart uses different methodologies for objectively showing the depth and trend of participation for intermediate- and long-term time frames.
- The Silver Cross Index (SCI) shows the percentage of SPX stocks on IT Trend Model BUY signals (20-EMA > 50-EMA)
- The Golden Cross Index (GCI) shows the percentage of SPX stocks on LT Trend Model BUY signals (50-EMA > 200-EMA)
Don't forget that as a "Diamonds" member, you have access to our "Under the Hood" curated ChartList on DecisionPoint.com. You'll find it under "Members Only" links on the left side on the Blogs and Links Page.
Here is the current chart:
Full Disclosure: I am 10% long, 0% short.
I'm required to disclose if I currently own a stock I mention and/or may buy/short it within the next 72 hours.
"Technical Analysis is a windsock, not a crystal ball." - Carl Swenlin
(c) Copyright 2025 DecisionPoint.com
Watch the latest episode of DecisionPoint Trading Room with Carl & Erin Swenlin Mondays on the DecisionPoint YouTube channel here!
NOTE: The stocks reported herein are from mechanical trading model scans that are based upon moving average relationships, momentum and volume. DecisionPoint analysis is then applied to get five selections from the scans. The selections given should prompt readers to do a chart review using their own analysis process. This letter is not a call for a specific action to buy, sell or short any of the stocks provided. There are NO sure things or guaranteed returns on the daily selection of "Diamonds in the Rough."
Regarding BUY/SELL Signals: The signal status reported herein is based upon mechanical trading model signals and crossovers. They define the implied bias of the price index/stock based upon moving average relationships and momentum, but they do not necessarily call for a specific action. They are information flags that should prompt chart review. Further, they do not call for continuous buying or selling during the life of the signal. For example, a BUY signal will probably (but not necessarily) return the best results if action is taken soon after the signal is generated. Additional opportunities for buying may be found as price zigzags higher, but the trader must look for optimum entry points. Conversely, exit points to preserve gains (or minimize losses) may be evident before the model mechanically closes the signal.
Helpful DecisionPoint Links:
Price Momentum Oscillator (PMO)
Swenlin Trading Oscillators (STO-B and STO-V)
For more links, go to DecisionPoint.com