
The ETF scans weren't that productive today. It came down to the Surge Scan and PMO Crossover Scan to find today's candidates. There was definitely a clear theme to today's selections. The predominant theme was "international". I had quite a few international ETFs with a particular theme within of China.
Therefore we are going to go with the theme and present a China ETF, Japan ETF and a general International group ETF.
Today's big rally really hurt yesterday's shorts, but I still think the market is vulnerable to some downside ahead so I think the rallies just gave us some better entries on the shorts. If we see another up day, the spreadsheet could be ugly for those shorts, but we'll see how the market fares tomorrow. Today's thrust upward does have me a little bit concerned about the shorts.
Tomorrow is Reader Request Day! Would love to see what symbols you have on your mind. Feel free to send as many as you'd like! I love it when I have plenty to choose from.
Good Luck & Good Trading,
Erin
Today's "Diamonds in the Rough": CWEB, EWJV and VYMI.
Runner-ups: EWD, JIRE, GCOW and IDHQ.

Diamond Mine Trading Room:
RECORDING & DOWNLOAD LINK (2/28/2025):
Topic: DecisionPoint Diamond Mine (2/28/2025) LIVE Trading Room
Recording & Download Link
Passcode: February#28
REGISTRATION for 3/7/2025:
When: March 7, 2025 09:00 AM Pacific Time (US and Canada)
Topic: DecisionPoint Diamond Mine LIVE Trading Room
Register in advance for this webinar HERE
After registering, you will receive a confirmation email containing information about joining the webinar.

Below is the latest free DecisionPoint Trading Room recording from 3/3. You'll find these recordings posted on Mondays to our DP YouTube Channel. Be sure and subscribe HERE.
Welcome to DecisionPoint Diamonds, wherein I highlight ten "Diamonds in the Rough" per week. These are selected from the results of my DecisionPoint Scans which search for stocks that could benefit from the trend and condition of the market. Remember, these are not recommendations to buy or sell, but are the most interesting of the stocks that surfaced in my scans. My objective is to save you the work of the initial, tedious culling process, but you need to apply your own analysis to see if these stocks pique your interest as well. There are no guaranteed winners here!
"Predefined Scans Triggered" are taken from StockCharts.com using the "Symbol Summary" option instead of a "SharpChart" on the workbench.
Stop levels are all rounded down.
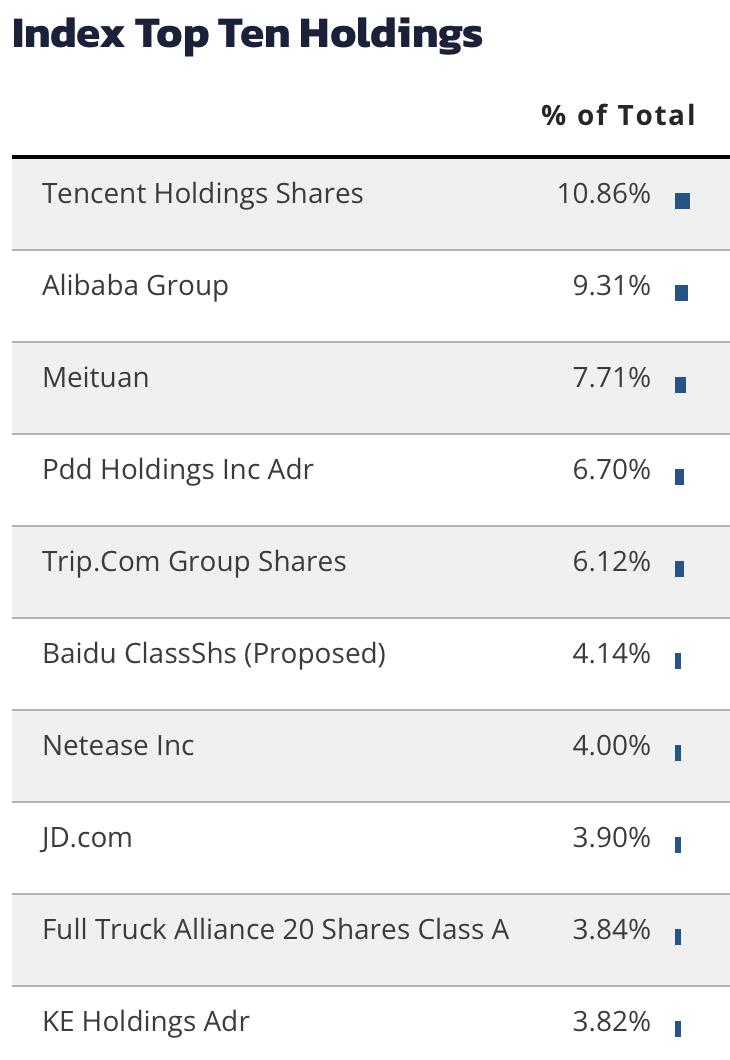
Direxion Daily CSI China Internet Index Bull 2X Shares (CWEB)
EARNINGS: N/A
CWEB provides 2x leveraged daily exposure to an index composed of overseas-listed Chinese internet companies. Click HERE for more information.
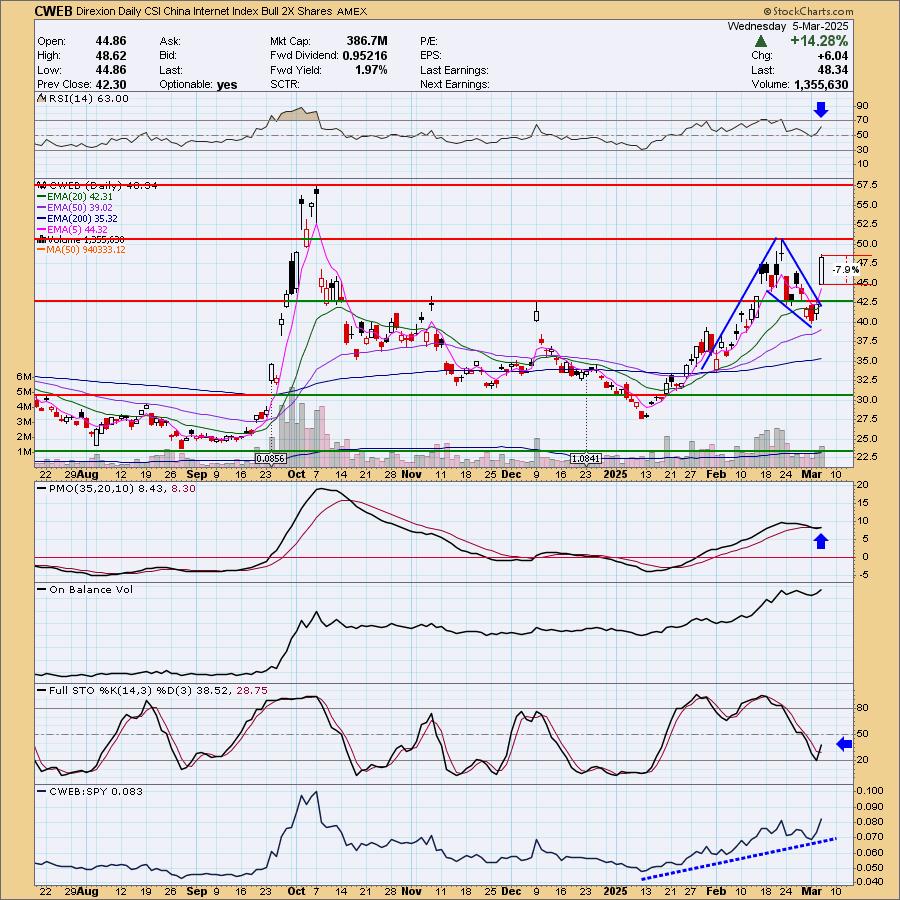
Predefined Scans Triggered: Elder Bar Turned Green, Parabolic SAR Buy Signals, New CCI Buy Signals, P&F double Top Breakout and Gap Ups.
CWEB is up +0.72% in after hours trading. Given Tech as a whole hasn't been performing well I was surprised to see this one performing so well. We have a bull flag in which the flag is a bullish falling wedge. The pattern was confirmed with today's breakout. The RSI is positive and not at all overbought. The PMO has whipsawed back into a Crossover BUY Signal. Stochastics have turned back up and relative strength is outstanding. The stop was a little difficult to set given today's giant move higher. I chose 7.9% or $44.52.
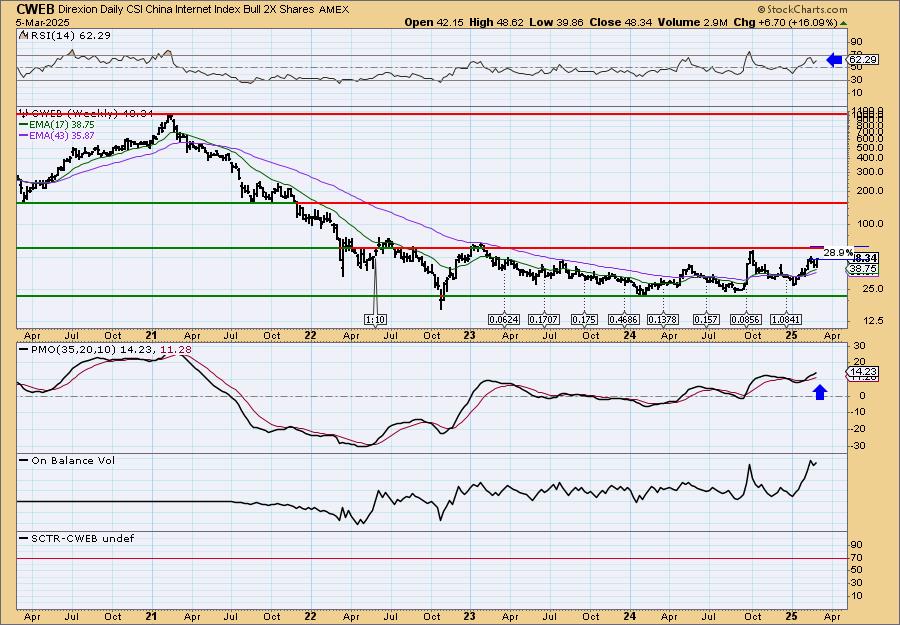
It has been in a trading range for quite some time and is now making its way to the top of the range. Because this one is leveraged 2x, all we need is for it to reach the top of the range for a good return. The weekly RSI is positive and the weekly PMO is on the rise.
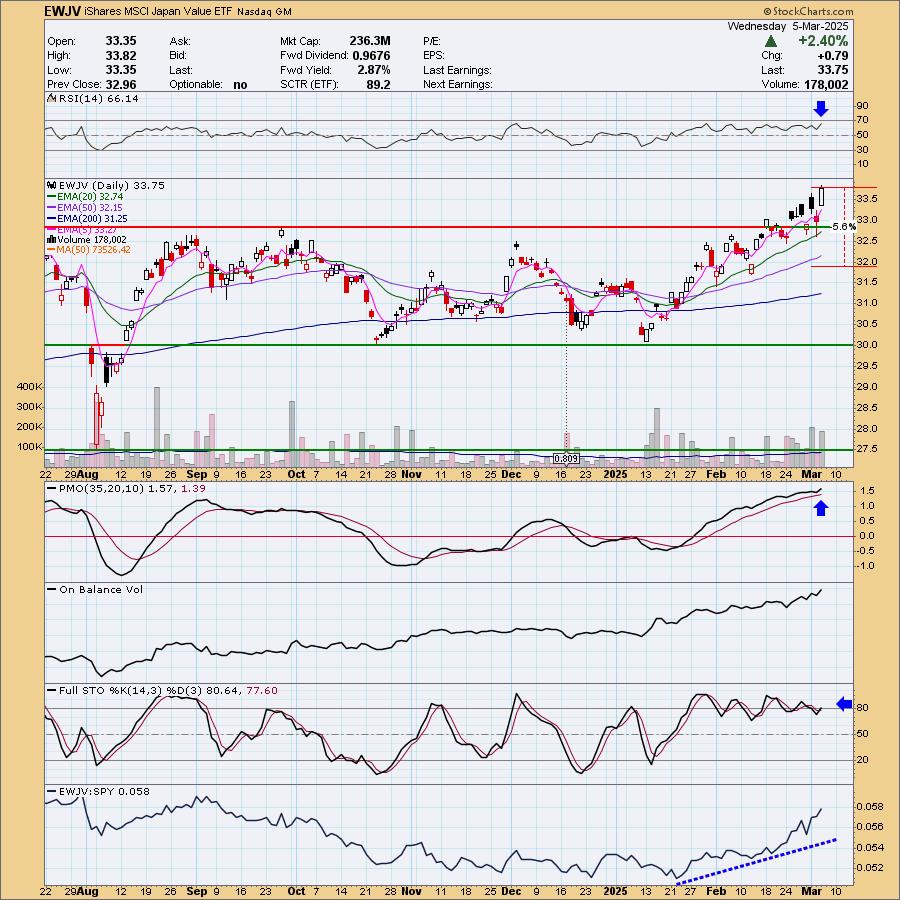
iShares MSCI Japan Value ETF (EWJV)
EARNINGS: N/A
EWJV tracks a multi-factor-selected, market cap-weighted portfolio of Japanese equities. Click HERE for more information.
Predefined Scans Triggered: Elder Bar Turned Green, Moved Above Upper Keltner Channel, New 52-week Highs, Moved Above Upper Bollinger Band, Moved Above Upper Price Channel, Parabolic SAR Buy Signals, P&F Ascending Triple Top Breakout and P&F Double Top Breakout.
EWJV is unchanged in after hours trading. We have a nice steady uptrend with a breakout from a trading range. This one came through on the Surge Scan so we can see a PMO bottom above the signal line. The RSI is not overbought and we can see the OBV is rising with price. Stochastics not only turned up but also moved above 80. Relative strength is excellent and improving further. I like that you don't have to set a deep stop. I chose to set it below the 50-day EMA at 5.6% or $31.86.
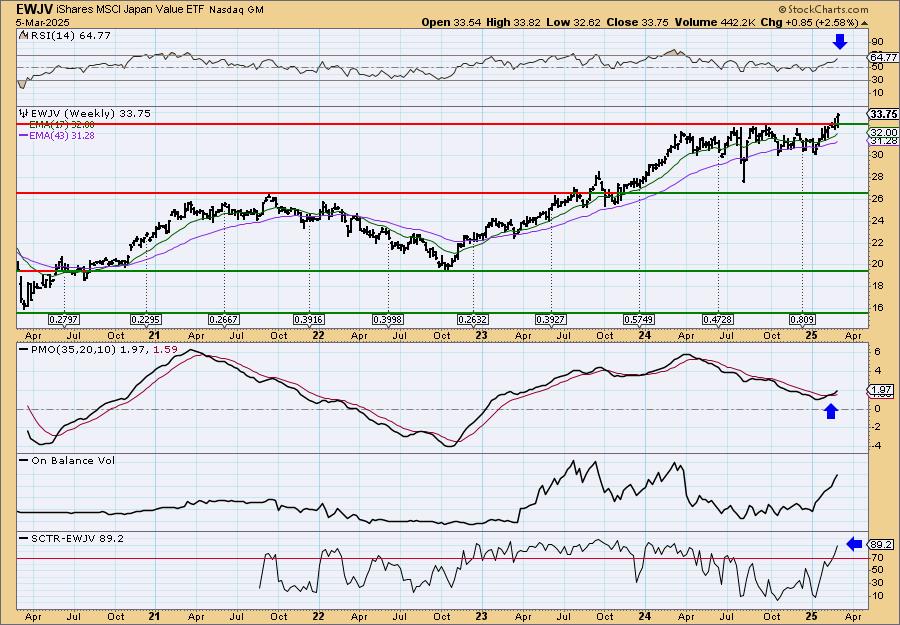
The breakout looks great on the weekly chart. It is finally breaking out after testing the top of the range for a year. The weekly RSI is rising and is not overbought. The weekly PMO is rising on a Crossover BUY Signal. Volume is coming in strong based on the OBV. The StockCharts Technical Rank (SCTR) is well within the hot zone* above 70. Consider a 17% upside target to about $39.49.
*If a stock is in the "hot zone" above 70, it implies that it is stronger than 70% of its universe (large-, mid-, small-caps and ETFs) primarily in the intermediate to long terms.
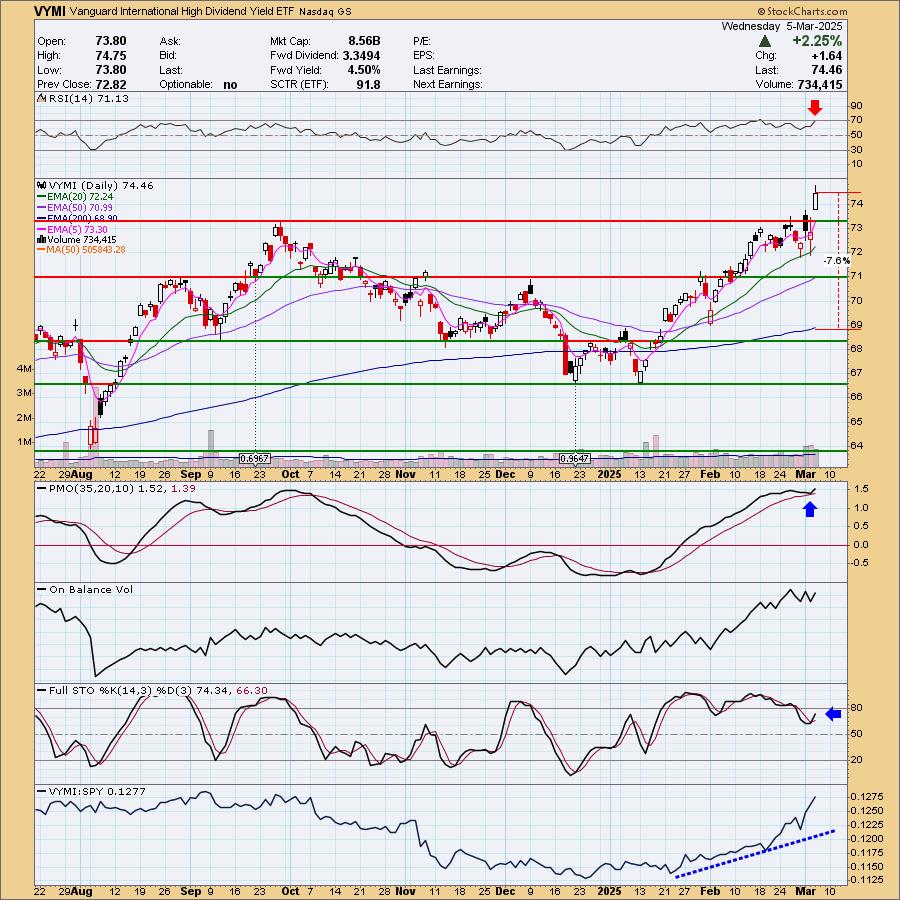
Vanguard International High Dividend Yield ETF (VYMI)
EARNINGS: N/A
The fund tracks a market cap-weighted index of developed and emerging market firms (ex-US) that are expected to pay above average dividends over the next 12 months. Click HERE for more information.
Predefined Scans Triggered: Elder Bar turned Green, New CCI Buy Signals, Moved Above Upper Keltner Channel, New 52-week Highs, Moved Above Upper Bollinger Band, Moved Above Upper Price Channel and P&F Double Top Breakout.
VYMI is up +0.04% in after hours trading. Here we have another excellent breakout. It has been on a nice run so the RSI is now overbought so we could see a mechanical pullback toward the breakout point before it rallies further. The PMO has surged above the signal line and Stochastics are rising toward 80 in positive territory. Relative strength is excellent on this ETF. The stop can be thinner than what I have here. I chose to bring it down to the 200-day EMA at 7.6% or $68.80.
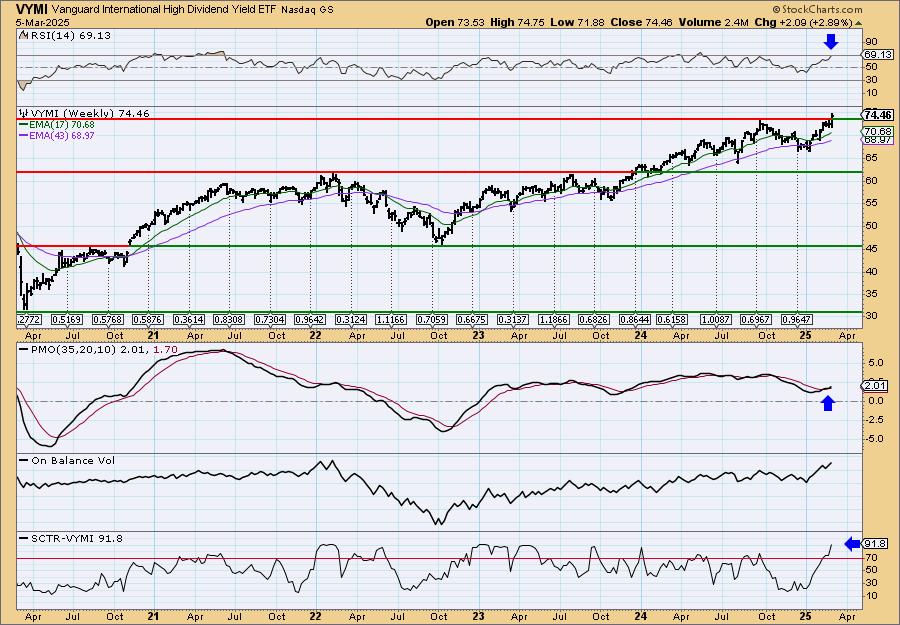
The breakout looks good on the weekly chart. The weekly RSI is not quite overbought yet. The weekly PMO is rising on a Crossover BUY Signal and the SCTR is at the top of the hot zone. Consider a 17% upside target to about $87.12.
Don't forget, on Thursdays I look at reader-requested symbols, click HERE to send me an email. I read every email I receive and try to answer them all!
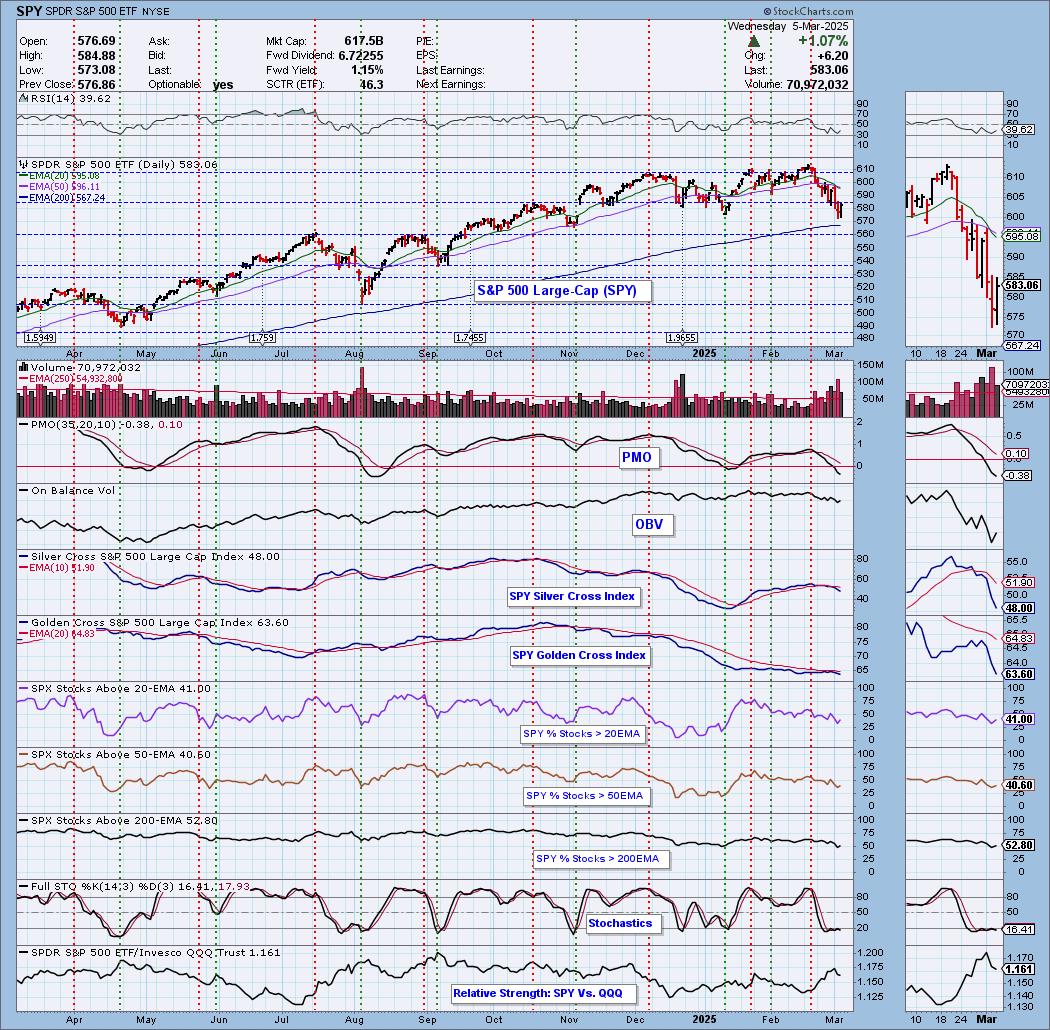
Current Market Outlook:
Market Environment: It is important to consider the odds for success by assessing the market tides. The following chart uses different methodologies for objectively showing the depth and trend of participation for intermediate- and long-term time frames.
- The Silver Cross Index (SCI) shows the percentage of SPX stocks on IT Trend Model BUY signals (20-EMA > 50-EMA)
- The Golden Cross Index (GCI) shows the percentage of SPX stocks on LT Trend Model BUY signals (50-EMA > 200-EMA)
Don't forget that as a "Diamonds" member, you have access to our "Under the Hood" curated ChartList on DecisionPoint.com. You'll find it under "Members Only" links on the left side on the Blogs and Links Page.
Here is the current chart:
Full Disclosure: I am 10% long, 0% short.
I'm required to disclose if I currently own a stock I mention and/or may buy/short it within the next 72 hours.
"Technical Analysis is a windsock, not a crystal ball." - Carl Swenlin
(c) Copyright 2025 DecisionPoint.com
Watch the latest episode of DecisionPoint Trading Room with Carl & Erin Swenlin Mondays on the DecisionPoint YouTube channel here!
NOTE: The stocks reported herein are from mechanical trading model scans that are based upon moving average relationships, momentum and volume. DecisionPoint analysis is then applied to get five selections from the scans. The selections given should prompt readers to do a chart review using their own analysis process. This letter is not a call for a specific action to buy, sell or short any of the stocks provided. There are NO sure things or guaranteed returns on the daily selection of "Diamonds in the Rough."
Regarding BUY/SELL Signals: The signal status reported herein is based upon mechanical trading model signals and crossovers. They define the implied bias of the price index/stock based upon moving average relationships and momentum, but they do not necessarily call for a specific action. They are information flags that should prompt chart review. Further, they do not call for continuous buying or selling during the life of the signal. For example, a BUY signal will probably (but not necessarily) return the best results if action is taken soon after the signal is generated. Additional opportunities for buying may be found as price zigzags higher, but the trader must look for optimum entry points. Conversely, exit points to preserve gains (or minimize losses) may be evident before the model mechanically closes the signal.
Helpful DecisionPoint Links:
Price Momentum Oscillator (PMO)
Swenlin Trading Oscillators (STO-B and STO-V)
For more links, go to DecisionPoint.com