
I decided to concentrate on my Diamond Dog Scan today which finds possible shorts. The list hasn't been that long which is surprising to me given the decline in the market. I've also not been able to find good shorting candidates of late. Today was a different story. Even though I didn't have a large amount of results to look at, I was able to find some real stinkers.
One of them doesn't have quite the downside potential that I like, but given how bearish OMC is it could very well lose the next level of support.
The other three have excellent downside potential and given the market's weakness, I don't see how they are going to turn it around anytime soon.
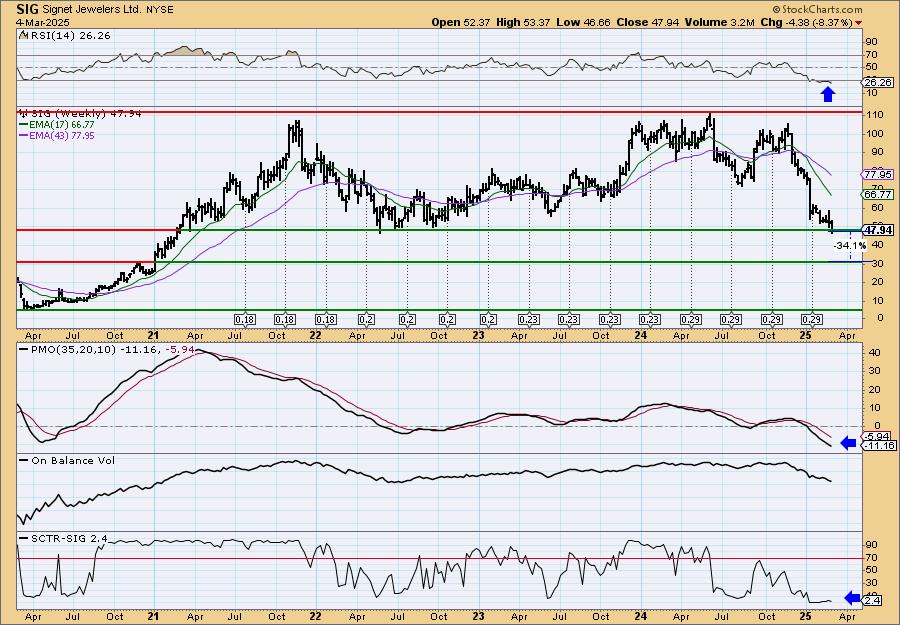
One of today's selections, SIG, had the lowest PMO value of all of the Diamond Dog Scan results. The setup is very good for a short.
Stay nimble as the market could see a reversal. It tried very hard to get one today, but weakness overcame it and it finished way down. Definitely showing signs of strain.
Good Luck & Good Trading,
Erin
Today's "Diamonds in the Rough": CBT (Short), PII (Short) and SIG (Short).

Diamond Mine Trading Room:
RECORDING & DOWNLOAD LINK (2/28/2025):
Topic: DecisionPoint Diamond Mine (2/28/2025) LIVE Trading Room
Recording & Download Link
Passcode: February#28
REGISTRATION for 3/7/2025:
When: March 7, 2025 09:00 AM Pacific Time (US and Canada)
Topic: DecisionPoint Diamond Mine LIVE Trading Room
Register in advance for this webinar HERE
After registering, you will receive a confirmation email containing information about joining the webinar.

Below is the latest free DecisionPoint Trading Room recording from 3/3. You'll find these recordings posted on Mondays to our DP YouTube Channel. Be sure and subscribe HERE.
Welcome to DecisionPoint Diamonds, wherein I highlight ten "Diamonds in the Rough" per week. These are selected from the results of my DecisionPoint Scans which search for stocks that could benefit from the trend and condition of the market. Remember, these are not recommendations to buy or sell, but are the most interesting of the stocks that surfaced in my scans. My objective is to save you the work of the initial, tedious culling process, but you need to apply your own analysis to see if these stocks pique your interest as well. There are no guaranteed winners here!
"Predefined Scans Triggered" are taken from StockCharts.com using the "Symbol Summary" option instead of a "SharpChart" on the workbench.
Stop levels are all rounded down.
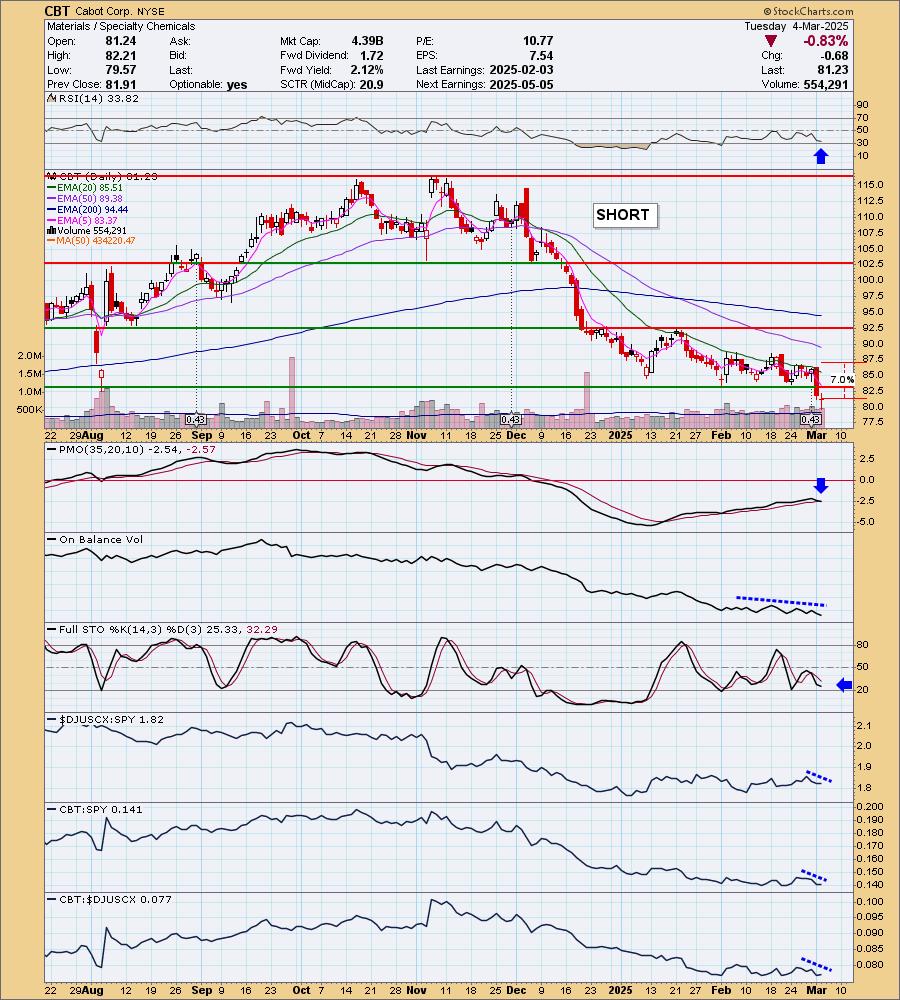
Cabot Corp. (CBT)
EARNINGS: 2025-05-05 (AMC)
Cabot Corp. is a global specialty chemicals and performance materials company. The firm's products include reinforcing and specialty carbons, specialty compounds, conductive additives, carbon nanotubes, fumed metal oxides, inkjet colorants, and aerogel. It operates through the following segments: Reinforcement Materials and Performance Chemicals. The Reinforcement Materials segment involves the rubber blacks and elastomer composites product lines. The Performance Chemicals segment combines the specialty carbons and compounds and inkjet colorants product lines into the specialty carbons and formulations business. The company was founded by Godfrey Lowell Cabot in 1882 and is headquartered in Boston, MA.
Predefined Scans Triggered: P&F Double Bottom Breakdown, Stocks in a New Downtrend (ADX) and New 52-week Lows.
CBT is up +0.01% in after hours trading. This one would've been a great pick up yesterday on the breakdown. It fell further today and is in a declining trend. Broken support is key on shorts in my opinion. The RSI is very negative and not oversold. The PMO is nearing a Crossover SELL Signal well below the zero line. Stochastics are falling in negative territory. Relative strength lines are in declining trends right now. The upside stop is set above resistance at 7% or $86.92.
The breakdown looks particularly treacherous on the weekly chart. The weekly RSI is negative and the weekly PMO is in decline below the zero line. The StockCharts Technical Rank (SCTR) is rising somewhat, but it is still well outside the hot zone* above 70.
*If a stock is in the "hot zone" above 70, it implies that it is stronger than 70% of its universe (large-, mid-, small-caps and ETFs) primarily in the intermediate to long terms.

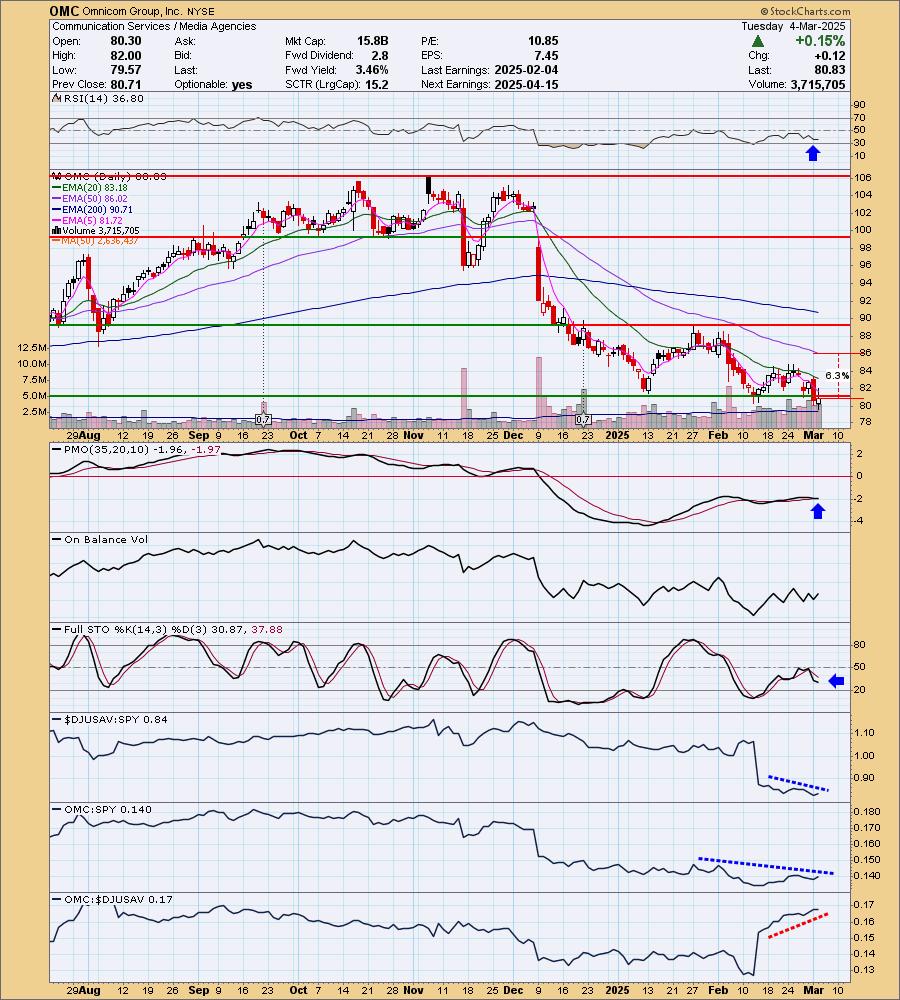
Omnicom Group, Inc. (OMC)
EARNINGS: 2025-04-15 (AMC)
Omnicom Group, Inc. is a holding company, which provides advertising, marketing and corporate communications services. The company was founded by Maxwell Dane in 1944 and is headquartered in New York, NY.
Predefined Scans Triggered: P&F Double Bottom Breakdown, P&F Descending Triple Bottom Breakdown and New 52-week Lows.
OMC is unchanged in after hours trading. Here is another one that lost support and happens to be at new 52-week lows. The RSI is negative and not oversold yet. The PMO is nearing a Crossover SELL Signal well below the zero line. Stochastics are declining in negative territory. We do need to be a little careful here as the OBV bottoms are rising and that is a positive divergence with price lows which are declining. It is showing leadership within its industry group, but ultimately the group is suffering and it is still underperforming the SPY overall. You don't need a deep stop, you could even thin it down a bit more. I chose a spot above near-term resistance at 6.3% or $85.92.
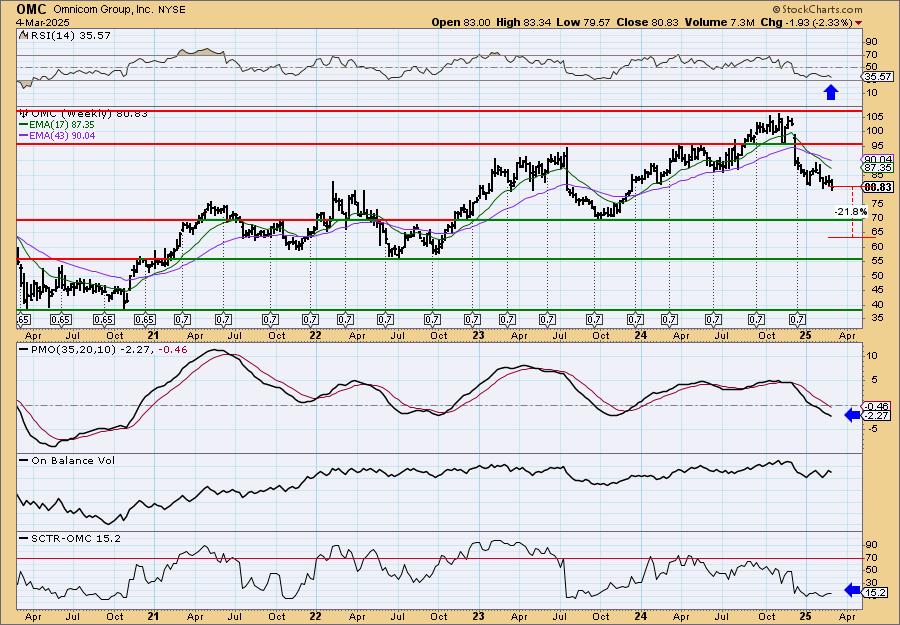
The next level of support is about 14.5% away, but I think it could break down there so I've set the target a bit lower than that. The weekly RSI is negative and the weekly PMO is tumbling lower below the zero line. The SCTR is very low as we want on a short.
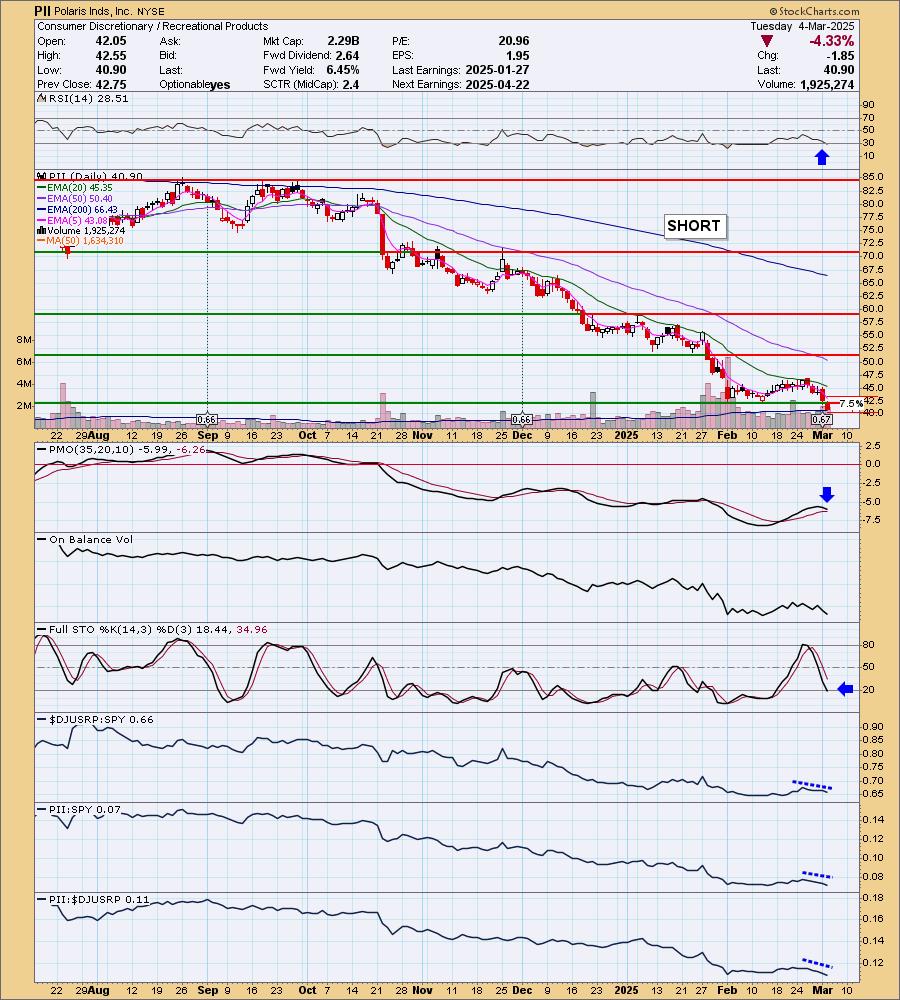
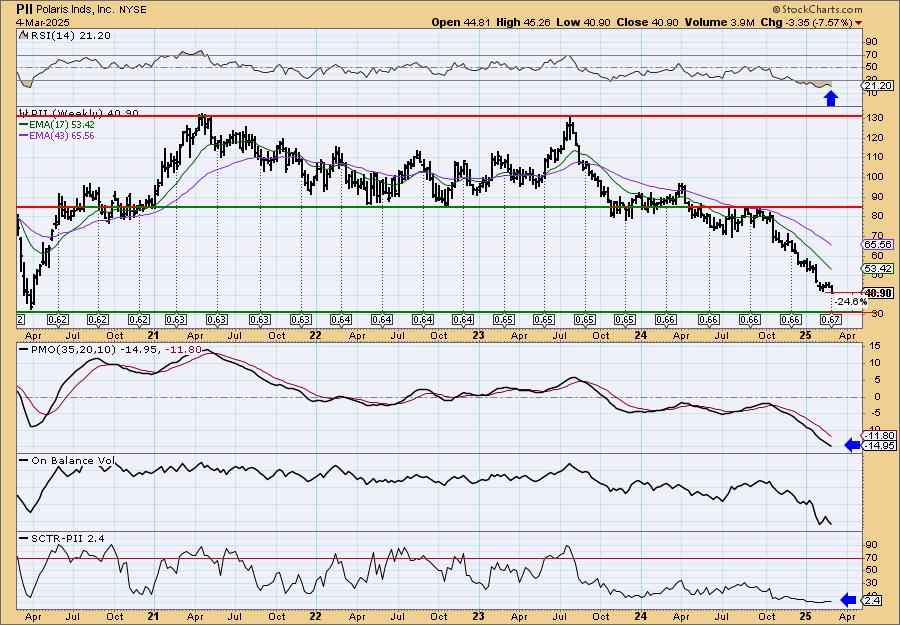
Polaris Inds, Inc. (PII)
EARNINGS: 2025-04-22 (AMC)
Polaris Inc. engages in designing, engineering, manufacturing, and marketing power sports vehicles. It operates through the following segments: Off Road, On Road, and Marine. The Off Road segment includes off-road vehicles (ORV) and snowmobiles. The On Road segment is involved in the design and manufacture of motorcycles, moto-roadsters, light duty hauling, and passenger vehicles. The Marine segment focuses on the design and manufacture of boats. The company was founded by Edgar E. Hetteen, Allan Hetten, and David E. Johnson in 1954 and is headquartered in Medina, MN.
Predefined Scans Triggered: P&F Double Bottom Breakdown, P&F Descending Triple Bottom Breakdown, Stocks in a New Downtrend (Aroon), Moved Below Lower Bollinger Band, Moved Below Lower Price Channel, New 52-week Lows and Moved Below Lower Keltner Channel.
PII is actually up +2.69% in after hours trading, but that will not take away the drop below support on today's bigger decline. It could offer a nice entry on the short. The RSI is negative and not yet oversold. The PMO has topped and is nearing a Crossover BUY Signal well below the zero line. Stochastics are now below 20 indicating internal weakness. Relative strength lines are in declining trends. The stop is set above resistance at 7.5% or $43.97.
Ugly weekly chart that shows a strong declining trend after a breakdown out of the previous trading range. The weekly RSI is oversold which can be a good thing for a stock, but the weekly PMO looks terrible as it continues lower well below the zero line. The SCTR is in the basement. Downside potential is pretty good before it reaches the next level of support at its COVID low.
Signet Jewelers Ltd. (SIG)
EARNINGS: 2025-03-19 (BMO)
Signet Jewelers Ltd. engages in the retail of diamond jewelry. It operates through the following business segments: North America, International, and Others. The North America segment operates jewelry stores in malls, mall-based kiosks, and off-mall locations throughout the U.S. and Canada. The International segment sells primarily in the UK and Ireland under the H. Samuel and Ernest Jones banners. The Other segment consists of activities related to purchasing and conversion of rough diamonds to polished stones and unallocated corporate administrative functions. The company was founded in 1949 and is headquartered in Hamilton, Bermuda.
Predefined Scans Triggered: P&F Double Bottom Breakdown and New 52-week Lows.
SIG is up +1.94% in after hours trading, so we might get a better entry. I liked this one due to its loss of support and very low PMO value. The RSI is negative and not oversold yet. The PMO is flat below the zero line (well below the zero line) and that signifies pure weakness. The PMO is nearing a Crossover SELL Signal. Stochastics are very weak below 20. Relative strength is failing across the board. I have set an arbitrary stop at 8% or $51.78.

This is a significant breakdown on the weekly chart. The weekly RSI is oversold, but it could stay that way if the decline continues. Oversold readings can persist in a bearish configuration like this chart has. The weekly PMO is in decline below the zero line. The SCTR is about as low as you can go so there doesn't appear to be any relative strength. There is nice downside potential.
Don't forget, on Thursdays I look at reader-requested symbols, click HERE to send me an email. I read every email I receive and try to answer them all!
Current Market Outlook:
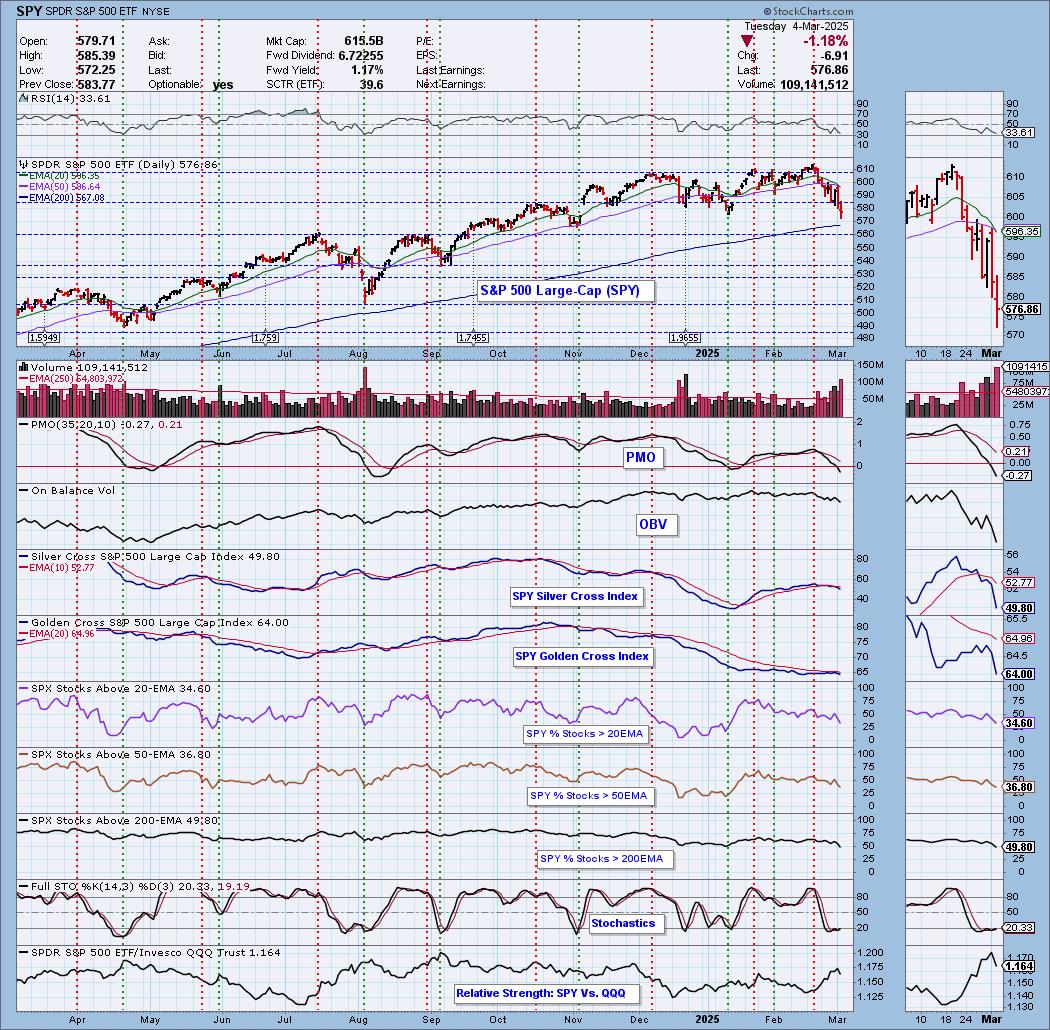
Market Environment: It is important to consider the odds for success by assessing the market tides. The following chart uses different methodologies for objectively showing the depth and trend of participation for intermediate- and long-term time frames.
- The Silver Cross Index (SCI) shows the percentage of SPX stocks on IT Trend Model BUY signals (20-EMA > 50-EMA)
- The Golden Cross Index (GCI) shows the percentage of SPX stocks on LT Trend Model BUY signals (50-EMA > 200-EMA)
Don't forget that as a "Diamonds" member, you have access to our "Under the Hood" curated ChartList on DecisionPoint.com. You'll find it under "Members Only" links on the left side on the Blogs and Links Page.
Here is the current chart:
Full Disclosure: I am 10% long, 0% short.
I'm required to disclose if I currently own a stock I mention and/or may buy/short it within the next 72 hours.
"Technical Analysis is a windsock, not a crystal ball." - Carl Swenlin
(c) Copyright 2025 DecisionPoint.com
Watch the latest episode of DecisionPoint Trading Room with Carl & Erin Swenlin Mondays on the DecisionPoint YouTube channel here!
NOTE: The stocks reported herein are from mechanical trading model scans that are based upon moving average relationships, momentum and volume. DecisionPoint analysis is then applied to get five selections from the scans. The selections given should prompt readers to do a chart review using their own analysis process. This letter is not a call for a specific action to buy, sell or short any of the stocks provided. There are NO sure things or guaranteed returns on the daily selection of "Diamonds in the Rough."
Regarding BUY/SELL Signals: The signal status reported herein is based upon mechanical trading model signals and crossovers. They define the implied bias of the price index/stock based upon moving average relationships and momentum, but they do not necessarily call for a specific action. They are information flags that should prompt chart review. Further, they do not call for continuous buying or selling during the life of the signal. For example, a BUY signal will probably (but not necessarily) return the best results if action is taken soon after the signal is generated. Additional opportunities for buying may be found as price zigzags higher, but the trader must look for optimum entry points. Conversely, exit points to preserve gains (or minimize losses) may be evident before the model mechanically closes the signal.
Helpful DecisionPoint Links:
Price Momentum Oscillator (PMO)
Swenlin Trading Oscillators (STO-B and STO-V)
For more links, go to DecisionPoint.com