
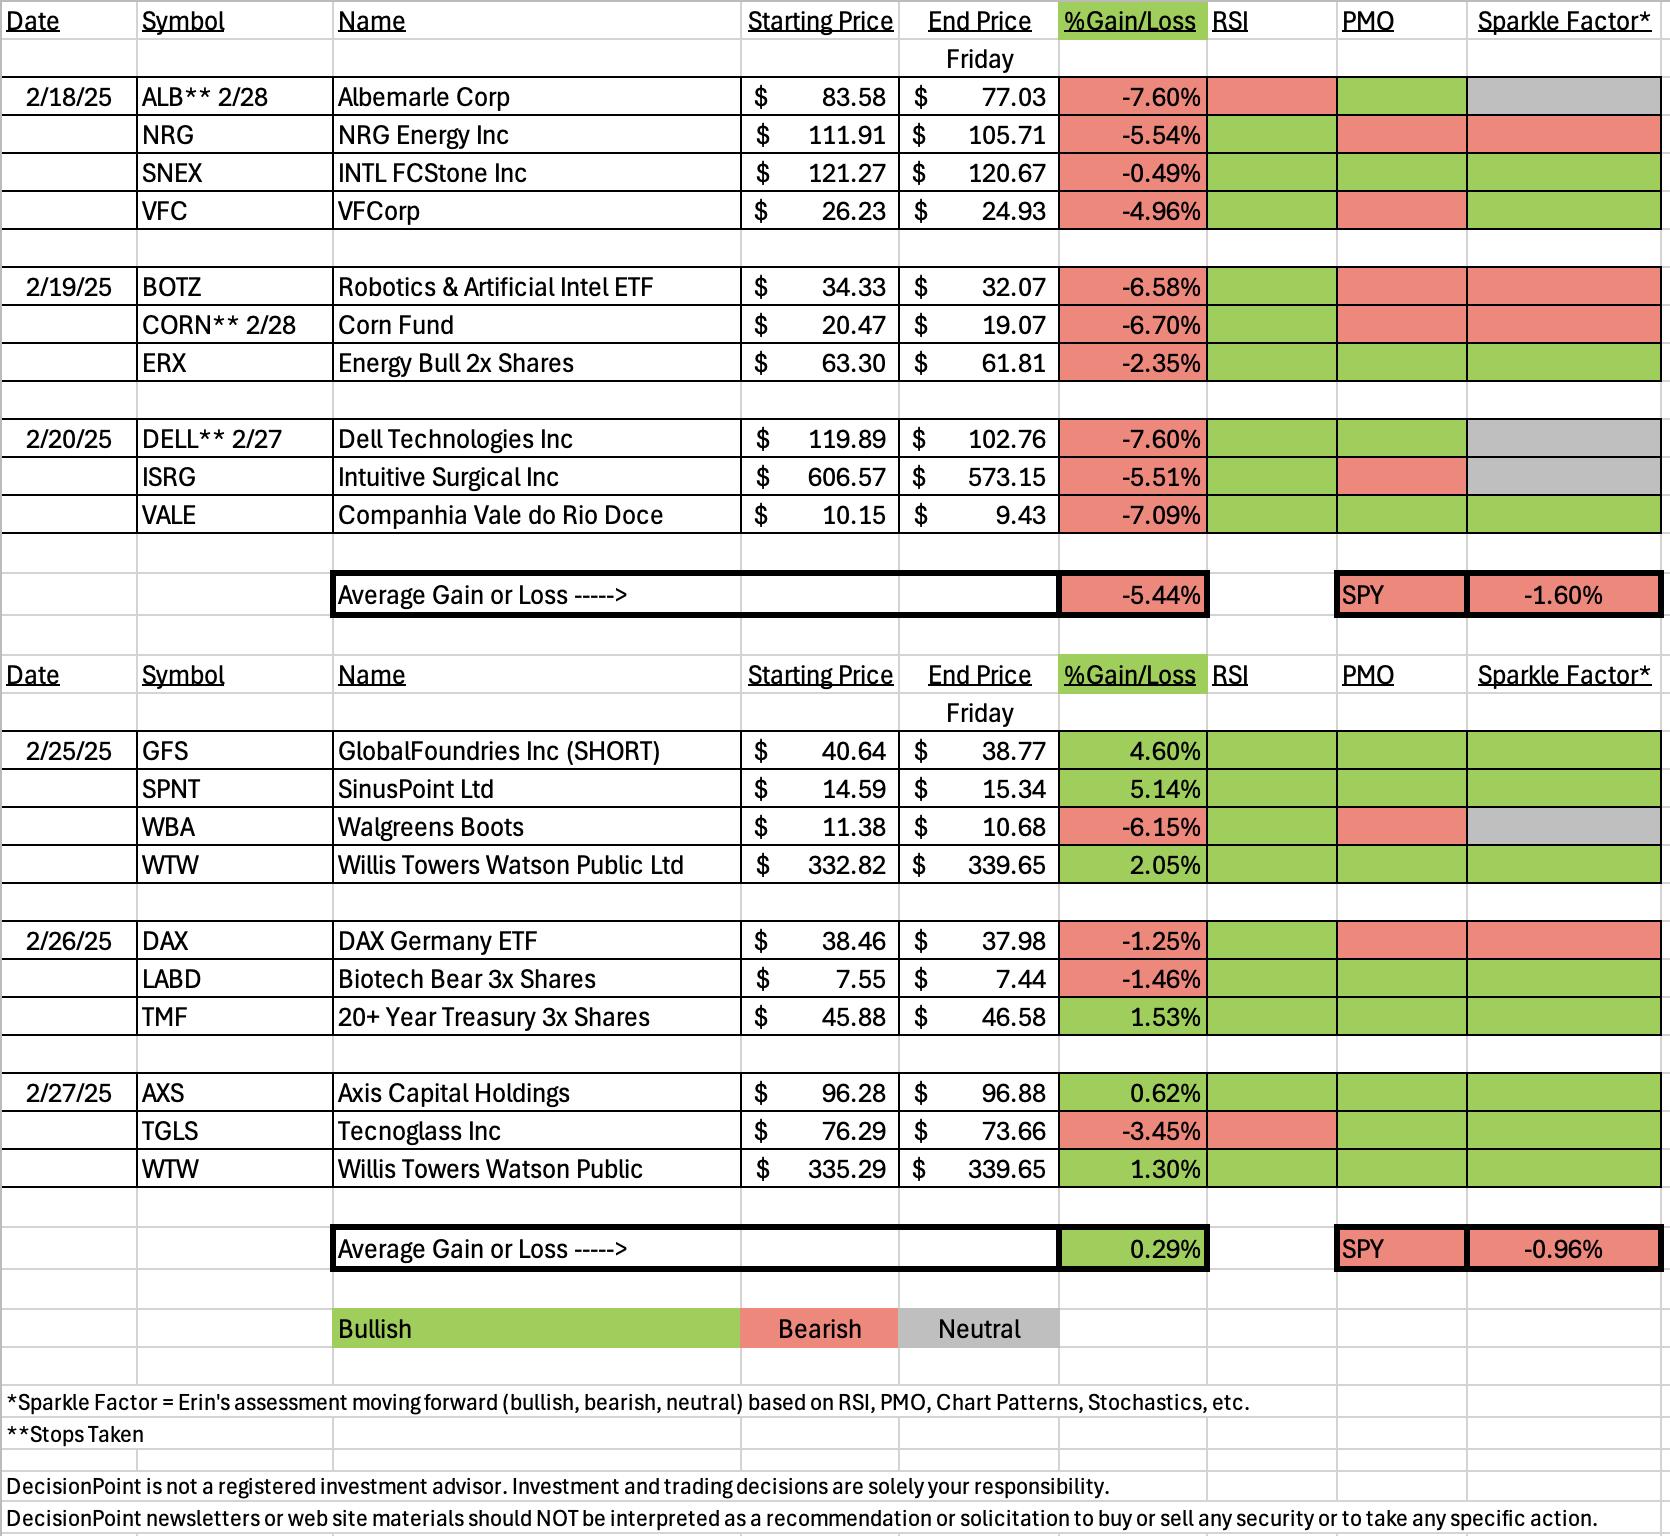
It was a rough week for the market but this week's "Diamonds in the Rough" were up on average for the week. I would say that is success even though four of the ten positions are currently negative. Last week has turned out to be a disaster after the market dropped perilously this week. It triggered stops and has all positions in the red right now. I like this week much better!
The market still looks weak so I would be considering shorts right now. We didn't have a chance to run a scan at the end of the trading room, but we did have a subscriber list of possible shorts that we reviewed. He did a great job finding some real stinkers that should continue to move down next week. Check out: ADNT, AMBC, FTRE, MNKD, MYGN, NDSN and VAC. Look for broken support lines and/or plenty of distance away from the next line of support. If Stochastics are rising, you may want to look elsewhere.
This week's Sector to Watch is Real Estate (XLRE). It has a nice rising trend going and is in the defensive area of the market. The Industry Group to Watch was actually hard to pick out as many of the groups within Real Estate look promising. I selected Residential REITs and was able to easily find a handful of stocks that look good going into next week. Still, be careful with longs in this current market environment. Symbols of interest: UMH, UDR, SUI, NXRT, AMH and ELS.
This week's "Darling" was SiriusPoint (SPNT) which finished up by 5.14% since being picked on Tuesday. The "Dud" would be Walgreens Boots (WBA) which was down 6.15% since Tuesday.
I do want to note that our only short this week on GlobalFoundries (GFS) performed well and the chart still looks bearish enough that you should be able to ride it even lower.
Have a wonderful weekend! I'll see you in the free DecisionPoint Trading Room on Monday at Noon ET!
Good Luck & Good Trading,
Erin

Diamond Mine Trading Room:
RECORDING & DOWNLOAD LINK (2/28/2025):
Topic: DecisionPoint Diamond Mine (2/28/2025) LIVE Trading Room
Recording & Download Link
Passcode: February#28
REGISTRATION for 3/7/2025:
When: March 7, 2025 09:00 AM Pacific Time (US and Canada)
Topic: DecisionPoint Diamond Mine LIVE Trading Room
Register in advance for this webinar HERE
After registering, you will receive a confirmation email containing information about joining the webinar.

Below is the latest free DecisionPoint Trading Room recording from 2/24. You'll find these recordings posted on Mondays to our DP YouTube Channel. Be sure and subscribe HERE.
A few items about the spreadsheet: I've put on the spreadsheet whether the RSI is positive (green) or negative (red). The PMO column tells you if it is rising (green) or falling (red). Finally I've added my own "Sparkle Factor" that gives you my assessment going forward, bullish (green), bearish (red) or neutral (gray). The Sparkle Factor is basically my thoughts on whether I expect it to rise or fall. A neutral means it could really go either way so it could be added to a watch list. If you're in a stock I consider "neutral" going forward, the ball is in your court.
Darling:
SiriusPoint Ltd. (SPNT)
EARNINGS: 2025-04-30 (AMC)
SiriusPoint Ltd. engages in the provision of insurance and reinsurance services. It operates through the Reinsurance, and Insurance and Services segments. The Reinsurance segment covers aviation and space, casualty, contingency, credit and bond, marine and energy, mortgage, and property. The Insurance and Services segment involves accident and health, environmental, worker's compensation, and others. The company was founded in 1945 and is headquartered in Pembroke, Bermuda.
Predefined Scans Triggered: P&F Double Bottom Breakdown and P&F Bullish Signal Reversal.
Below are the commentary and chart from Tuesday, 2/25:
"SPNT is down -4.11% in after hours trading so this one looks a little problematic if that sticks tomorrow. If it opens that far down, it may not be worth it as I'm looking for followthrough on this breakout from the declining trend. It is also bouncing off strong support. The RSI has just entered positive territory. The PMO just had a Crossover BUY Signal today. Stochastics are rising strongly. The group is showing strength against the SPY. SPNT is showing rising relative strength against both the group and the SPY. The stop is set beneath support at 7.1% or $13.55."
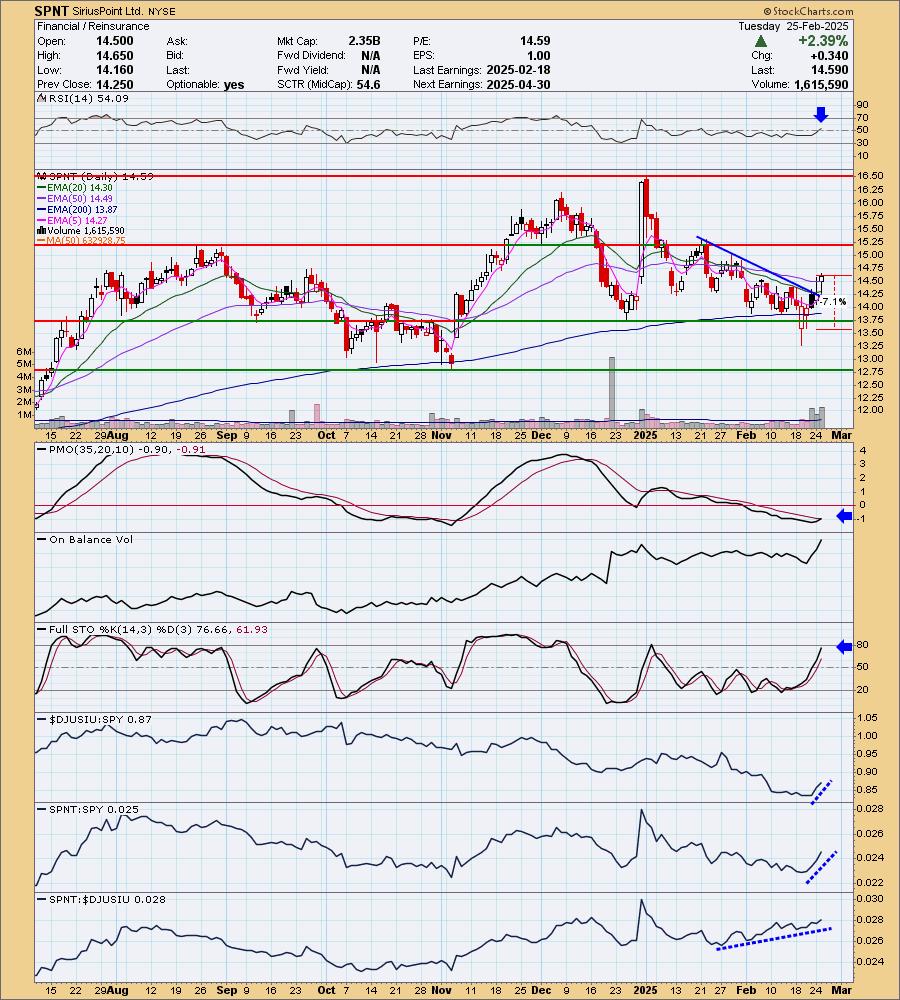
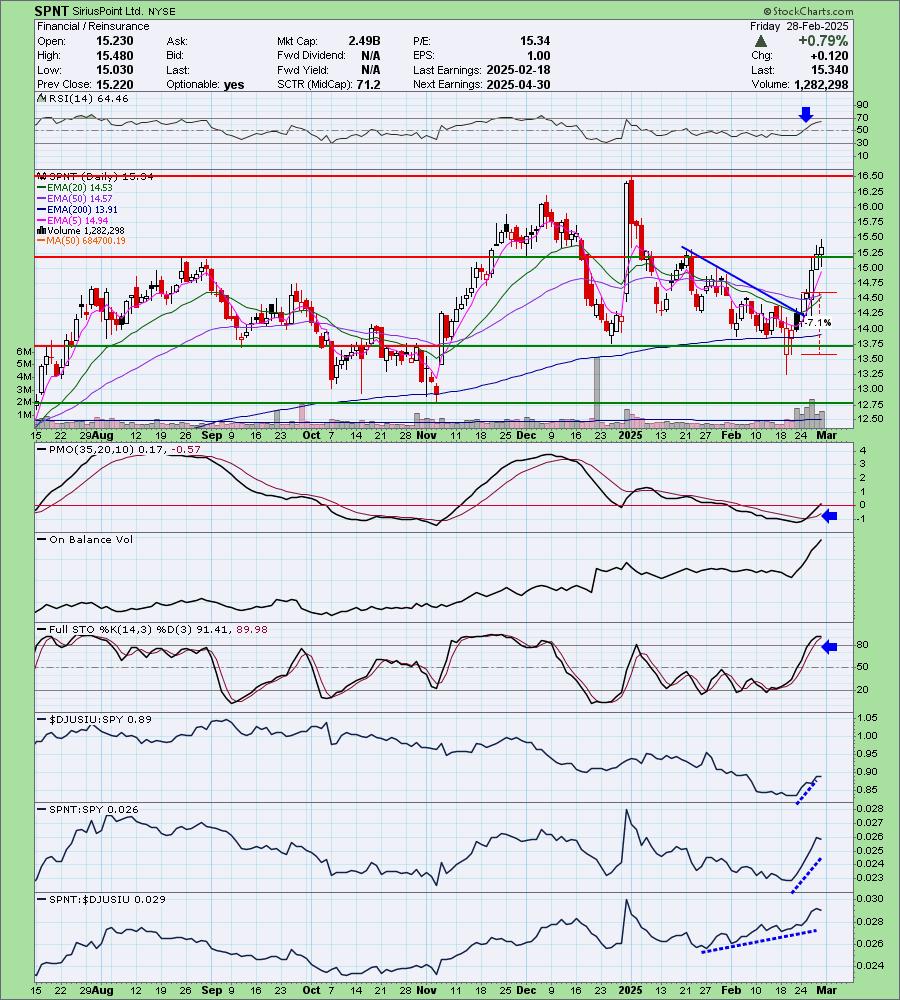
Here is today's chart:
This one is doing exactly what we want it to. The rally out of the declining trend is solid and now we have an upside breakout above resistance. The PMO is now positive and the RSI is not overbought despite the strong rally higher. It is due for a pullback, but given the RSI isn't overbought yet, I think we have some more time. It may be a bit too late to enter this one.
Don't forget, on Thursdays I look at reader-requested symbols, so shoot me an email at erin@decisionpoint.com. I read every email I receive and try to answer them all!
Dud:
Walgreens Boots Alliance, Inc. (WBA)
EARNINGS: 2025-03-27 (BMO)
Walgreens Boots Alliance, Inc. engages in the provision of healthcare and retail pharmacy services. It operates through the following segments: United States Retail Pharmacy, International, and United States Healthcare. The US Retail Pharmacy segment includes the operation of retail drugstores, health and wellness services, specialty and home delivery pharmacy services, and equity method investment. The International segment offers pharmacy-led health and beauty retail businesses outside the US and the pharmaceutical wholesaling and distribution business in Germany. The US Healthcare segment delivers improved health outcomes and lower costs for payors and providers through owned and partnered assets. The company was founded by Charles R. Walgreen and John Boot in 1909 and is headquartered in Deerfield, IL.
Predefined Scans Triggered: New CCI Buy Signals.
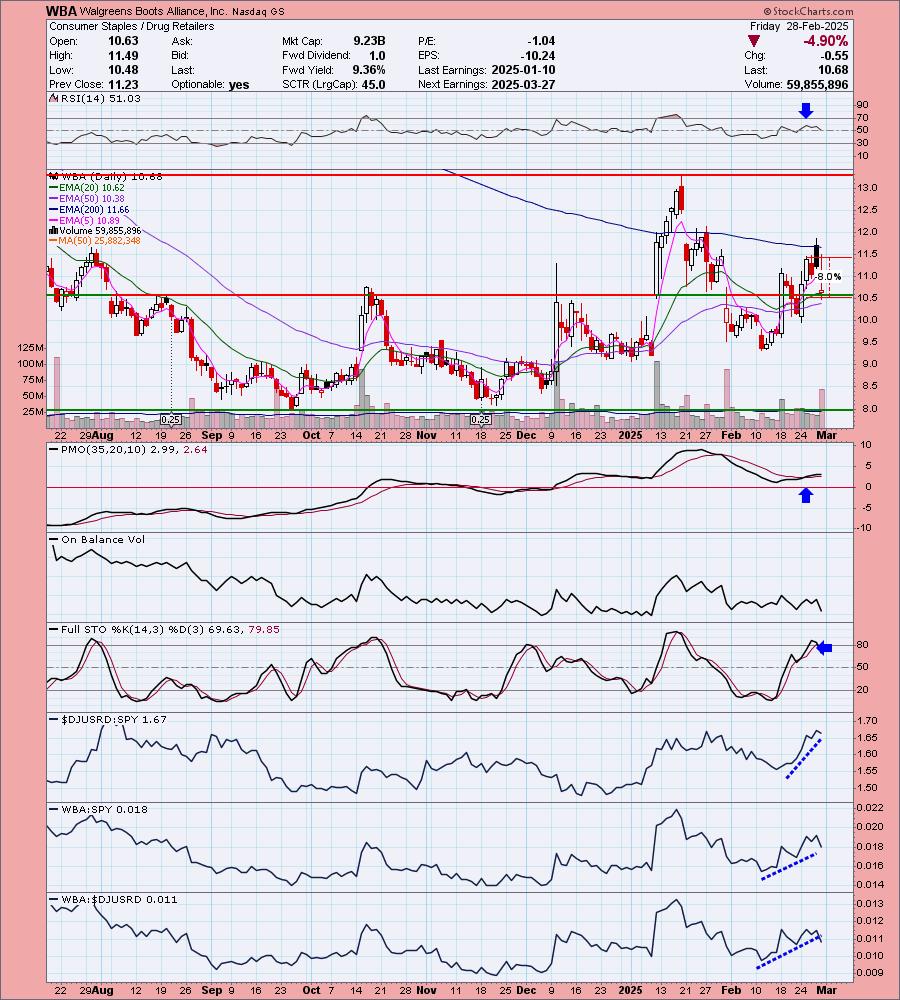
Below are the commentary and chart from Tuesday, 2/25:
"WBA is down -0.26% in after hours trading. I like the breakout here on two strong up days. It is a reversal candidate as price is below the 200-day EMA. The RSI looks good in positive territory and not overbought. The PMO is rising on a new Crossover BUY Signal. Stochastics are rising in positive territory. Relative strength looks very good with all relative strength lines rising strongly. The stop is a bit deep, but I wanted it to line up below support so I set it at 8% or $10.46."

Here is today's chart:
I really liked this chart on Tuesday and was actually tempted to buy it given it had so much upside potential. Unfortunately we got a bearish filled black candlestick that led to a deep decline today. I have listed this one with a Neutral Sparkle Factor primarily because the rising trend hasn't been broken and price is at support. I see it as a hold or a slightly risky buy right now given the PMO topped. I think it still has some merit, we just picked the wrong time to add it. If it rallies here I do think it would be buyable.
THIS WEEK's Performance:
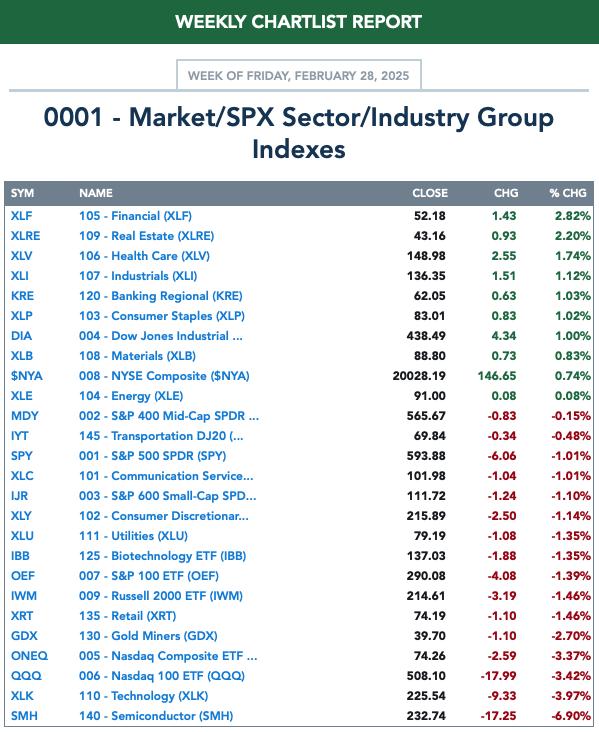
DecisionPoint Market Scoreboard (Mechanical Trend Model Signals):
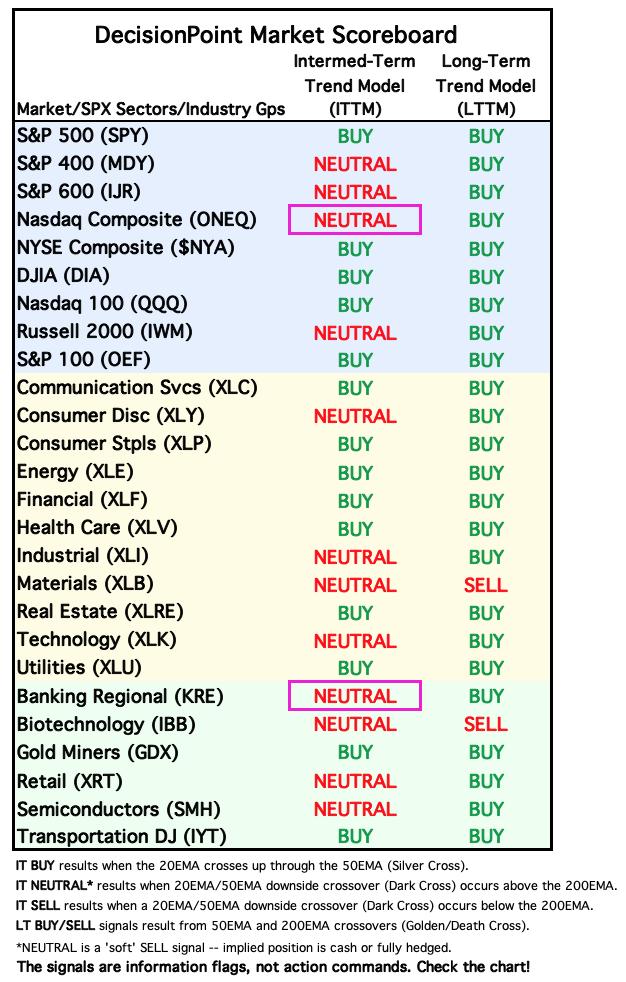
Friday signal changes are outlined in purple.
Click Here to view Carl's annotated "Under the Hood" ChartList!
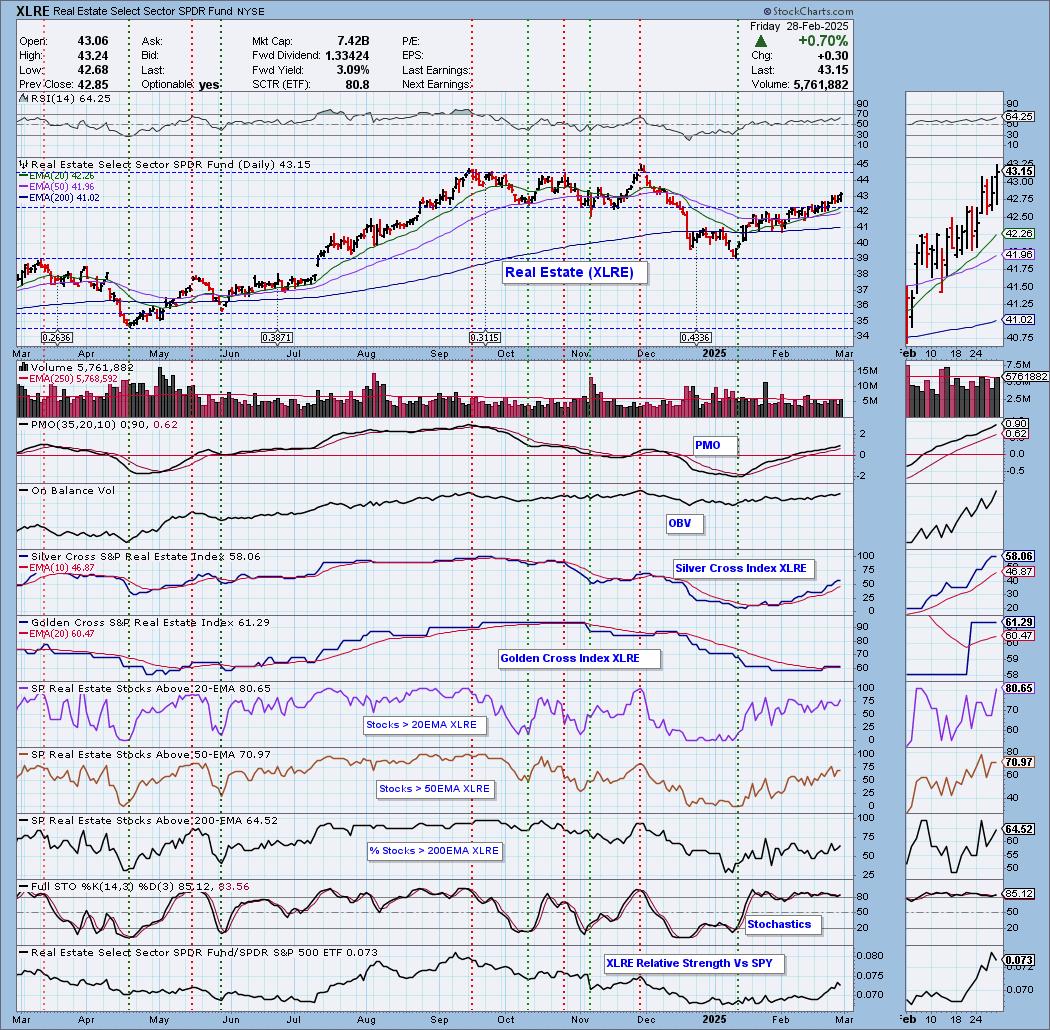
Sector to Watch: Real Estate (XLRE)
When we looked at the charts in the trading room, we had a tie between XLF and XLRE for Sector to Watch. Drilling down under the hood, we determined that XLRE had a better setup as participation is angling higher not lower. We also have a nice rally that isn't getting ahead of itself as the RSI is still not overbought. The Silver Cross Index and Golden Cross Index are above their signal lines for a bullish bias in both the IT and LT. Stochastics are camped out above 80 and relative strength is rising. This is setup well going into next week and being a defensive area of the market, it should weather a SPY storm.
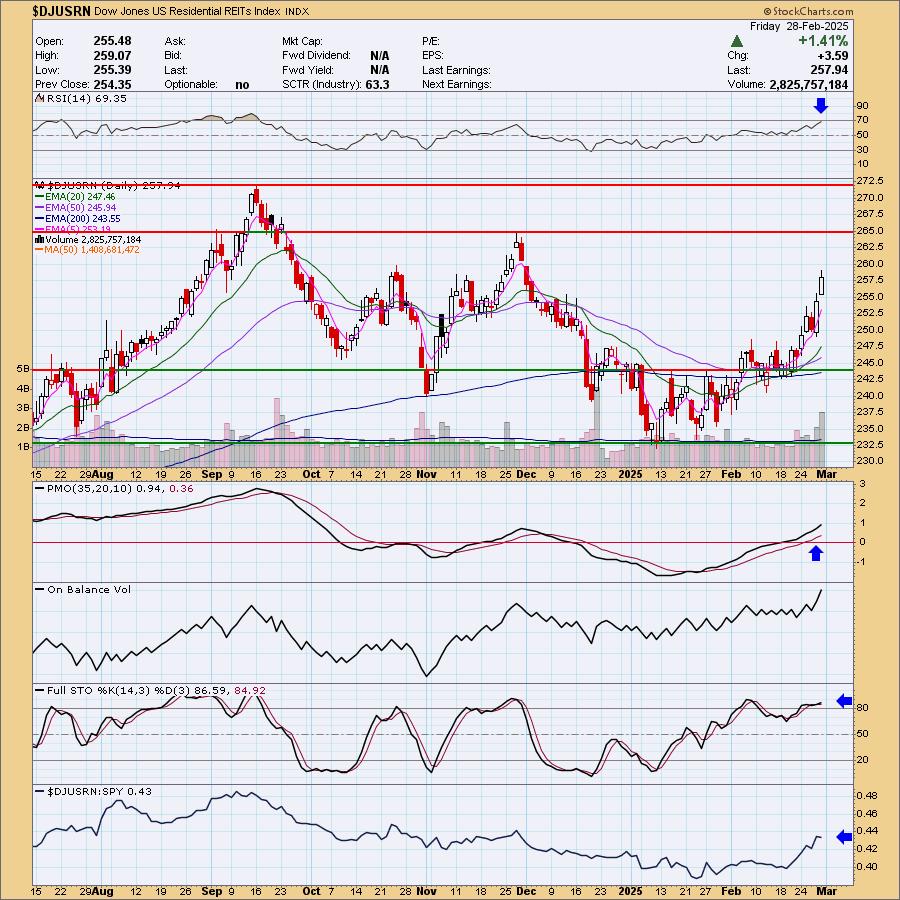
Industry Group to Watch: Residential REITs ($DJUSPL)
The one issue I had with this group is that it is getting overbought on the RSI. However, this rally seems to be picking up speed and could see it move even higher from here given the positive indicators. The PMO is showing new strength and Stochastics are holding above 80. It could be due for a pullback, but the charts we found in this area look good for more upside followthrough: UMH, UDR, SUI, NXRT, AMH and ELS. Again, be careful with expanding exposure.
Go to our Under the Hood ChartList on DecisionPoint.com to get an in-depth view of all the sectors. On StockCharts.com you can find the Industry Summary.
Good Luck & Good Trading!
- Erin
erin@decisionpoint.com
Full Disclosure: I'm 10% long, 0% short.
Watch the latest episode of the DecisionPoint Trading Room with Carl & Erin Swenlin HERE!
Technical Analysis is a windsock, not a crystal ball. --Carl Swenlin
NOTE: The stocks reported herein are from mechanical trading model scans that are based upon moving average relationships, momentum and volume. DecisionPoint analysis is then applied to get selections from the scans. The selections given should prompt readers to do a chart review using their own analysis process. This letter is not a call for a specific action to buy, sell or short any of the stocks provided. There are NO sure things or guaranteed returns on the selection of "diamonds in the rough."
Helpful DecisionPoint Links:
DecisionPoint Shared ChartList and DecisionPoint Chart Gallery
Price Momentum Oscillator (PMO)
Swenlin Trading Oscillators (STO-B and STO-V)
(c) Copyright 2025 DecisionPoint.com