
All of the Reader Requests today came in on the long side. I had hoped we'd see some shorting opportunities as the market trend is clearly down right now. Consequently, even though these selections look bullish, they will be bucking the short-term trend of the market and that could make it difficult to garner as much upside as we'd like.
Admittedly, my Diamond Dog Scan which finds shorting opportunities didn't produce a great deal of results. The market is turning over but we're not seeing as many stocks with very bearish setups. Overall I would continue to be careful expanding exposure. As you can see, I continue to have low exposure as I don't want to go long when the market trend is down and the market is topping. However, I did like today's longs after all.
Two of them are in the Insurance space which I do like. One of the requests was KIE, the Insurance ETF and I have to say it does look bullish right now.
The third is an Industrial in Building Materials. I'm little less confident about this selection given the look of the Industrials sector chart, but maybe this one will continue to outperform regardless of the sector.
Set those stops and honor them if they hit. This isn't a time to be talking yourself into positions.
Tomorrow is the Diamond Mine trading room so be sure and register. I'll see you at Noon ET!
Good Luck & Good Trading,
Erin
Today's "Diamonds in the Rough": AXS, TGLS and WTW.
Other requests: BCS, KAR, RITM, ABEV, FMX, FTI and KIE.

Diamond Mine Trading Room:
RECORDING & DOWNLOAD LINK (2/21/2025):
Topic: DecisionPoint Diamond Mine (2/21/2025) LIVE Trading Room
Download & Recording Link
Passcode: February#21
REGISTRATION for 2/28/2025:
When: February 28, 2025 09:00 AM Pacific Time (US and Canada)
Topic: DecisionPoint Diamond Mine LIVE Trading Room
Register in advance for this webinar HERE
After registering, you will receive a confirmation email containing information about joining the webinar.

Below is the latest free DecisionPoint Trading Room recording from 2/24. You'll find these recordings posted on Mondays to our DP YouTube Channel. Be sure and subscribe HERE.
Welcome to DecisionPoint Diamonds, wherein I highlight ten "Diamonds in the Rough" per week. These are selected from the results of my DecisionPoint Scans which search for stocks that could benefit from the trend and condition of the market. Remember, these are not recommendations to buy or sell, but are the most interesting of the stocks that surfaced in my scans. My objective is to save you the work of the initial, tedious culling process, but you need to apply your own analysis to see if these stocks pique your interest as well. There are no guaranteed winners here!
"Predefined Scans Triggered" are taken from StockCharts.com using the "Symbol Summary" option instead of a "SharpChart" on the workbench.
Stop levels are all rounded down.
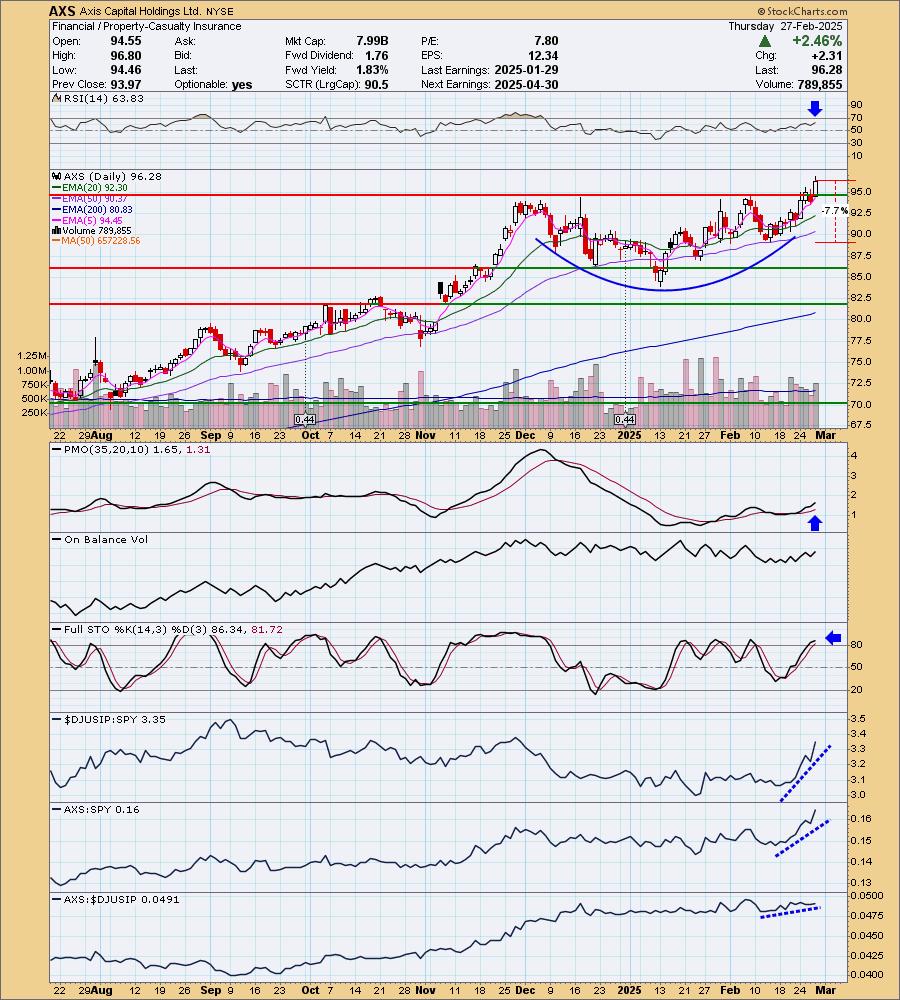
Axis Capital Holdings Ltd. (AXS)
EARNINGS: 2025-04-30 (AMC)
AXIS Capital Holdings Ltd. engages in the provision of various insurance and reinsurance products and services. It operates through the Insurance and Reinsurance segments. The Insurance segment offers property, marine, terrorism, aviation, political risk, professional lines, liability, accident, and health insurance products. The Reinsurance segment offers non-life treaty reinsurance to insurance companies. The company was founded on December 9, 2002, and is headquartered in Pembroke, Bermuda.
Predefined Scans Triggered: Moved Above Upper Bollinger Band, Elder Bar Turned Green, Moved Above Upper Price Channel, P&F Double Top Breakout, P&F Triple Top Breakout and New 52-week Highs.
AXS is unchanged in after hours trading. I liked the breakout to new 52-week highs and the nice base that it has built before today's breakout move. The RSI is positive and the PMO is accelerating higher. Stochastics are above 80 and are still rising. Relative strength is really picking up for the industry group. AXS is carefully outperforming the group and it is on fire against the SPY. The stop is set below the prior low at 7.7% or $88.86.
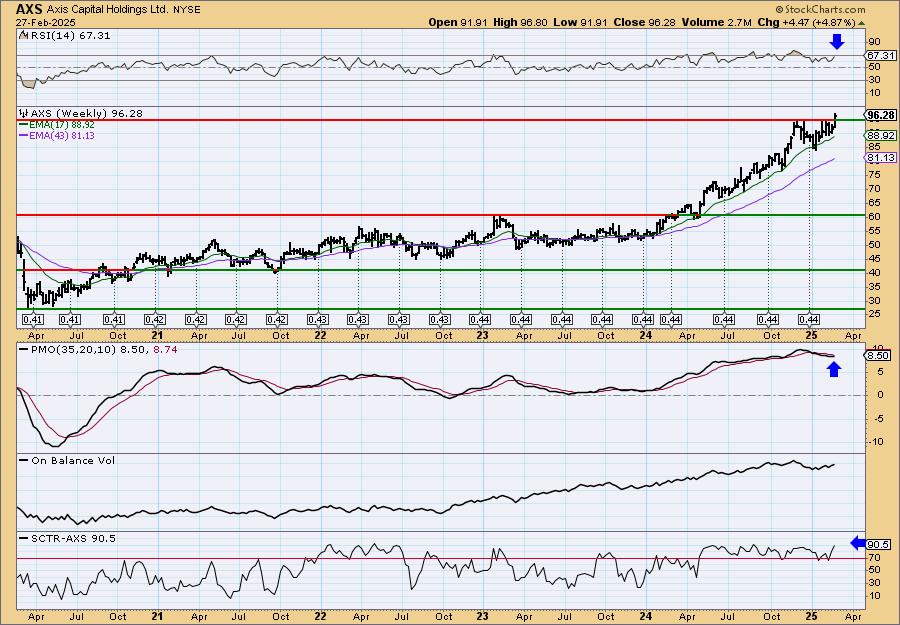
This also looks like an all-time high for AXS on the breakout. The weekly RSI is positive and not yet overbought. The weekly PMO has just turned back up. The StockCharts Technical Rank (SCTR) is well within the hot zone* above 70. Consider a 17% upside target to about $112.65.
*If a stock is in the "hot zone" above 70, it implies that it is stronger than 70% of its universe (large-, mid-, small-caps and ETFs) primarily in the intermediate to long terms.
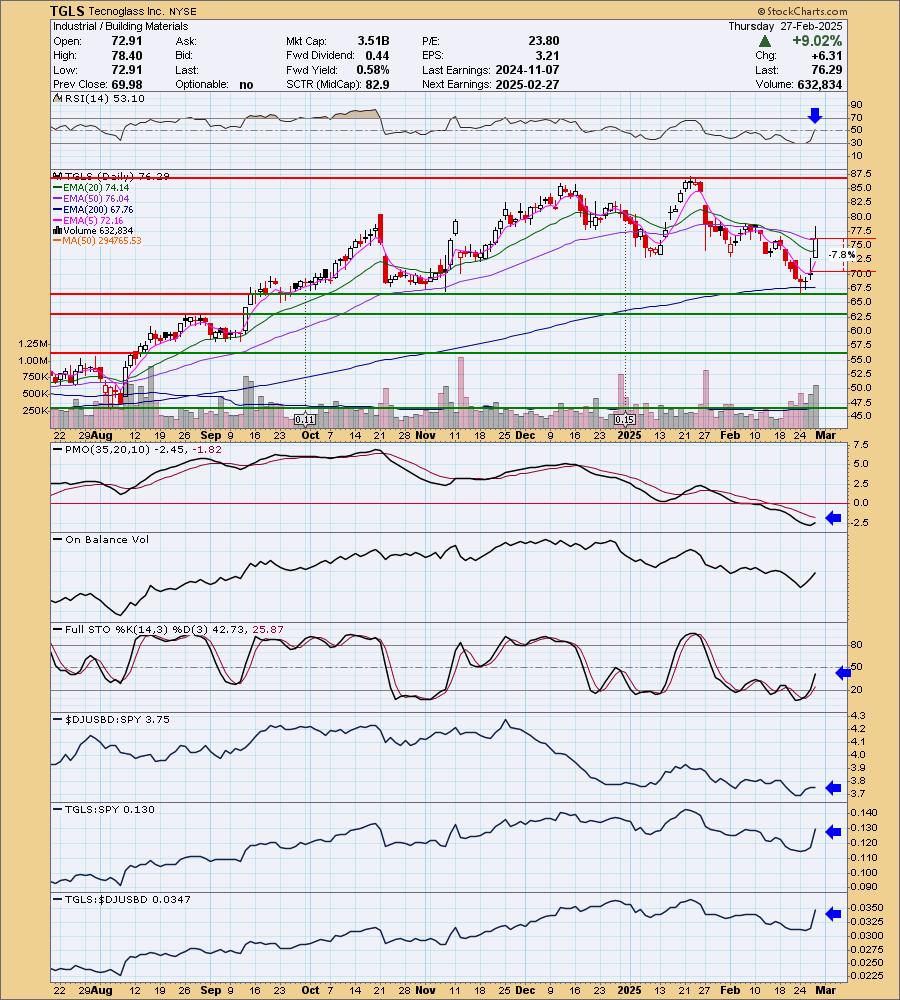
Tecnoglass Inc. (TGLS)
EARNINGS: 2025-02-27 (BMO) ** Reported Today **
Tecnoglass, Inc. is a holding company, which engages in the design, manufacturing, distribution, marketing, and installation of architectural glass, windows and associated aluminum products for the global commercial and residential construction market. It operates through the following geographical segments: Colombia, United States, Panama, and Other. The company was founded in 1994 and is headquartered in Barranquilla, Colombia.
Predefined Scans Triggered: Elder Bar Turned Green, Parabolic SAR Buy Signals and P&F Low Pole.
TGLS is unchanged in after hours trading. I really was impressed with the reversal off horizontal support and 200-day EMA support. Earnings were well received and that should keep price moving higher from here, although I wouldn't be surprised if we get a small pullback tomorrow. The RSI just entered positive territory and the PMO has now turned up in oversold territory. Stochastics are rising strongly although not in positive territory yet. This rally pop has pushed its relative strength lines higher. The group is starting to see some outperformance against the SPY. The stop is set as close to support as I could get it without going past 8%. I selected 7.8% or $70.33.
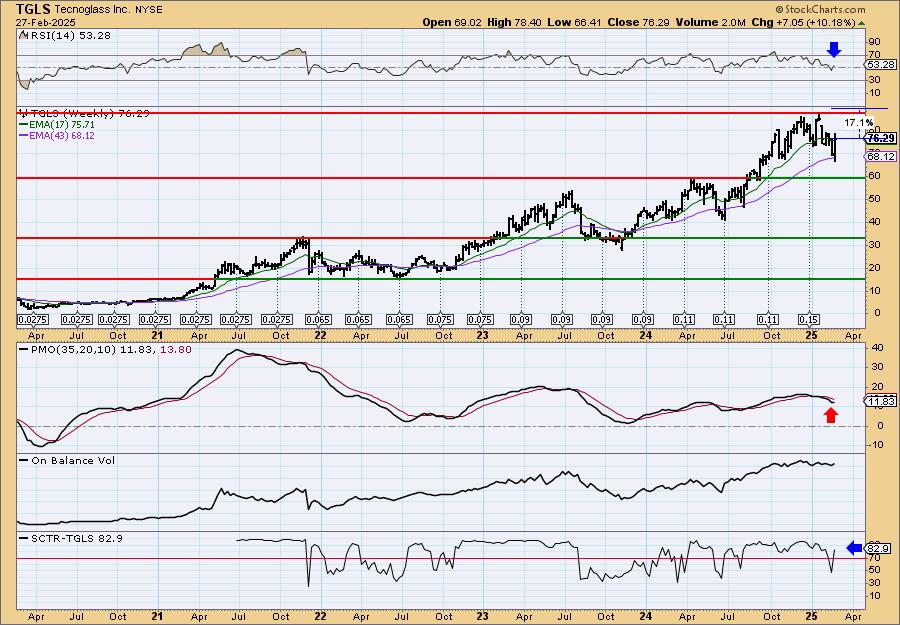
The weekly chart admittedly looks very bearish as far as price action. This does look like a big rounded top and that could be difficult to get out of so keep this one in the short-term timeframe for now. The weekly PMO is still in decline. We are seeing some improvements though. The weekly RSI is in positive territory and the SCTR is now in the hot zone.
Willis Towers Watson Public Ltd. Co. (WTW)
EARNINGS: 2025-04-24 (BMO)
Willis Towers Watson Plc engages in the provision of advisory, broking, and solutions services. It operates through the following segments: Health, Wealth, and Career (HCW), Risk and Broking (R&B), and Corporate and Other. The HCW segment provides an array of advice, broking, solutions, and technology for employee benefit plans, institutional investors, compensation and career programs, and the employee experience overall. The R&B segment focuses on a broad range of risk advice, insurance brokerage, and consulting services to clients globally, ranging from small businesses to multinational corporations. The company was founded in 1828 and is headquartered in London, the United Kingdom.
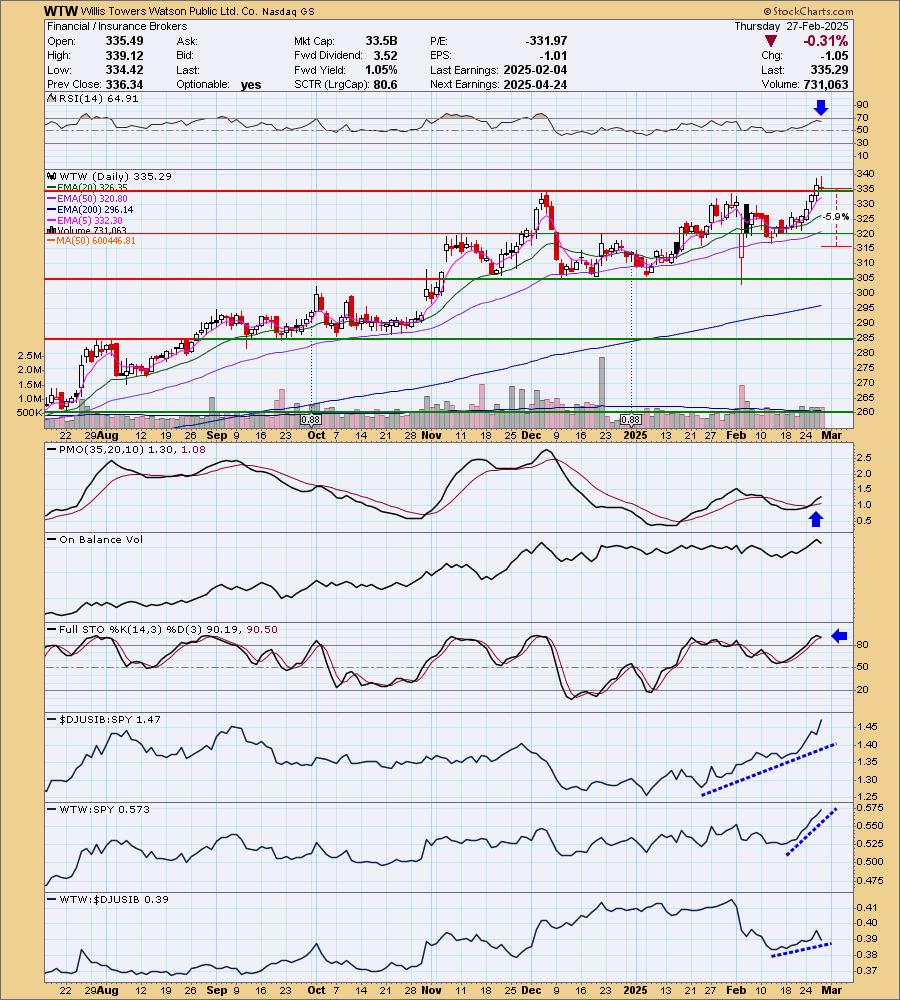
Predefined Scans Triggered: P&F Triple Top Breakout, New 52-week Highs and P&F Double Top Breakout.
WTW is unchanged in after hours trading. The breakout is what impressed me and the fact that it is still making new 52-week highs. We should see followthrough. The RSI is positive and not overbought. The PMO is rising on a Crossover BUY Signal above the zero line. Stochastics did turn down today, but remain above 80 indicating internal strength. The industry group is really outperforming right now. WTW is outperforming the group and the SPY. I set the stop below the previous low. It doesn't need to be deep which is another thing I like about the chart. I chose 5.9% or $315.50.
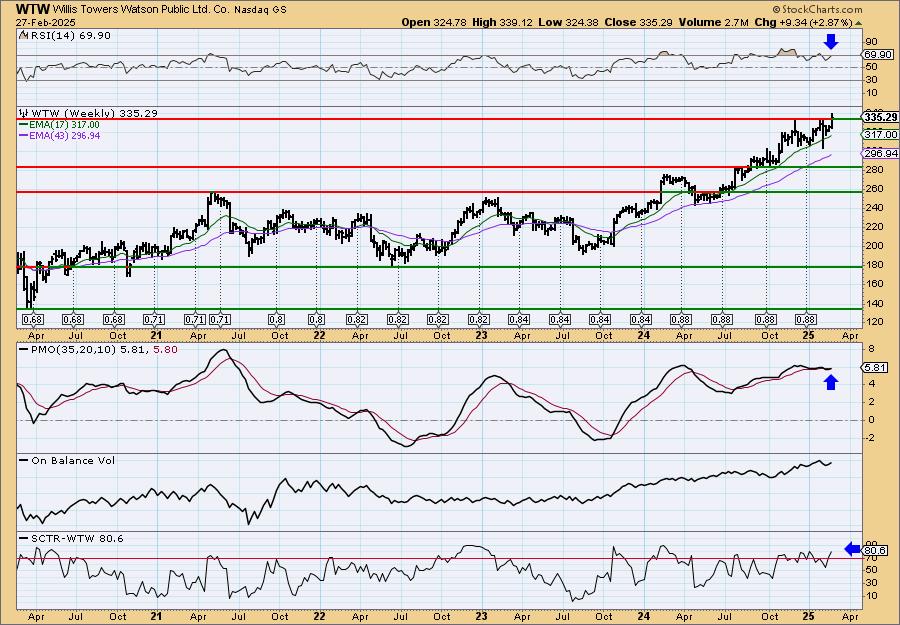
The weekly chart looks very favorable. We have a strong rising trend out of the prior trading range. The weekly RSI is close to overbought but that condition was held for some time before. The weekly PMO is on a new Crossover BUY Signal and is bullishly flat above the signal line implying pure strength. The SCTR is in the hot zone. Consider a 17% upside target to about $392.29.
Don't forget, on Thursdays I look at reader-requested symbols, click HERE to send me an email. I read every email I receive and try to answer them all!
Current Market Outlook:
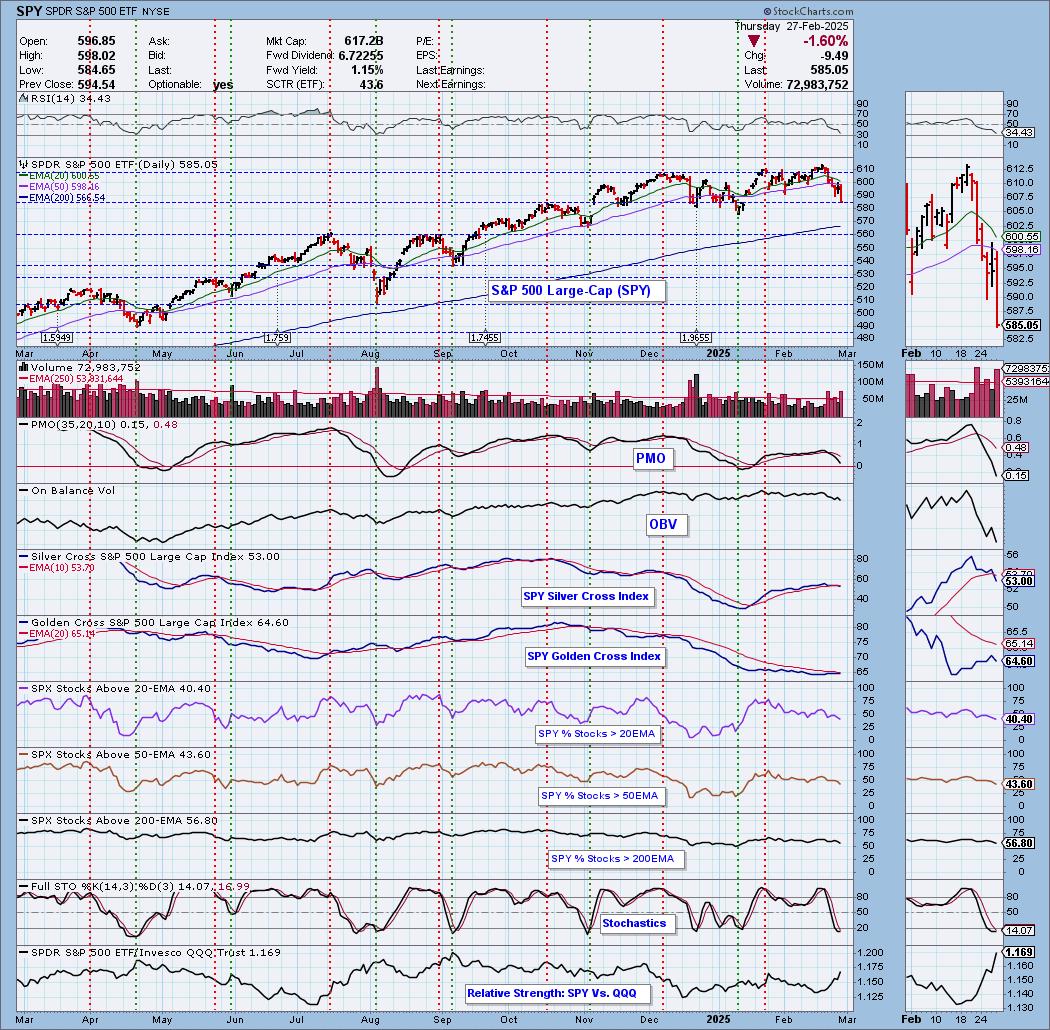
Market Environment: It is important to consider the odds for success by assessing the market tides. The following chart uses different methodologies for objectively showing the depth and trend of participation for intermediate- and long-term time frames.
- The Silver Cross Index (SCI) shows the percentage of SPX stocks on IT Trend Model BUY signals (20-EMA > 50-EMA)
- The Golden Cross Index (GCI) shows the percentage of SPX stocks on LT Trend Model BUY signals (50-EMA > 200-EMA)
Don't forget that as a "Diamonds" member, you have access to our "Under the Hood" curated ChartList on DecisionPoint.com. You'll find it under "Members Only" links on the left side on the Blogs and Links Page.
Here is the current chart:
Full Disclosure: I am 10% long, 0% short.
I'm required to disclose if I currently own a stock I mention and/or may buy/short it within the next 72 hours.
"Technical Analysis is a windsock, not a crystal ball." - Carl Swenlin
(c) Copyright 2025 DecisionPoint.com
Watch the latest episode of DecisionPoint Trading Room with Carl & Erin Swenlin Mondays on the DecisionPoint YouTube channel here!
NOTE: The stocks reported herein are from mechanical trading model scans that are based upon moving average relationships, momentum and volume. DecisionPoint analysis is then applied to get five selections from the scans. The selections given should prompt readers to do a chart review using their own analysis process. This letter is not a call for a specific action to buy, sell or short any of the stocks provided. There are NO sure things or guaranteed returns on the daily selection of "Diamonds in the Rough."
Regarding BUY/SELL Signals: The signal status reported herein is based upon mechanical trading model signals and crossovers. They define the implied bias of the price index/stock based upon moving average relationships and momentum, but they do not necessarily call for a specific action. They are information flags that should prompt chart review. Further, they do not call for continuous buying or selling during the life of the signal. For example, a BUY signal will probably (but not necessarily) return the best results if action is taken soon after the signal is generated. Additional opportunities for buying may be found as price zigzags higher, but the trader must look for optimum entry points. Conversely, exit points to preserve gains (or minimize losses) may be evident before the model mechanically closes the signal.
Helpful DecisionPoint Links:
Price Momentum Oscillator (PMO)
Swenlin Trading Oscillators (STO-B and STO-V)
For more links, go to DecisionPoint.com