
The ETF scans did manage to produce some results, but not as many as I would like. Still, I did find some interesting selections for you today.
I noticed Bond funds coming up in the scans. Most of these funds don't provide much upside and are slow movers so I went out on my own and found a leveraged Bond fund for the 30+ year treasuries (TMF).
Another theme was international ETFs so I picked the Germany ETF (DAX) as it has been on a tear higher.
The last pick is the Biotechnology 3x Bear ETF (LABD). I don't like how they are lining up right now with losing participation. I do still like Healthcare and I actually had two Healthcare ETFs come up on the scans. Biotechs however do not look good.
Tomorrow is Reader Request Day so be sure to get your selections in soon! I haven't had a lot to choose from of late so hoping some of you will come out of the woodwork and give it try!
Good Luck & Good Trading,
Erin
Today's "Diamonds in the Rough": DAX, LABD and TMF.

Diamond Mine Trading Room:
RECORDING & DOWNLOAD LINK (2/21/2025):
Topic: DecisionPoint Diamond Mine (2/21/2025) LIVE Trading Room
Download & Recording Link
Passcode: February#21
REGISTRATION for 2/28/2025:
When: February 28, 2025 09:00 AM Pacific Time (US and Canada)
Topic: DecisionPoint Diamond Mine LIVE Trading Room
Register in advance for this webinar HERE
After registering, you will receive a confirmation email containing information about joining the webinar.

Below is the latest free DecisionPoint Trading Room recording from 2/24. You'll find these recordings posted on Mondays to our DP YouTube Channel. Be sure and subscribe HERE.
Welcome to DecisionPoint Diamonds, wherein I highlight ten "Diamonds in the Rough" per week. These are selected from the results of my DecisionPoint Scans which search for stocks that could benefit from the trend and condition of the market. Remember, these are not recommendations to buy or sell, but are the most interesting of the stocks that surfaced in my scans. My objective is to save you the work of the initial, tedious culling process, but you need to apply your own analysis to see if these stocks pique your interest as well. There are no guaranteed winners here!
"Predefined Scans Triggered" are taken from StockCharts.com using the "Symbol Summary" option instead of a "SharpChart" on the workbench.
Stop levels are all rounded down.
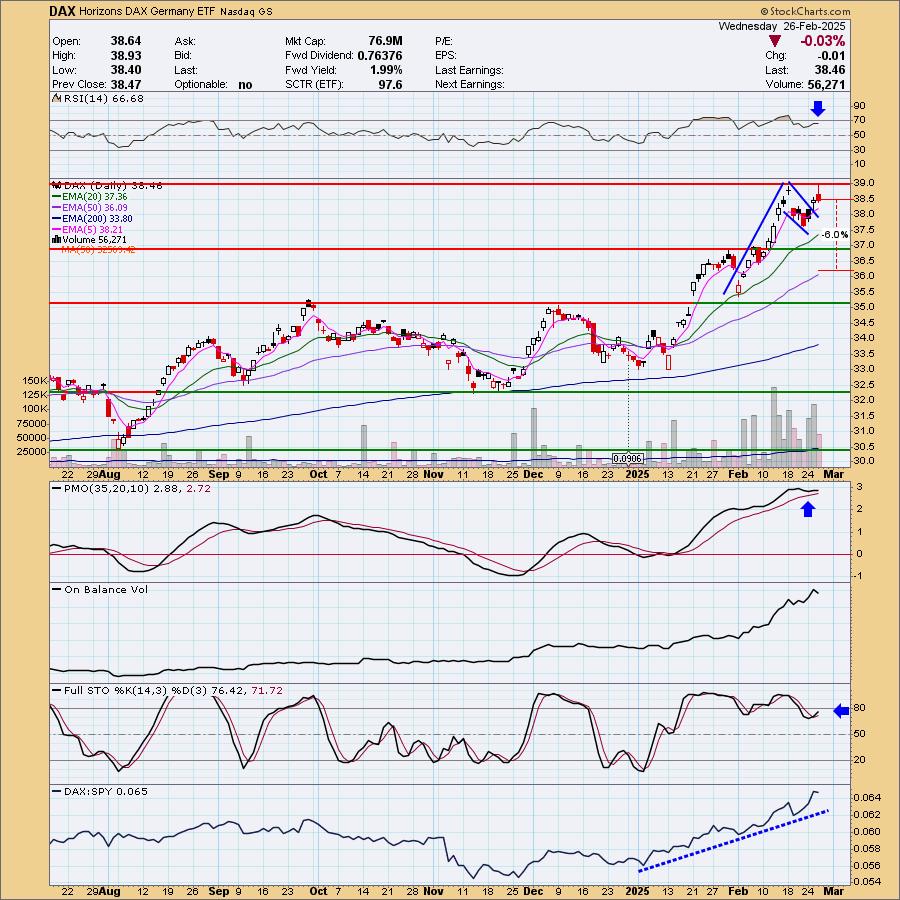
Horizons DAX Germany ETF (DAX)
EARNINGS: N/A
DAX tracks a market-cap-weighted, total return index of the 30 largest and most liquid securities traded on the Frankfurt Exchange. Click HERE for more information.
Predefined Scans Triggered: New CCI Buy Signals, Elder Bar Turned Blue, P&F Double Top Breakout and New 52-week Highs.
DAX is up +2.39% in after hours trading so we may be onto something here. I noticed a bull flag formation on this rally out of a trading range. The RSI is positive and not overbought. The PMO is at a very high level and has just seen a Surge above the signal line. Stochastics have turned up and we can see clear outperformance by the ETF. You don't need a very deep stop, you could thin it out from what I have. I chose a level at the 50-day EMA at 6% or $36.15.
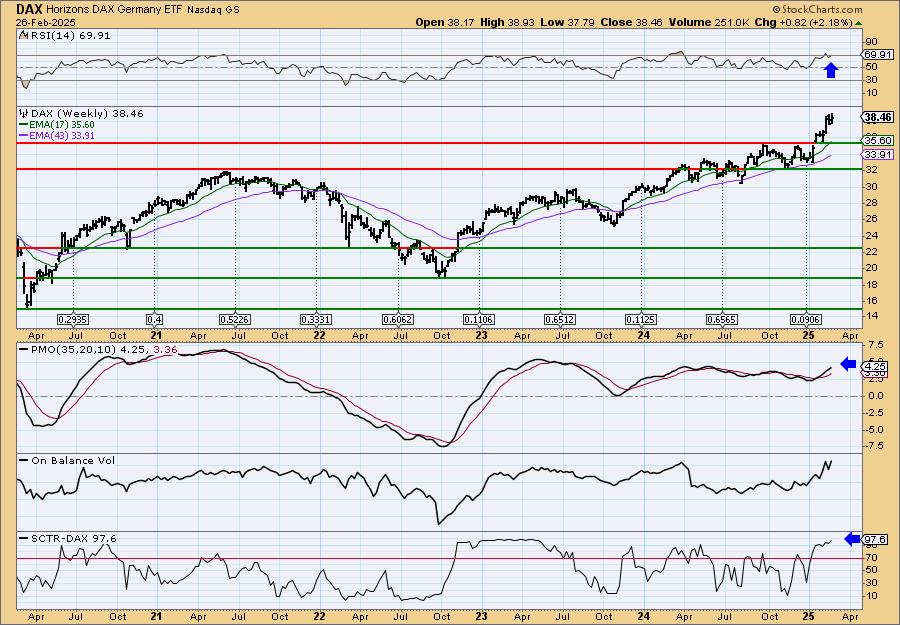
I like the steady rising trend. It has accelerated and that will be more difficult to maintain, but the indicators are set up very well for a continuation. The weekly RSI is not quite overbought yet. The weekly PMO is rising on a Crossover BUY Signal. The StockCharts Technical Rank (SCTR) is at the top of the hot zone*. Consider a 17% upside target to about $45.00.
*If a stock is in the "hot zone" above 70, it implies that it is stronger than 70% of its universe (large-, mid-, small-caps and ETFs) primarily in the intermediate to long terms.
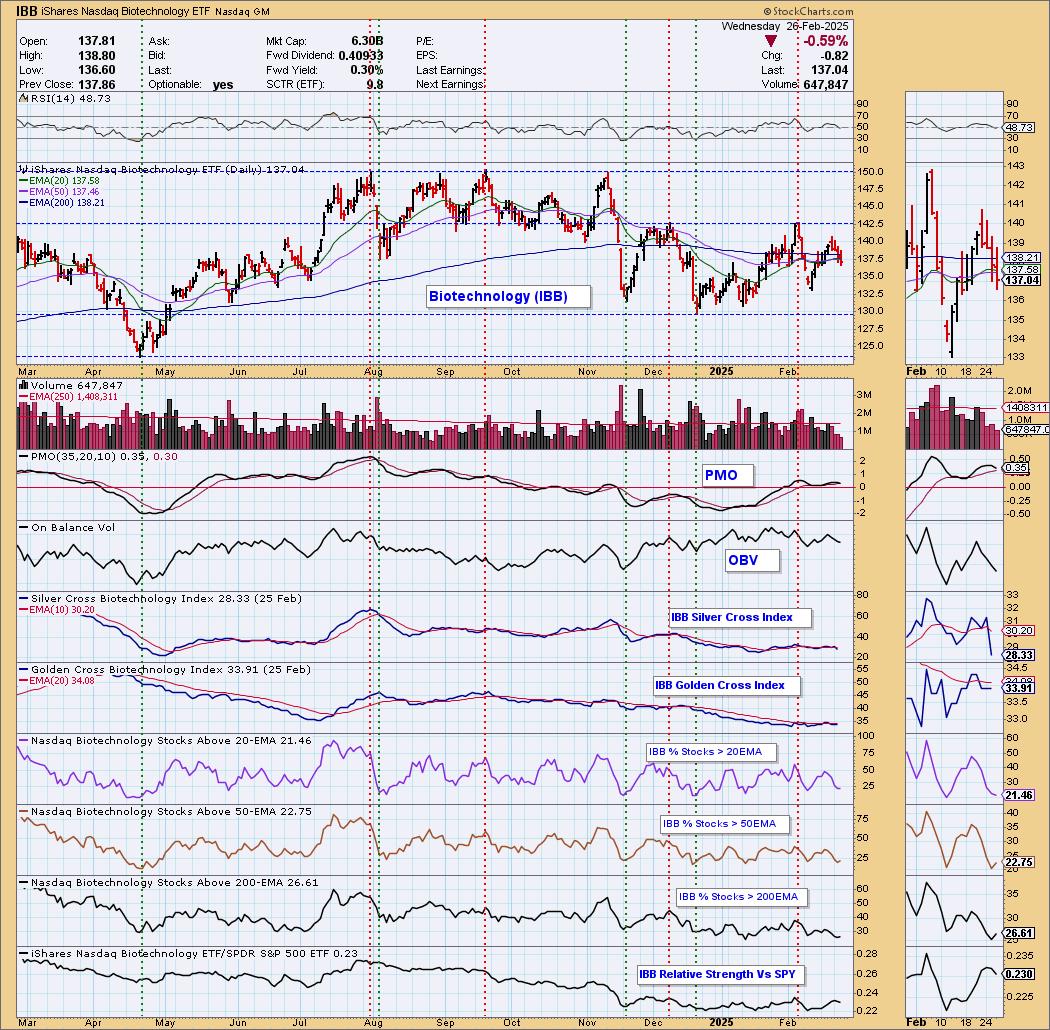
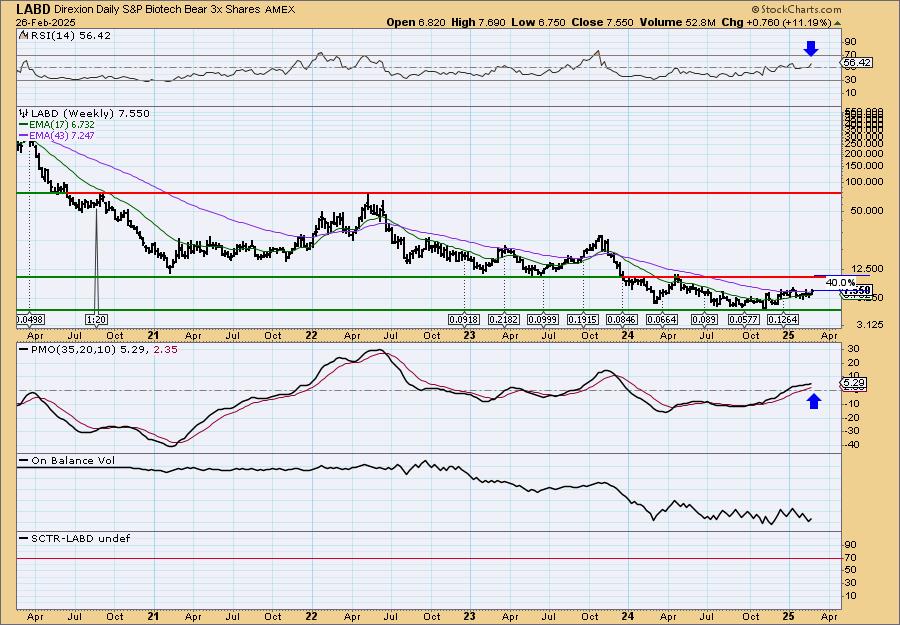
Direxion Daily S&P Biotech Bear 3x Shares (LABD)
EARNINGS: N/A
LABD provides daily 3 times inverse exposure to the S&P Biotechnology Select Industry Index. Click HERE for more information.
Predefined Scans Triggered: Stocks in a New Uptrend (Aroon).
LABD is down -1.19% in after hours trading. I think it best to start with the Biotechnology "Under the Hood" Chart so you can see the weakness in participation. Notice that price was unable to test overhead resistance before turning back down. The PMO has topped and the RSI just moved into negative territory. The Silver Cross Index has had a Bearish Shift across the signal line. It doesn't look good.
LABD is at overhead resistance but given what we see above, it should be able to overcome. The RSI is positive and not overbought and the PMO is on a new Crossover BUY Signal. Stochastics just moved above 80 and we see improved relative strength. I've set the stop beneath the 20-day EMA at 8% or $6.94.
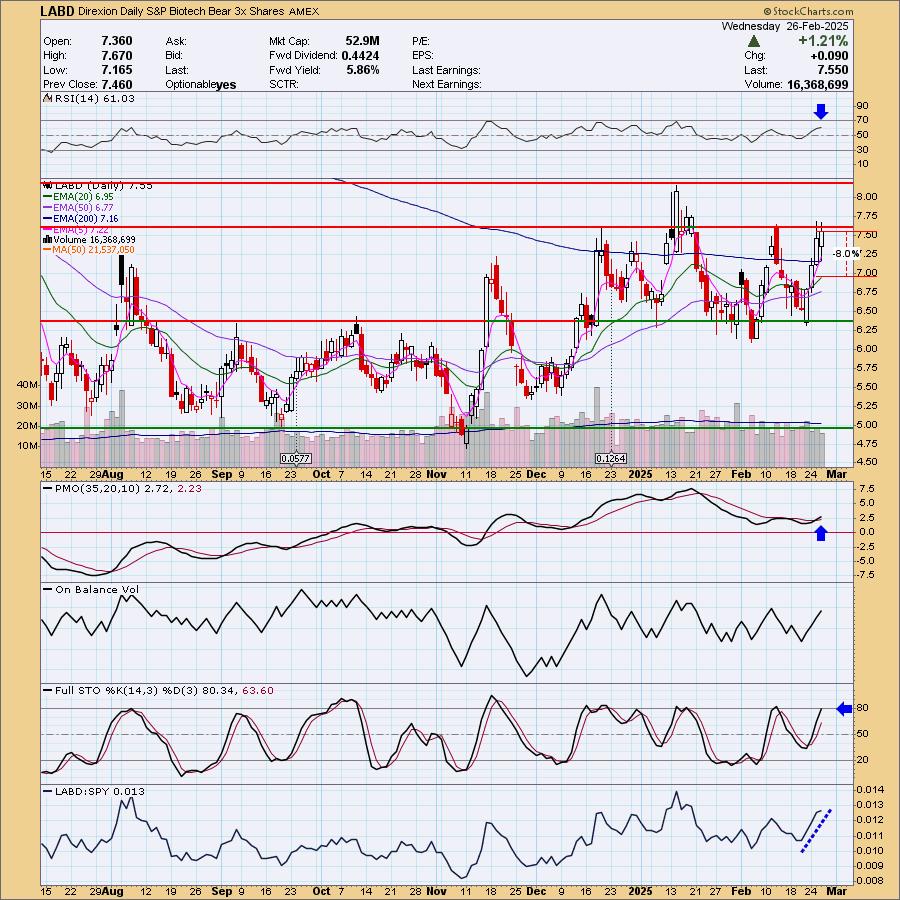
The weekly chart is very favorable with a rising weekly PMO and positive weekly RSI. There is plenty of upside potential, but remember this is leveraged and could be a rocky ride which is why the stop is at a deep 8% level.
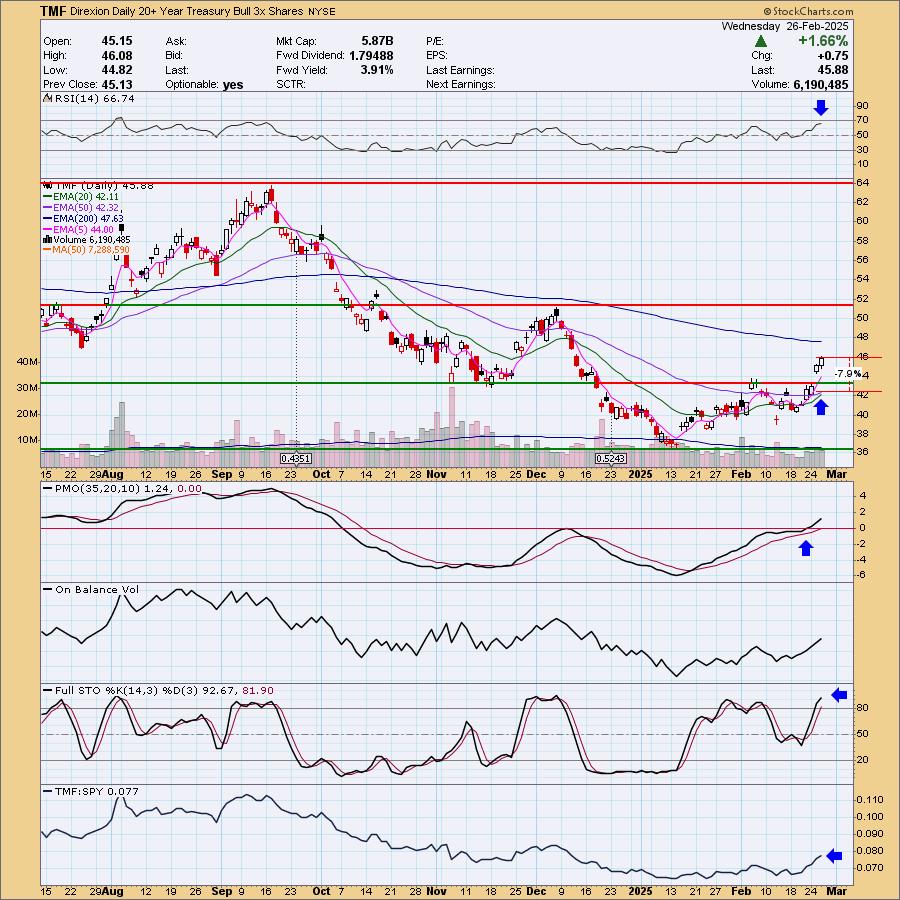
Direxion Daily 20+ Year Treasury Bull 3x Shares (TMF)
EARNINGS: N/A
TMF provides 3x daily exposure to a market-value-weighted index of US Treasury Bonds with over 20 years to maturity. Click HERE for more information.
Predefined Scans Triggered: P&F Double Top Breakout.
TMF is down -0.28% in after hours trading. Yields are very bearish right now so I am expecting more upside out of Bonds. As noted in the opening they are slow movers so this is why I picked the leveraged version. We have a strong gap up breakout with a followthrough day. The RSI is positive and not overbought. The PMO is rising strongly and Stochastics are well above 80 and rising. We have excellent outperformance right now. It is leveraged so I set a deep stop at 7.9% or $42.25.
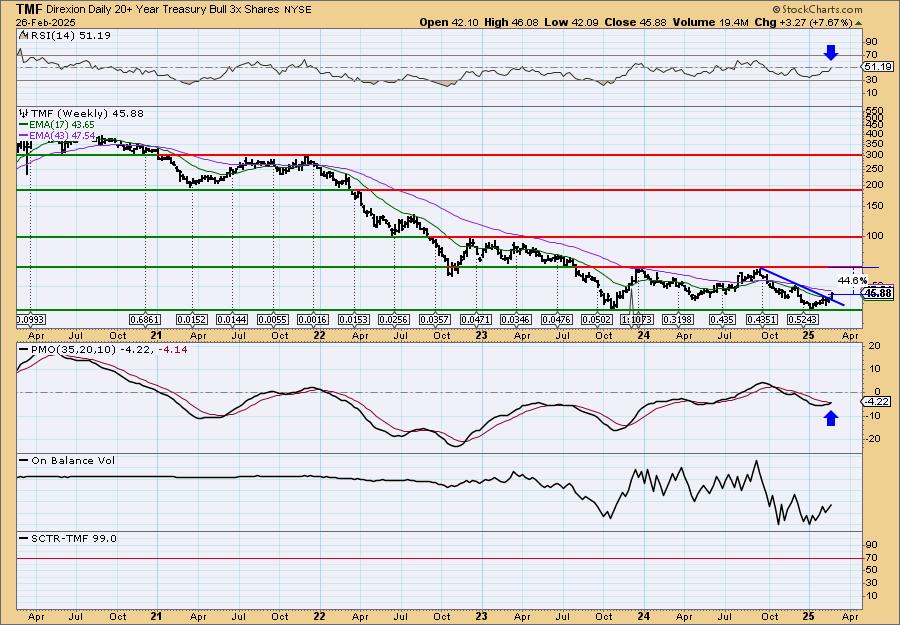
This is a nice bounce off fund lows. The weekly RSI is now positive and the weekly PMO is nearing a Crossover BUY Signal. Notice the OBV is rising with price. We also have a broken declining trend. Not so sure we'll see a 45% gain on this fund, but certainly there is plenty of upside available before major resistance arrives.
Don't forget, on Thursdays I look at reader-requested symbols, click HERE to send me an email. I read every email I receive and try to answer them all!
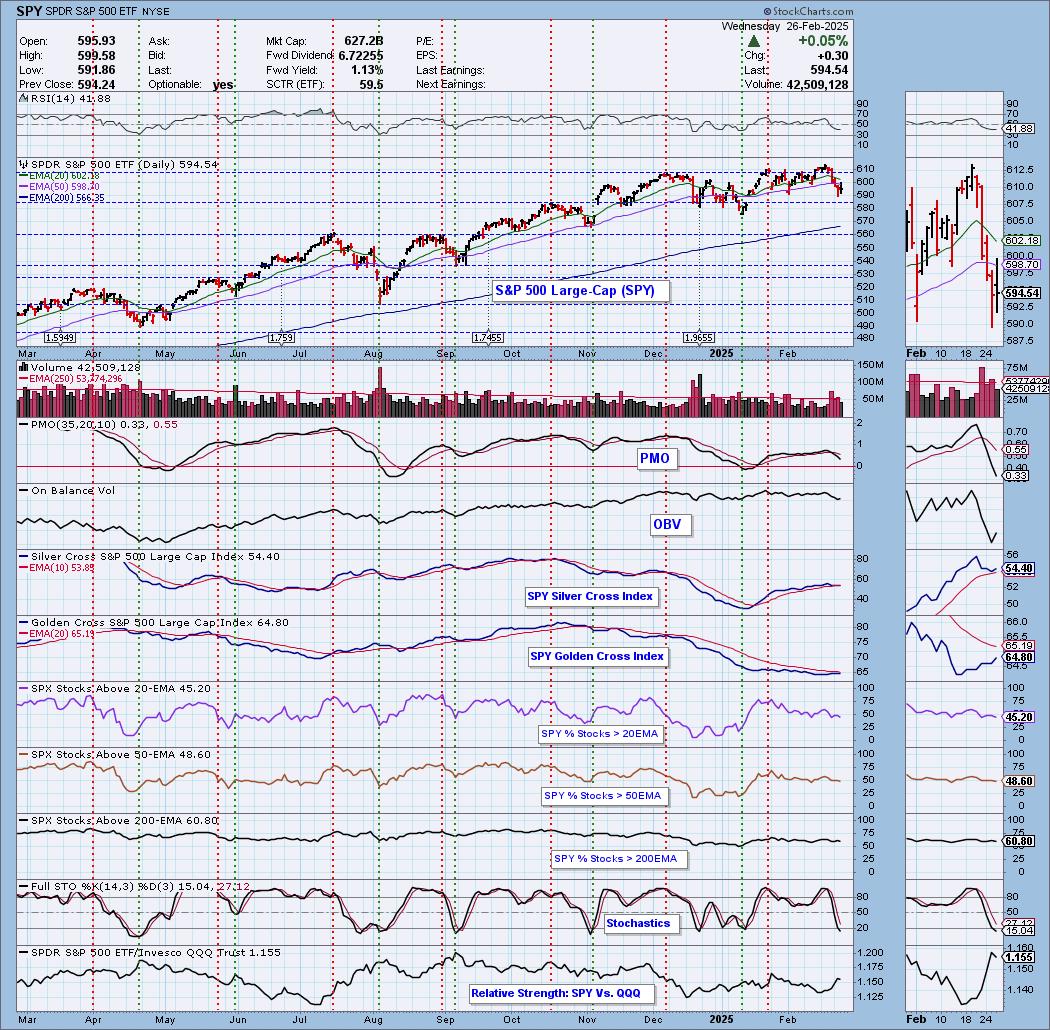
Current Market Outlook:
Market Environment: It is important to consider the odds for success by assessing the market tides. The following chart uses different methodologies for objectively showing the depth and trend of participation for intermediate- and long-term time frames.
- The Silver Cross Index (SCI) shows the percentage of SPX stocks on IT Trend Model BUY signals (20-EMA > 50-EMA)
- The Golden Cross Index (GCI) shows the percentage of SPX stocks on LT Trend Model BUY signals (50-EMA > 200-EMA)
Don't forget that as a "Diamonds" member, you have access to our "Under the Hood" curated ChartList on DecisionPoint.com. You'll find it under "Members Only" links on the left side on the Blogs and Links Page.
Here is the current chart:
Full Disclosure: I am 10% long, 0% short.
I'm required to disclose if I currently own a stock I mention and/or may buy/short it within the next 72 hours.
"Technical Analysis is a windsock, not a crystal ball." - Carl Swenlin
(c) Copyright 2025 DecisionPoint.com
Watch the latest episode of DecisionPoint Trading Room with Carl & Erin Swenlin Mondays on the DecisionPoint YouTube channel here!
NOTE: The stocks reported herein are from mechanical trading model scans that are based upon moving average relationships, momentum and volume. DecisionPoint analysis is then applied to get five selections from the scans. The selections given should prompt readers to do a chart review using their own analysis process. This letter is not a call for a specific action to buy, sell or short any of the stocks provided. There are NO sure things or guaranteed returns on the daily selection of "Diamonds in the Rough."
Regarding BUY/SELL Signals: The signal status reported herein is based upon mechanical trading model signals and crossovers. They define the implied bias of the price index/stock based upon moving average relationships and momentum, but they do not necessarily call for a specific action. They are information flags that should prompt chart review. Further, they do not call for continuous buying or selling during the life of the signal. For example, a BUY signal will probably (but not necessarily) return the best results if action is taken soon after the signal is generated. Additional opportunities for buying may be found as price zigzags higher, but the trader must look for optimum entry points. Conversely, exit points to preserve gains (or minimize losses) may be evident before the model mechanically closes the signal.
Helpful DecisionPoint Links:
Price Momentum Oscillator (PMO)
Swenlin Trading Oscillators (STO-B and STO-V)
For more links, go to DecisionPoint.com