
I'm bearish on the market right now so I thought it would be a good idea to look at some shorting opportunities. I wasn't pleased with my choices from the Diamond Dog Scan, but I did find one that looked interesting to me. The other three are longs.
One of them is Walgreens Boots (WBA). It is a reversal candidate which I do try to avoid in a market downturn, but it is in Consumer Staples and the upside potential was too hard to pass up.
The other two are in Financials, Insurance specifically. I don't like this sector that much, but something definitely seems to be percolating under the surface on Insurance stocks as others did find their way into my scans.
Good Luck & Good Trading,
Erin
Today's "Diamonds in the Rough": GFS (Short), SPNT, WBA and WTW.

Diamond Mine Trading Room:
RECORDING & DOWNLOAD LINK (2/21/2025):
Topic: DecisionPoint Diamond Mine (2/21/2025) LIVE Trading Room
Download & Recording Link
Passcode: February#21
REGISTRATION for 2/28/2025:
When: February 28, 2025 09:00 AM Pacific Time (US and Canada)
Topic: DecisionPoint Diamond Mine LIVE Trading Room
Register in advance for this webinar HERE
After registering, you will receive a confirmation email containing information about joining the webinar.

Below is the latest free DecisionPoint Trading Room recording from 2/24. You'll find these recordings posted on Mondays to our DP YouTube Channel. Be sure and subscribe HERE.
Welcome to DecisionPoint Diamonds, wherein I highlight ten "Diamonds in the Rough" per week. These are selected from the results of my DecisionPoint Scans which search for stocks that could benefit from the trend and condition of the market. Remember, these are not recommendations to buy or sell, but are the most interesting of the stocks that surfaced in my scans. My objective is to save you the work of the initial, tedious culling process, but you need to apply your own analysis to see if these stocks pique your interest as well. There are no guaranteed winners here!
"Predefined Scans Triggered" are taken from StockCharts.com using the "Symbol Summary" option instead of a "SharpChart" on the workbench.
Stop levels are all rounded down.
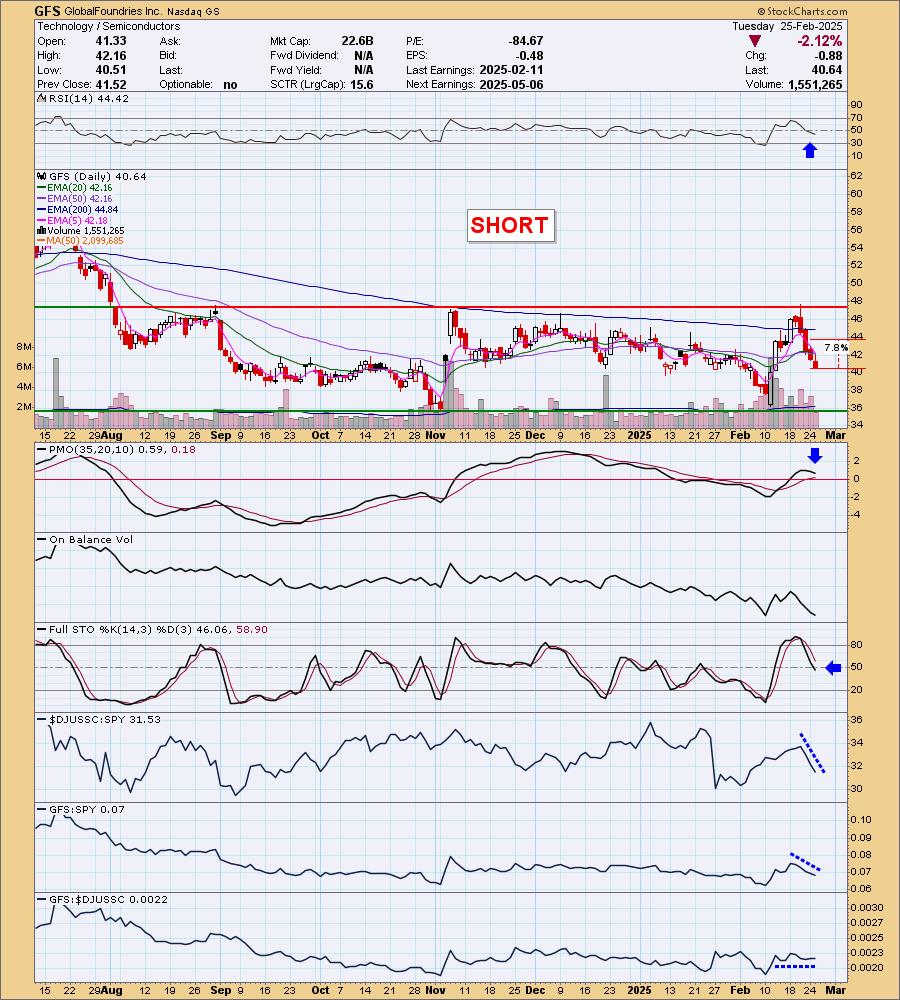
GlobalFoundries Inc. (GFS) - SHORT
EARNINGS: 2025-05-06 (BMO)
GLOBALFOUNDRIES, Inc. provides foundry services and manufactures semiconductors. It offers global shuttle, mask, post-fab and turnkey services. The company was founded on October 7, 2008 and is headquartered in Malta, NY.
Predefined Scans Triggered: Moved Below Ichimoku Cloud, P&F High Pole and Parabolic SAR Sell Signals.
GFS is unchanged in after hours trading. We're playing the trading range on this one as we look for price to continue down toward support. It is a Semiconductor and I expect them to continue struggling particularly if we see NVDA lose ground on earnings. The indicators are great for a short. The RSI just moved into negative territory and the PMO has topped and is headed toward a Crossover SELL Signal. Stochastics just dropped into negative territory. Relative strength for the group is terrible. GFS is performing in line with the group so consequently it is underperforming the SPY as well. I've set the upside stop between the 50/200-day EMAs at 7.8% or $43.81.
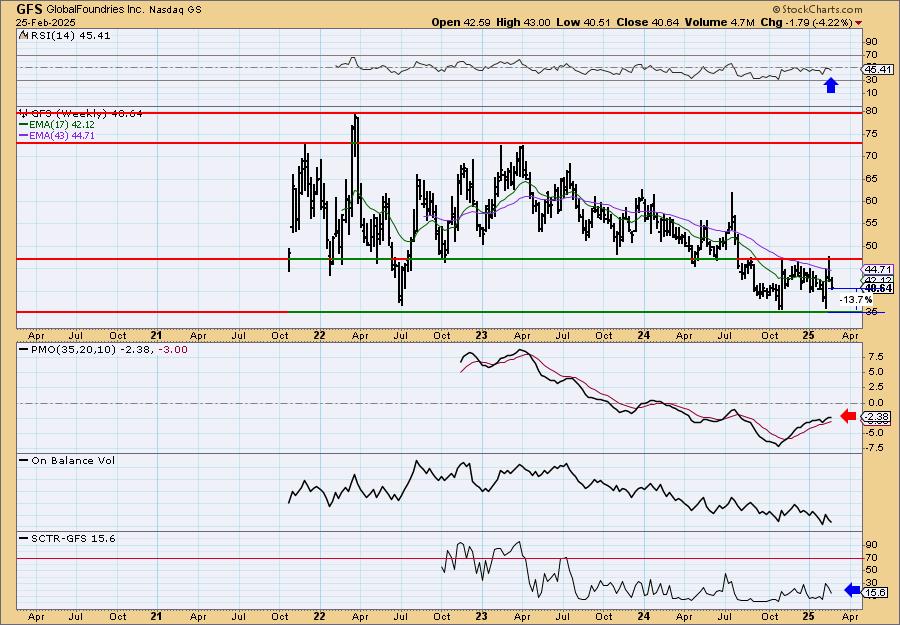
We see a long-term declining trend that has not been broken. The weekly RSI is in negative territory and the StockCharts Technical Rank (SCTR) is well outside the hot zone* above 70. The weekly PMO is still technically rising, but a little more decline will turn it down. Downside potential is good should it test prior support.
*If a stock is in the "hot zone" above 70, it implies that it is stronger than 70% of its universe (large-, mid-, small-caps and ETFs) primarily in the intermediate to long terms.
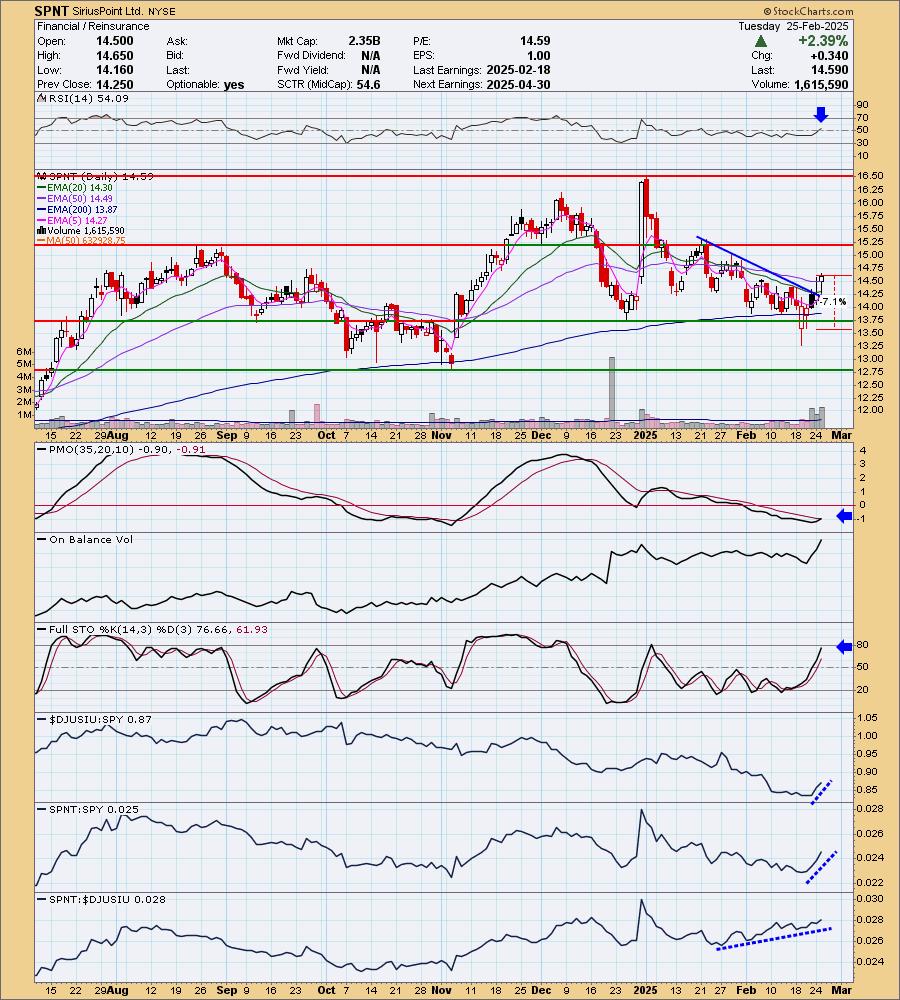
SiriusPoint Ltd. (SPNT)
EARNINGS: 2025-04-30 (AMC)
SiriusPoint Ltd. engages in the provision of insurance and reinsurance services. It operates through the Reinsurance, and Insurance and Services segments. The Reinsurance segment covers aviation and space, casualty, contingency, credit and bond, marine and energy, mortgage, and property. The Insurance and Services segment involves accident and health, environmental, worker's compensation, and others. The company was founded in 1945 and is headquartered in Pembroke, Bermuda.
Predefined Scans Triggered: P&F Double Bottom Breakdown and P&F Bullish Signal Reversal.
SPNT is down -4.11% in after hours trading so this one looks a little problematic if that sticks tomorrow. If it opens that far down, it may not be worth it as I'm looking for followthrough on this breakout from the declining trend. It is also bouncing off strong support. The RSI has just entered positive territory. The PMO just had a Crossover BUY Signal today. Stochastics are rising strongly. The group is showing strength against the SPY. SPNT is showing rising relative strength against both the group and the SPY. The stop is set beneath support at 7.1% or $13.55.
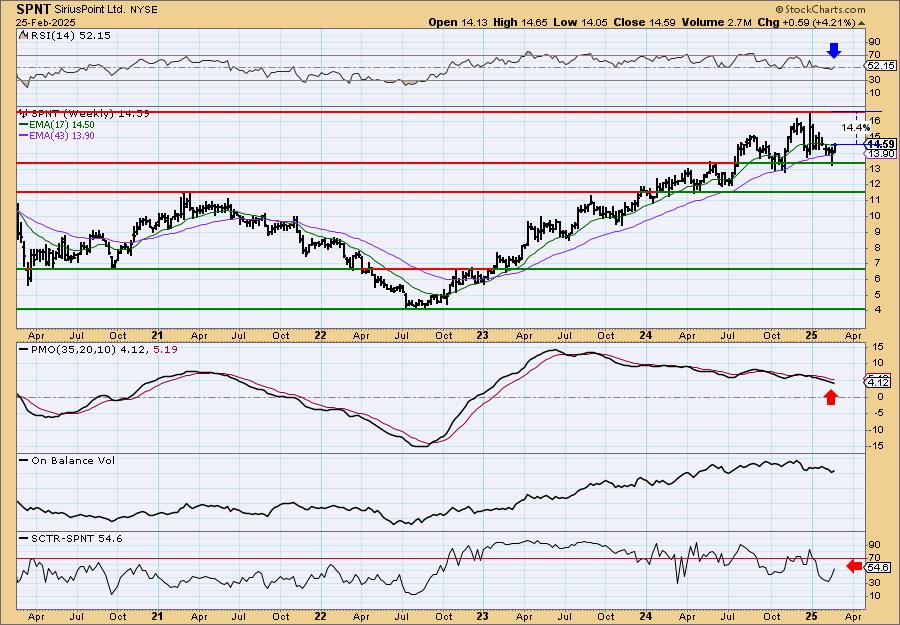
The weekly chart looks alright. I do like the long-term rising trend and the bounce off support as I mentioned above. The weekly RSI just entered positive territory. The SCTR isn't in the hot zone, but it is rising quickly. The weekly PMO is the problem. Upside potential is pretty good.
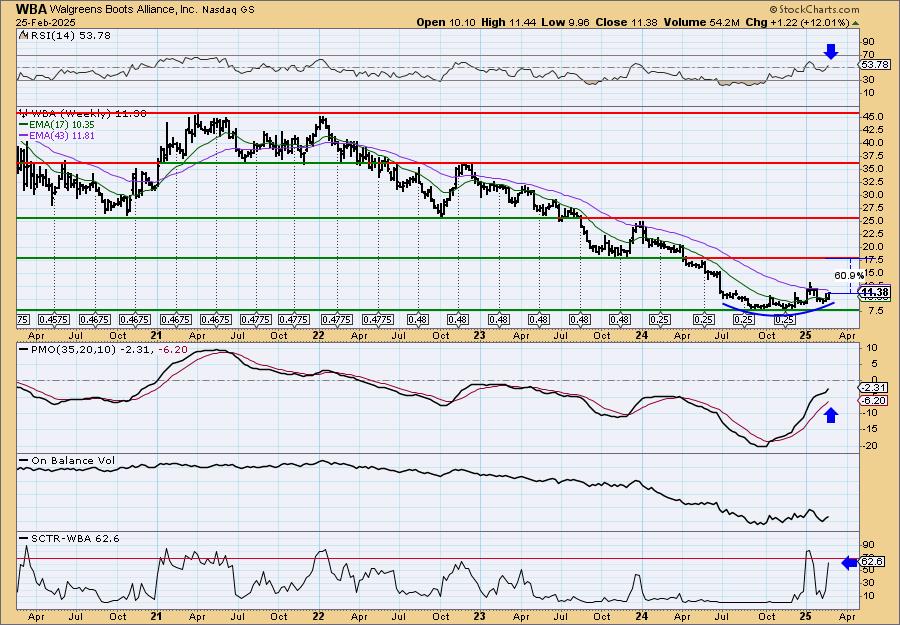
Walgreens Boots Alliance, Inc. (WBA)
EARNINGS: 2025-03-27 (BMO)
Walgreens Boots Alliance, Inc. engages in the provision of healthcare and retail pharmacy services. It operates through the following segments: United States Retail Pharmacy, International, and United States Healthcare. The US Retail Pharmacy segment includes the operation of retail drugstores, health and wellness services, specialty and home delivery pharmacy services, and equity method investment. The International segment offers pharmacy-led health and beauty retail businesses outside the US and the pharmaceutical wholesaling and distribution business in Germany. The US Healthcare segment delivers improved health outcomes and lower costs for payors and providers through owned and partnered assets. The company was founded by Charles R. Walgreen and John Boot in 1909 and is headquartered in Deerfield, IL.
Predefined Scans Triggered: New CCI Buy Signals.
WBA is down -0.26% in after hours trading. I like the breakout here on two strong up days. It is a reversal candidate as price is below the 200-day EMA. The RSI looks good in positive territory and not overbought. The PMO is rising on a new Crossover BUY Signal. Stochastics are rising in positive territory. Relative strength looks very good with all relative strength lines rising strongly. The stop is a bit deep, but I wanted it to line up below support so I set it at 8% or $10.46.

We have a bullish rounded bottom on price. The weekly RSI is now positive again. The weekly PMO is rising sharply on a Crossover BUY Signal. The SCTR is nearly in the hot zone above 70. Upside potential is incredible. I don't know that it can recapture that level. I'd be happy with my normal 17% gain that I look for.
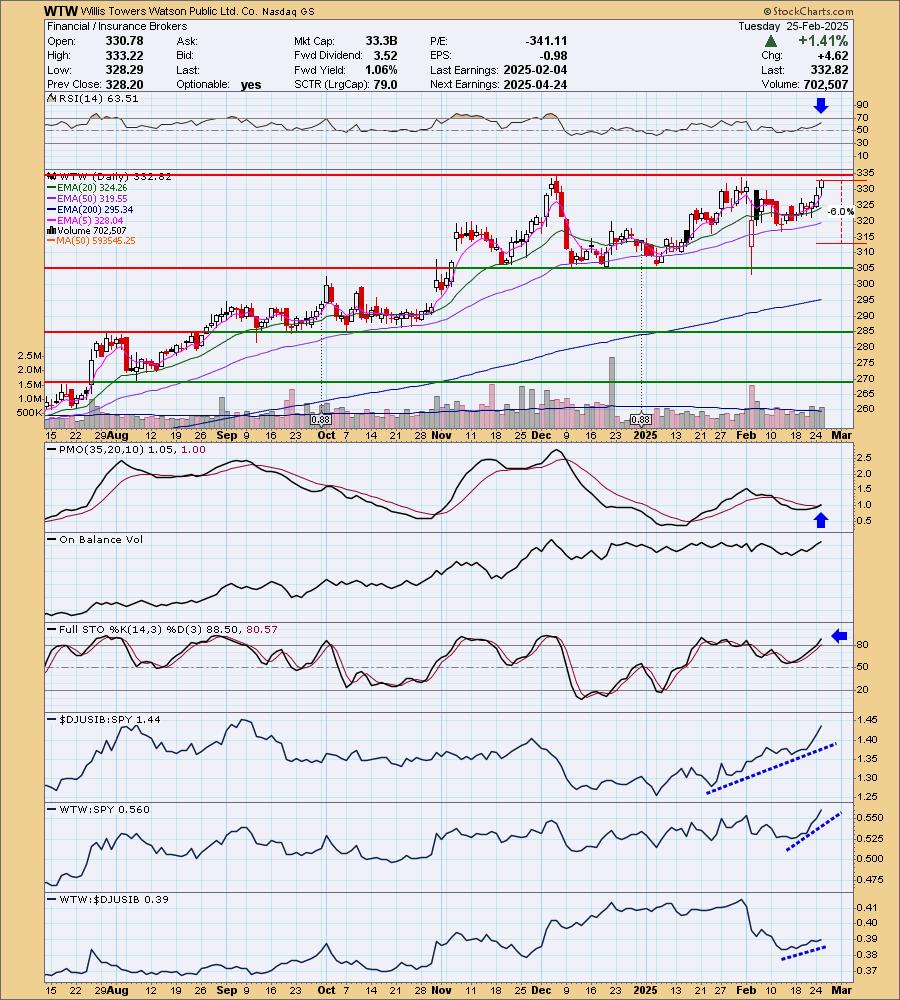
Willis Towers Watson Public Ltd. Co. (WTW)
EARNINGS: 2025-04-24 (BMO)
Willis Towers Watson Plc engages in the provision of advisory, broking, and solutions services. It operates through the following segments: Health, Wealth, and Career (HCW), Risk and Broking (R&B), and Corporate and Other. The HCW segment provides an array of advice, broking, solutions, and technology for employee benefit plans, institutional investors, compensation and career programs, and the employee experience overall. The R&B segment focuses on a broad range of risk advice, insurance brokerage, and consulting services to clients globally, ranging from small businesses to multinational corporations. The company was founded in 1828 and is headquartered in London, the United Kingdom.
Predefined Scans Triggered: Moved Above Upper Bollinger Band, New CCI Buy Signals and Ichimoku Cloud Turned Red.
WTW is unchanged in after hours trading. It is right up against resistance but given the indicators I'm looking for a breakout. We do have a nice rising trend out of last month's low. The RSI is positive and not overbought. The PMO is rising on a new Crossover BUY Signal. Stochastics are rising above 80. Relative strength is excellent as we see all three relative strength lines rising strongly. The stop doesn't have to be set too deeply. I chose an area between the 50-day EMA and horizontal support at 6% or $312.85.
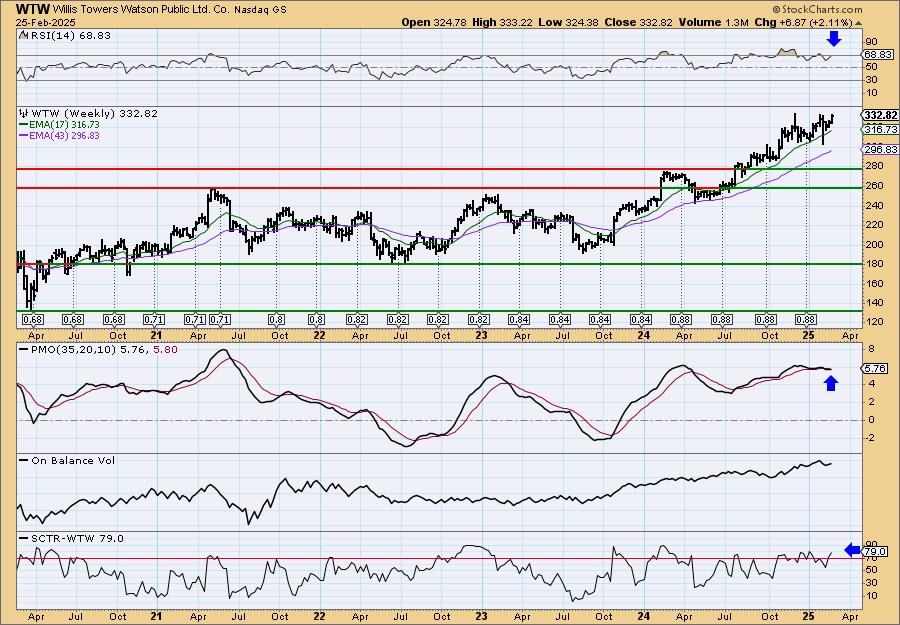
We have a strong rising trend coming out of a long-term trading range. The weekly RSI is positive and not quite overbought yet. The weekly PMO has just turned back up. The SCTR is in the hot zone above 70. Consider a 17% upside target to $389.40.
Don't forget, on Thursdays I look at reader-requested symbols, click HERE to send me an email. I read every email I receive and try to answer them all!
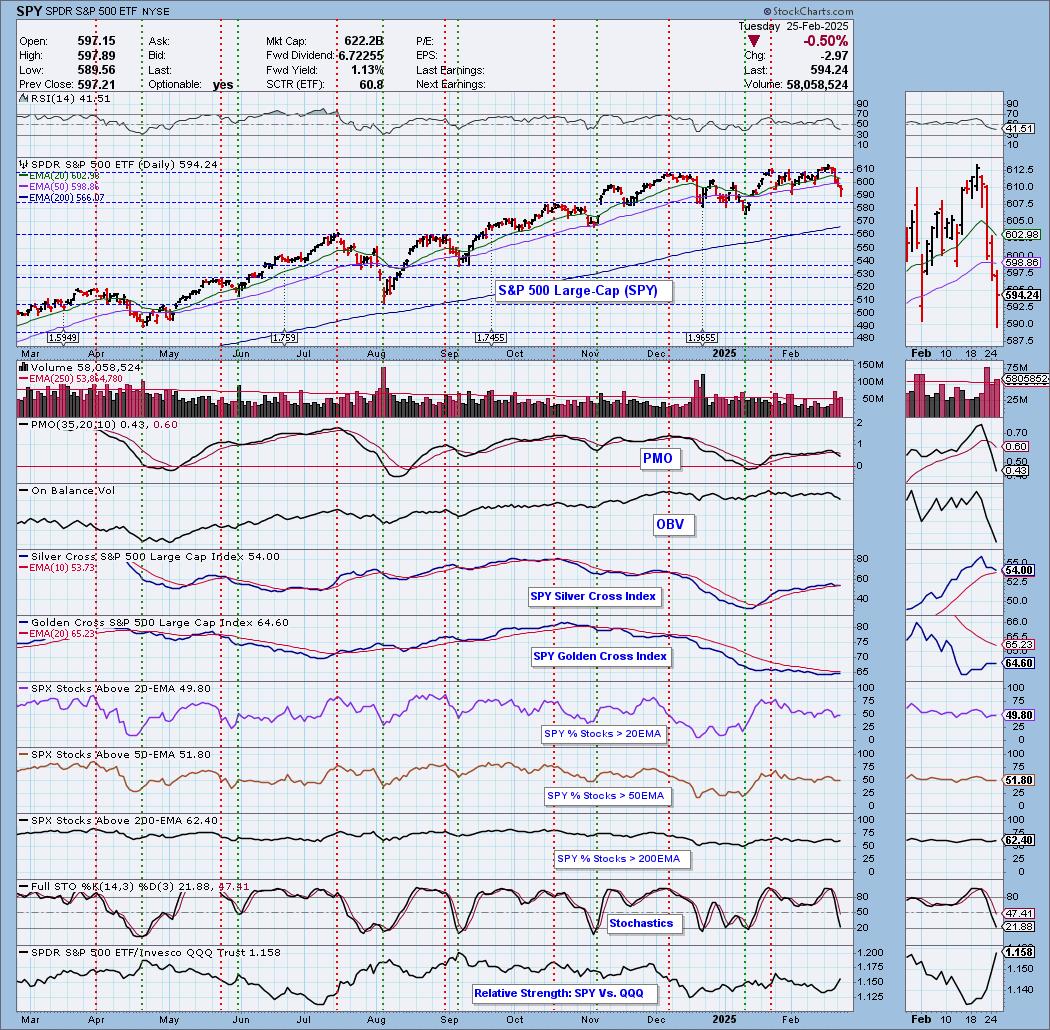
Current Market Outlook:
Market Environment: It is important to consider the odds for success by assessing the market tides. The following chart uses different methodologies for objectively showing the depth and trend of participation for intermediate- and long-term time frames.
- The Silver Cross Index (SCI) shows the percentage of SPX stocks on IT Trend Model BUY signals (20-EMA > 50-EMA)
- The Golden Cross Index (GCI) shows the percentage of SPX stocks on LT Trend Model BUY signals (50-EMA > 200-EMA)
Don't forget that as a "Diamonds" member, you have access to our "Under the Hood" curated ChartList on DecisionPoint.com. You'll find it under "Members Only" links on the left side on the Blogs and Links Page.
Here is the current chart:
Full Disclosure: I am 10% long, 0% short.
I'm required to disclose if I currently own a stock I mention and/or may buy/short it within the next 72 hours.
"Technical Analysis is a windsock, not a crystal ball." - Carl Swenlin
(c) Copyright 2025 DecisionPoint.com
Watch the latest episode of DecisionPoint Trading Room with Carl & Erin Swenlin Mondays on the DecisionPoint YouTube channel here!
NOTE: The stocks reported herein are from mechanical trading model scans that are based upon moving average relationships, momentum and volume. DecisionPoint analysis is then applied to get five selections from the scans. The selections given should prompt readers to do a chart review using their own analysis process. This letter is not a call for a specific action to buy, sell or short any of the stocks provided. There are NO sure things or guaranteed returns on the daily selection of "Diamonds in the Rough."
Regarding BUY/SELL Signals: The signal status reported herein is based upon mechanical trading model signals and crossovers. They define the implied bias of the price index/stock based upon moving average relationships and momentum, but they do not necessarily call for a specific action. They are information flags that should prompt chart review. Further, they do not call for continuous buying or selling during the life of the signal. For example, a BUY signal will probably (but not necessarily) return the best results if action is taken soon after the signal is generated. Additional opportunities for buying may be found as price zigzags higher, but the trader must look for optimum entry points. Conversely, exit points to preserve gains (or minimize losses) may be evident before the model mechanically closes the signal.
Helpful DecisionPoint Links:
Price Momentum Oscillator (PMO)
Swenlin Trading Oscillators (STO-B and STO-V)
For more links, go to DecisionPoint.com