
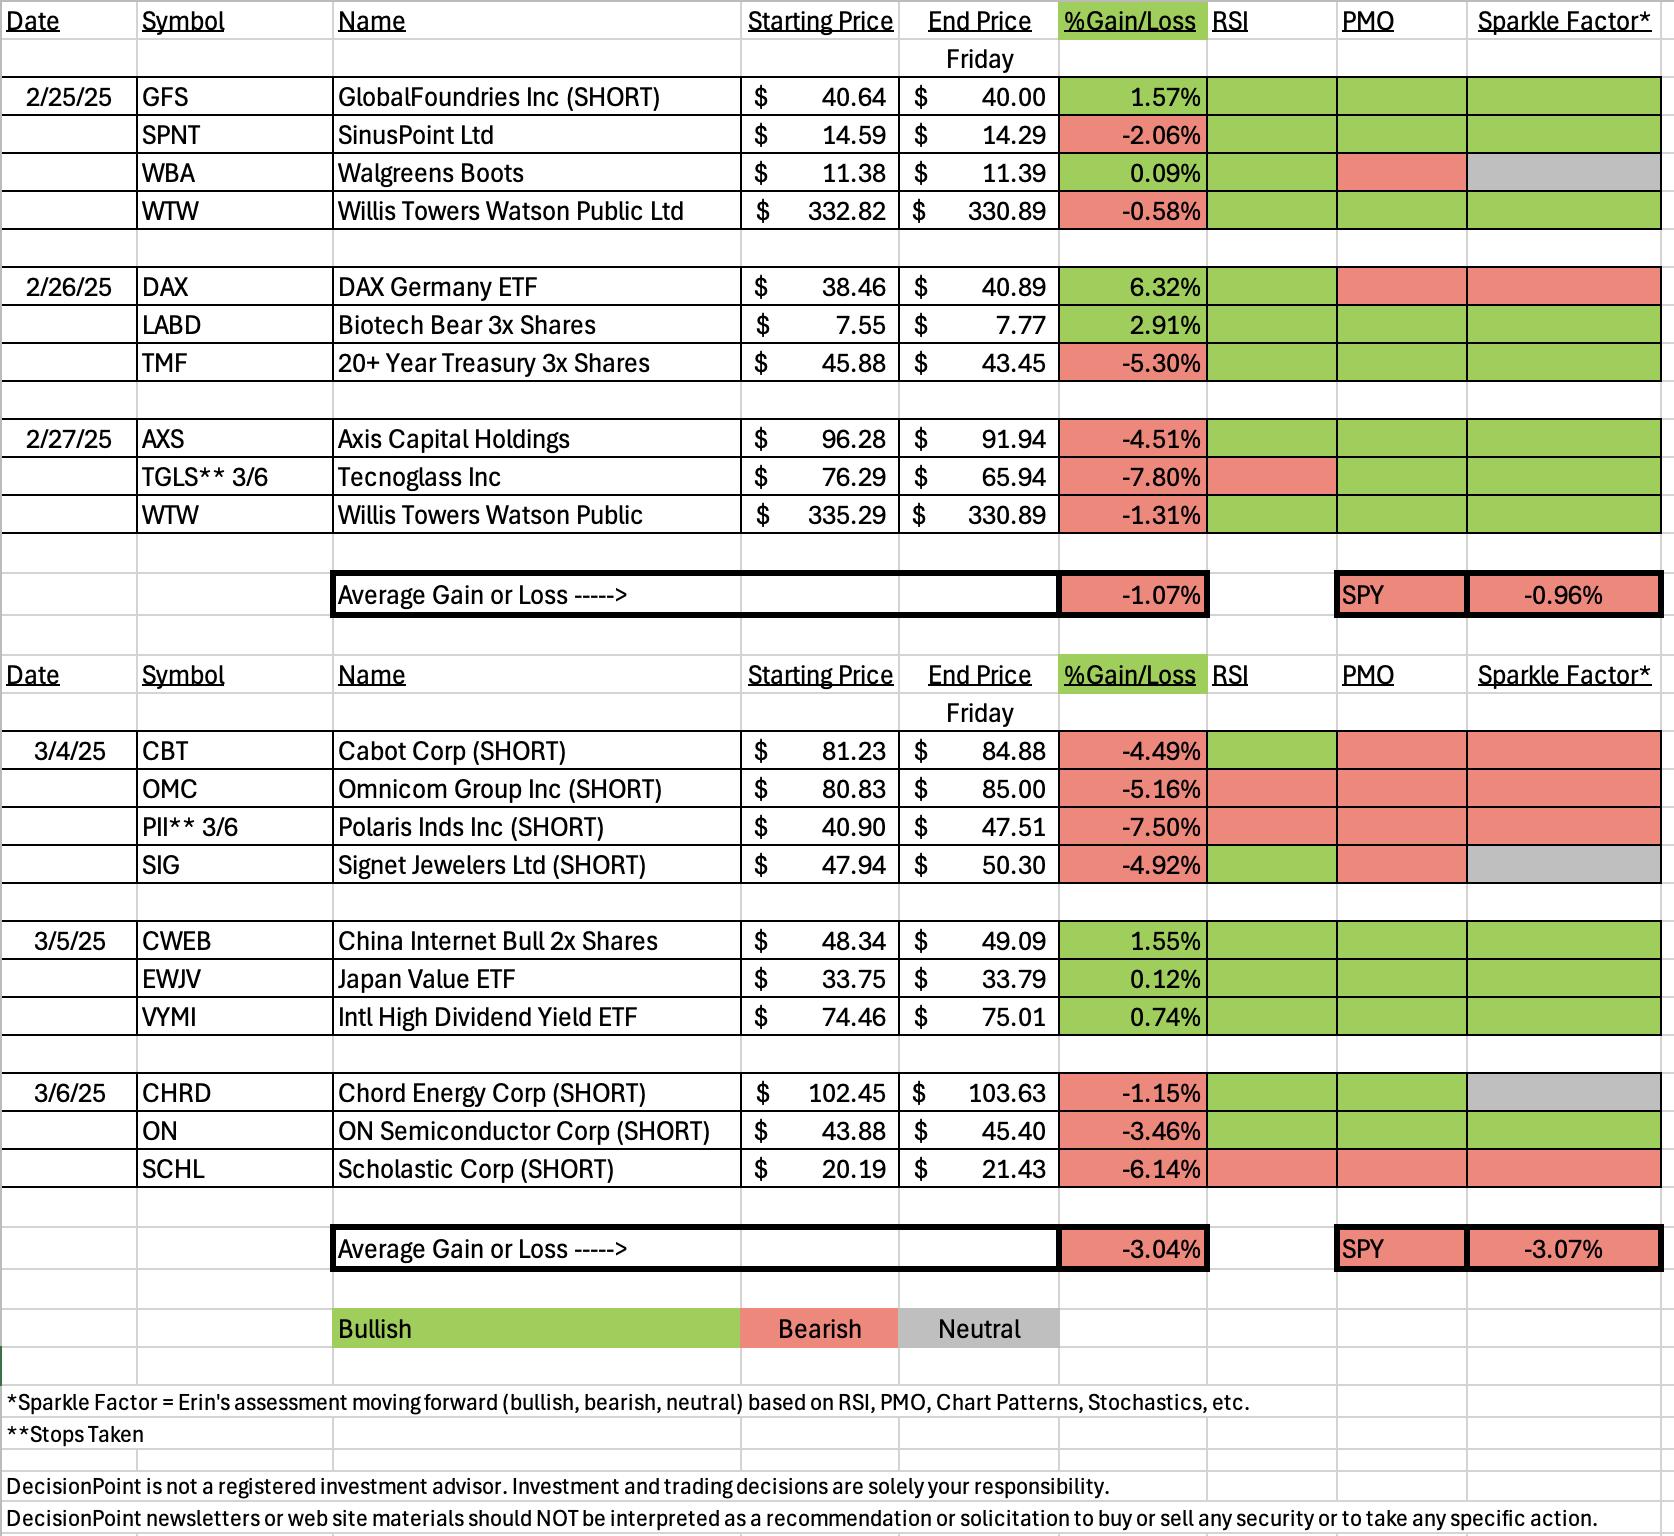
"Diamonds in the Rough" did finish higher on the week, but no thanks to our short positions. ETF Day saved the day for the spreadsheet. Most of the shorts don't look so good anymore.
After today's late day rally, I'm rethinking the short positions. We are at strong support and it does look like the market wants to rally further. It isn't a done deal, but it does tell me that shorts may not work out. This week's did not. The other thing I noticed is that the Diamond Dog Scan which looks for shorts has been coming up mostly empty. I think there are some reasons for this based on the scan code. I'm rethinking the scan code as well or adding another shorting scan to the mix.
Given trading this morning, we did look for shorts from scans, but I think we may do better looking at the longs from today's Industry Group to Watch. In any case, here are some possible shorts to consider: PRCT, WVE, SKYH, LUV, DBRG and EE.
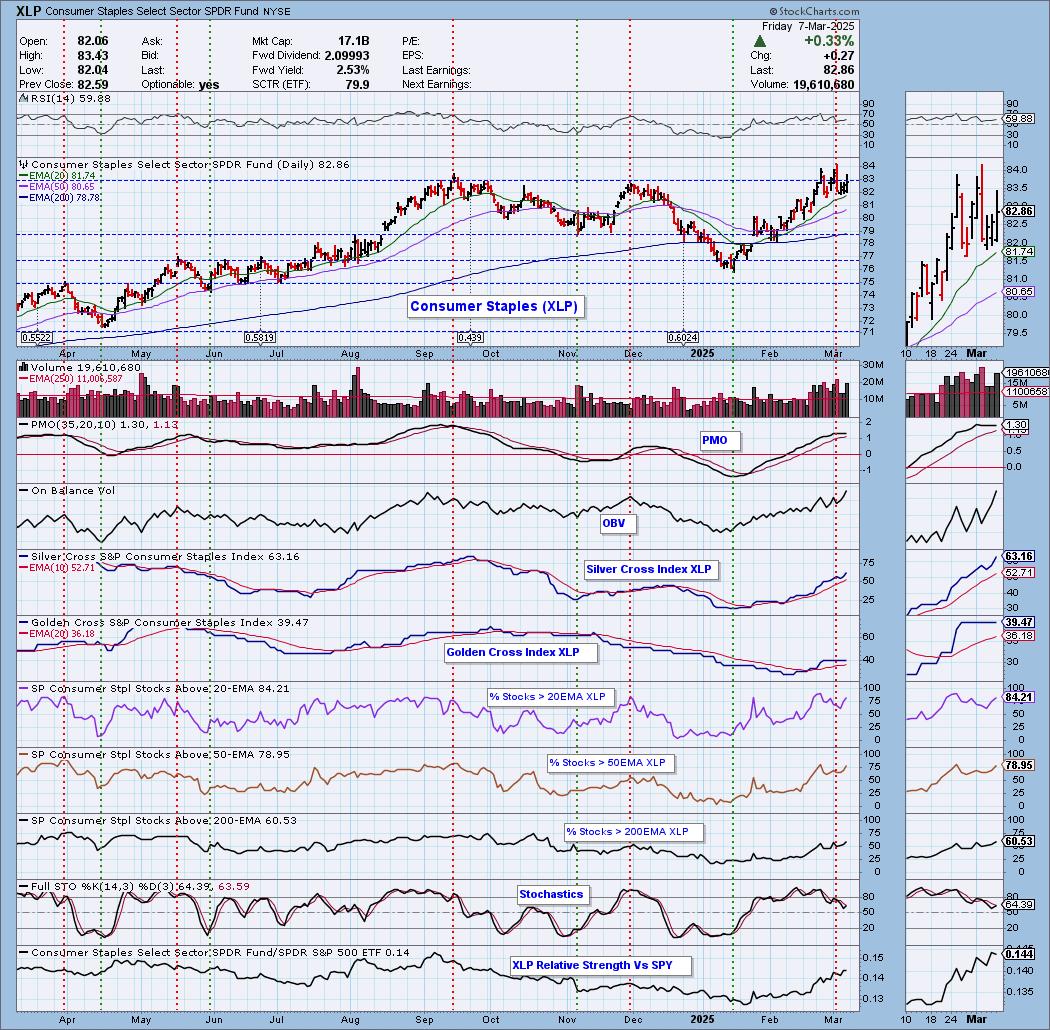
The Sector to Watch had to be Consumer Staples (XLP) as it has the best participation and a rising PMO. I will say that Healthcare (XLV) looks interesting right now as it is in a rising trend and the PMO is rising. It just didn't have as strong participation as XLP did.
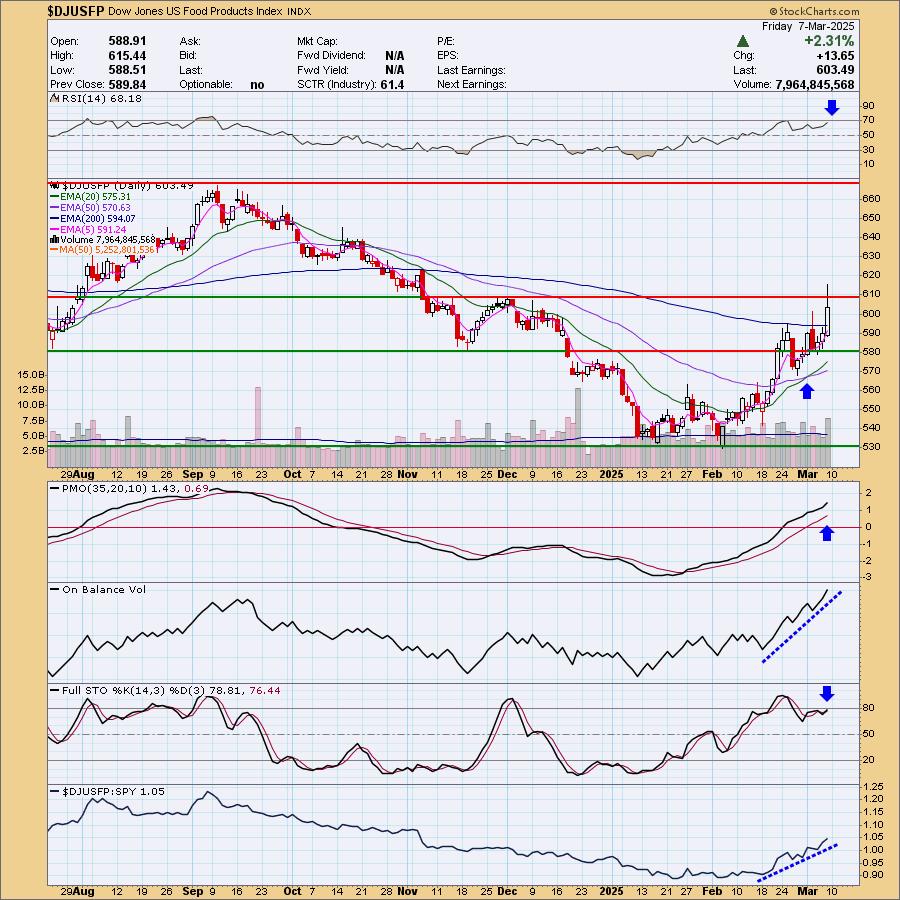
The Industry Group to Watch is Food Products, but Food Retailers are showing some promise. We found quite a few stocks in this group that are worth watching next week: TR, FDP, AVO, DOLE, POST, INGR, KHC and GIS.
This week's Darling was the leveraged China Internet ETF. The Dud was Polaris (PII) which decided to have a very strong upside reversal. There may've been news, but I didn't research it. I decided to lick my wounds and take PII off our list by giving it a 'red' Sparkle Factor.
Have a very good weekend! I'll see you in Monday's free trading room!
Good Luck & Good Trading,
Erin

Diamond Mine Trading Room:
RECORDING & DOWNLOAD LINK (3/7/2025):
Topic: DecisionPoint Diamond Mine (3/7/2025) LIVE Trading Room
Download and Recording Link
Passcode: March#7th
REGISTRATION for 3/14/2025:
When: March 14, 2025 09:00 AM Pacific Time (US and Canada)
Topic: DecisionPoint Diamond Mine LIVE Trading Room
Register in advance for this webinar HERE
After registering, you will receive a confirmation email containing information about joining the webinar.

Below is the latest free DecisionPoint Trading Room recording from 3/3. You'll find these recordings posted on Mondays to our DP YouTube Channel. Be sure and subscribe HERE.
A few items about the spreadsheet: I've put on the spreadsheet whether the RSI is positive (green) or negative (red). The PMO column tells you if it is rising (green) or falling (red). Finally I've added my own "Sparkle Factor" that gives you my assessment going forward, bullish (green), bearish (red) or neutral (gray). The Sparkle Factor is basically my thoughts on whether I expect it to rise or fall. A neutral means it could really go either way so it could be added to a watch list. If you're in a stock I consider "neutral" going forward, the ball is in your court.
Darling:
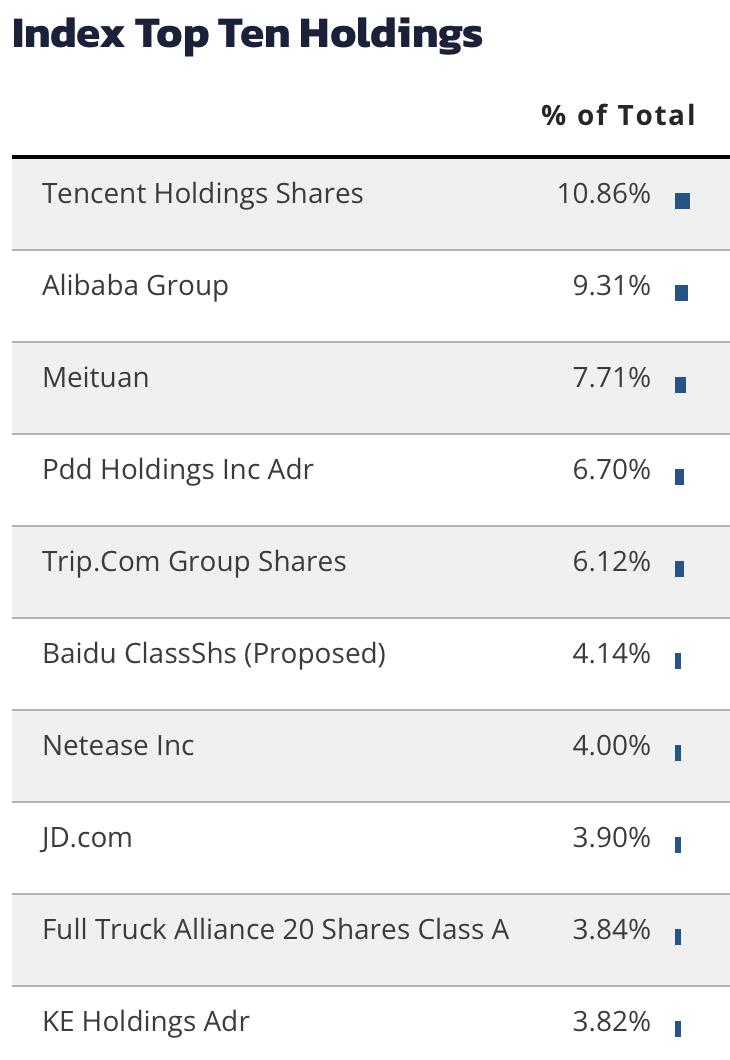
Direxion Daily CSI China Internet Index Bull 2X Shares (CWEB)
EARNINGS: N/A
CWEB provides 2x leveraged daily exposure to an index composed of overseas-listed Chinese internet companies. Click HERE for more information.
Predefined Scans Triggered: Elder Bar Turned Green, Parabolic SAR Buy Signals, New CCI Buy Signals, P&F double Top Breakout and Gap Ups.
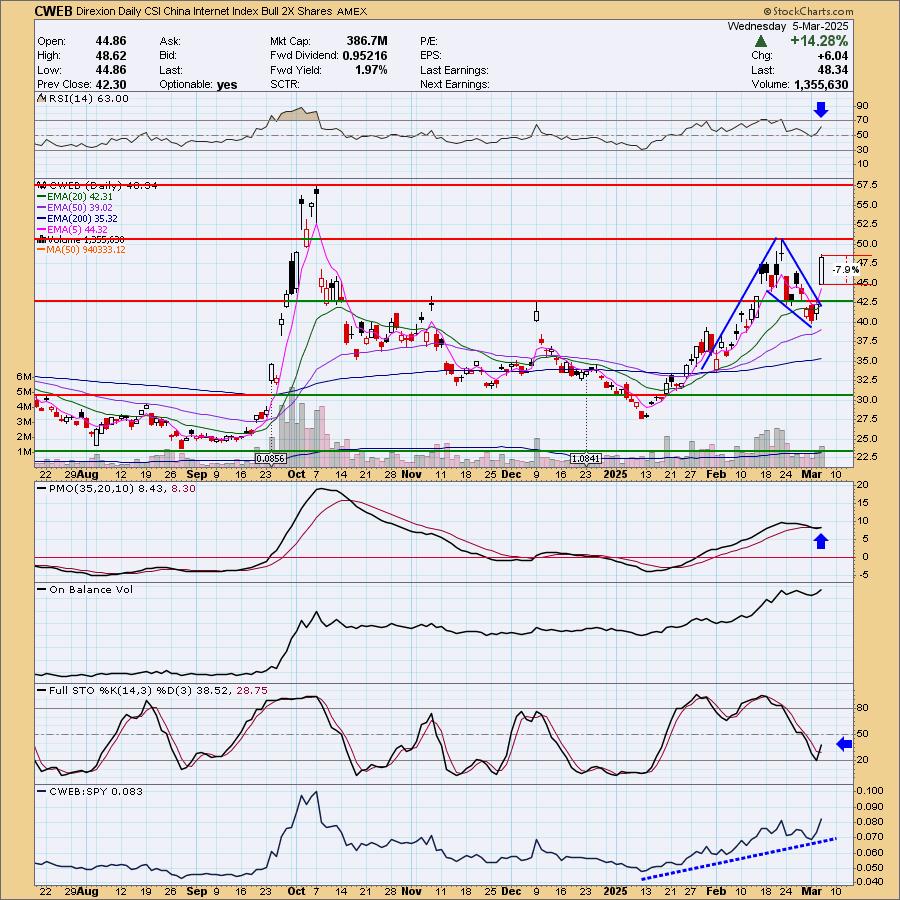
Below are the commentary and chart from Wednesday, 3/5:
"CWEB is up +0.72% in after hours trading. Given Tech as a whole hasn't been performing well I was surprised to see this one performing so well. We have a bull flag in which the flag is a bullish falling wedge. The pattern was confirmed with today's breakout. The RSI is positive and not at all overbought. The PMO has whipsawed back into a Crossover BUY Signal. Stochastics have turned back up and relative strength is outstanding. The stop was a little difficult to set given today's giant move higher. I chose 7.9% or $44.52."
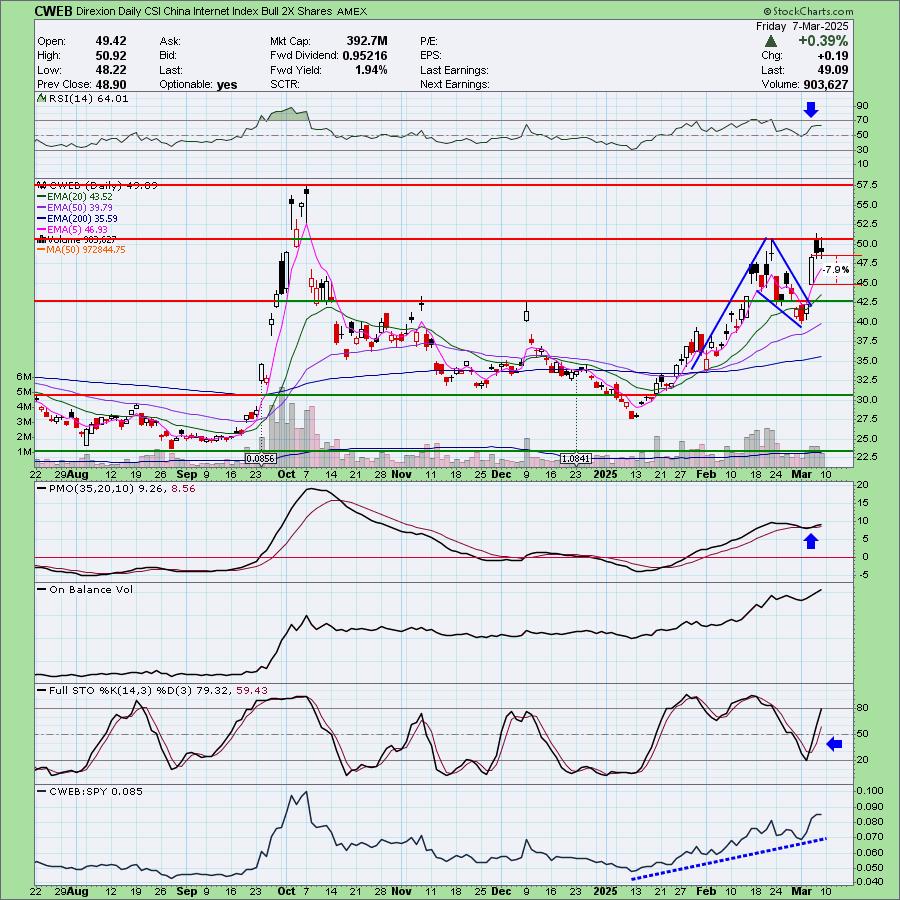
Here is today's chart:
We got the breakout from the bull flag, but I'm not very fond of those bearish filled black candlesticks coming in right at overhead resistance. I think this one does have some more upside ahead of it, but it may require a pullback first which is hard to swallow on a leveraged ETF. If the indicators are right, we will get the breakout. This market reversal could work out for it.
Don't forget, on Thursdays I look at reader-requested symbols, so shoot me an email at erin@decisionpoint.com. I read every email I receive and try to answer them all!
Dud:
Polaris Inds, Inc. (PII)
EARNINGS: 2025-04-22 (AMC)
Polaris Inc. engages in designing, engineering, manufacturing, and marketing power sports vehicles. It operates through the following segments: Off Road, On Road, and Marine. The Off Road segment includes off-road vehicles (ORV) and snowmobiles. The On Road segment is involved in the design and manufacture of motorcycles, moto-roadsters, light duty hauling, and passenger vehicles. The Marine segment focuses on the design and manufacture of boats. The company was founded by Edgar E. Hetteen, Allan Hetten, and David E. Johnson in 1954 and is headquartered in Medina, MN.
Predefined Scans Triggered: P&F Double Bottom Breakdown, P&F Descending Triple Bottom Breakdown, Stocks in a New Downtrend (Aroon), Moved Below Lower Bollinger Band, Moved Below Lower Price Channel, New 52-week Lows and Moved Below Lower Keltner Channel.
Below are the commentary and chart from Tuesday, 3/4:
"PII is actually up +2.69% in after hours trading, but that will not take away the drop below support on today's bigger decline. It could offer a nice entry on the short. The RSI is negative and not yet oversold. The PMO has topped and is nearing a Crossover BUY Signal well below the zero line. Stochastics are now below 20 indicating internal weakness. Relative strength lines are in declining trends. The stop is set above resistance at 7.5% or $43.97."
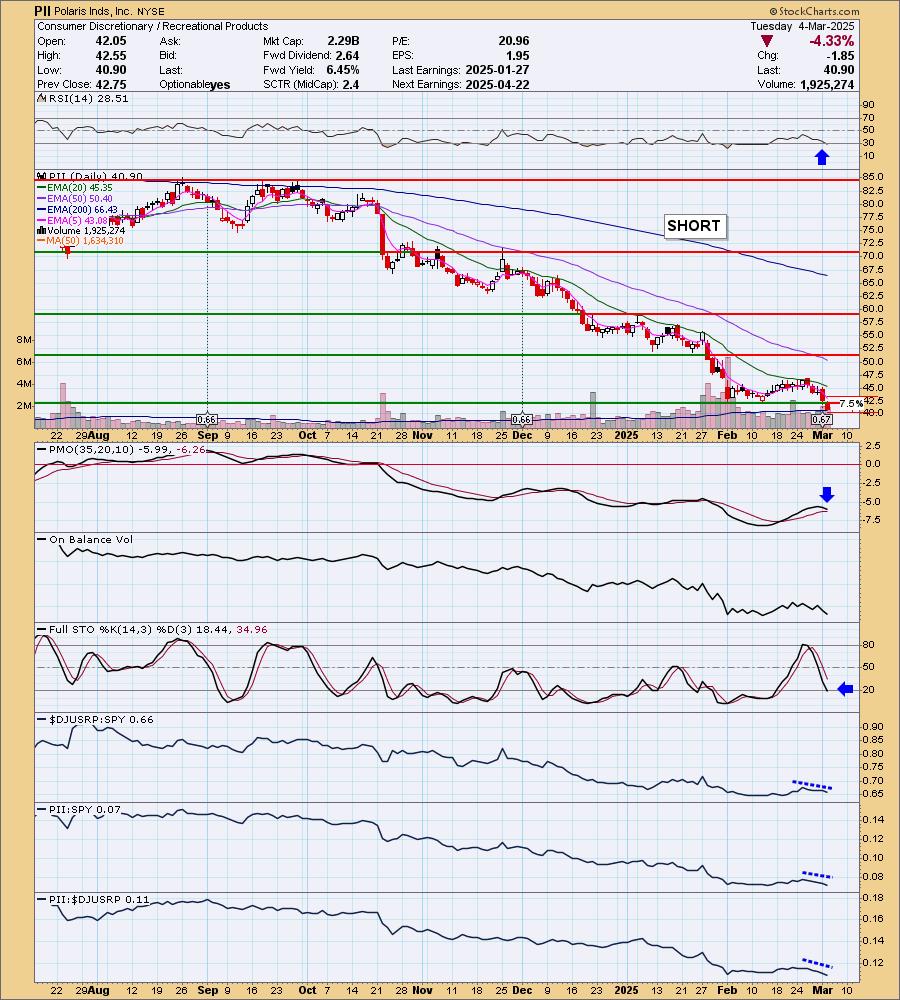
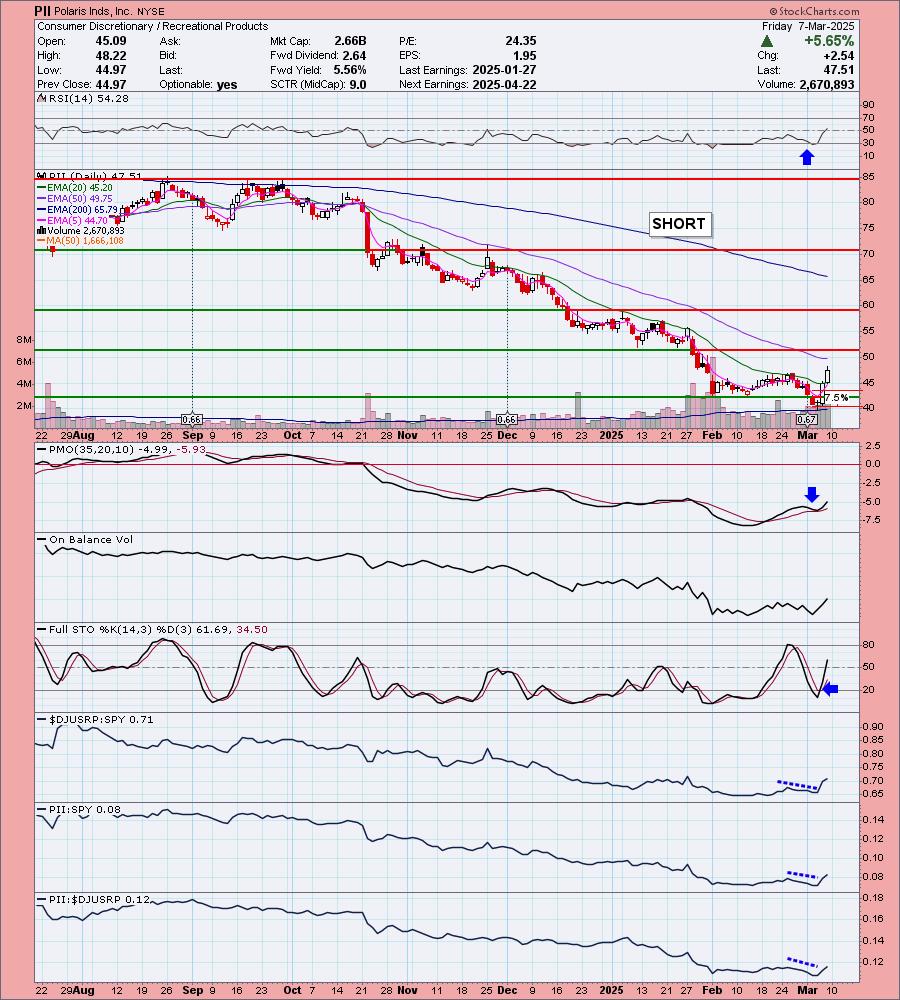
Here is today's chart:
The setup was very bearish, but when I presented it, after hours trading was way up which could've have been a hint that this one was ready to reverse higher. Still I didn't expect this strong rally at all given the negative indicators and price action. It went against the market as well. We now have a small breakout above near-term resistance so this one may have more upside in it.
THIS WEEK's Performance:
DecisionPoint Market Scoreboard (Mechanical Trend Model Signals):
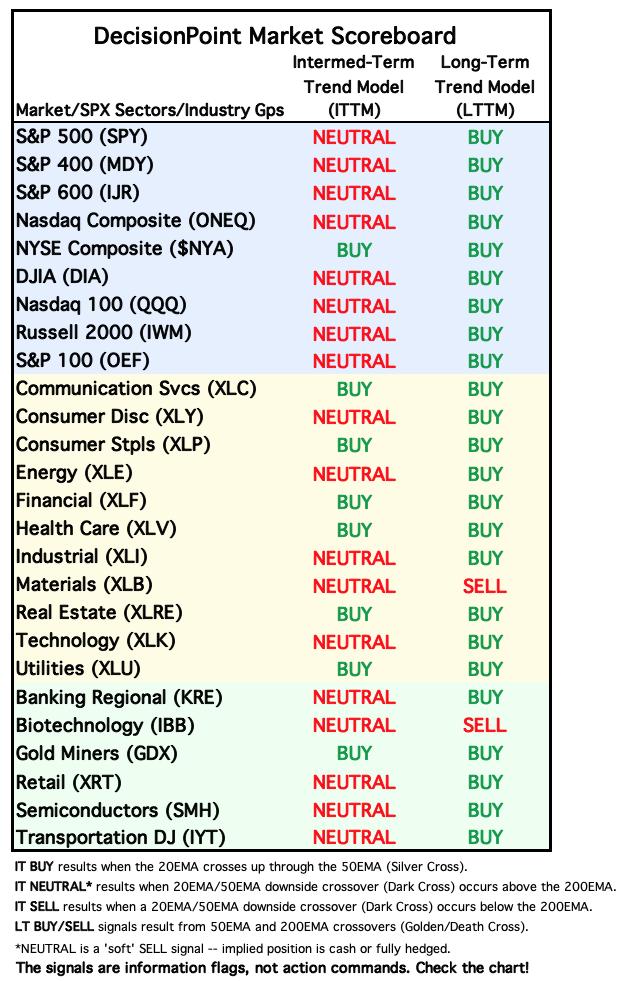
Friday signal changes are outlined in purple.
Click Here to view Carl's annotated "Under the Hood" ChartList!
Sector to Watch: Consumer Staples (XLP)
I think we could make a case for a bull flag on price. It's more of a sideways flag and those aren't always the best at executing. If the market does shift bullish next week, this may not be the best place to be so keep an eye out. The PMO does look toppy, but it is still technically rising. The RSI is positive and not overbought. Participation is very healthy and not really overbought. Stochastics are rising again. It is of course outperforming the market given its rising trend. Keep an eye on this one and Healthcare. Energy and Utilities look somewhat interesting right now too.
Industry Group to Watch: Food Products ($DJUSFP)
This group has a great looking rising trend. It is at resistance, but those indicators suggest a breakout ahead. We have a positive RSI that isn't quite overbought yet despite this lengthy rally. The PMO is rising strongly above the zero line. The OBV is confirming the rally. Stochastics are rising and should get back above 80 soon. Relative strength is excellent right now. The symbols that I found within this group that might interest you: TR, FDP, AVO, DOLE, POST, INGR, KHC and GIS.
Go to our Under the Hood ChartList on DecisionPoint.com to get an in-depth view of all the sectors. On StockCharts.com you can find the Industry Summary.
Good Luck & Good Trading!
- Erin
erin@decisionpoint.com
Full Disclosure: I'm 10% long, 0% short.
Watch the latest episode of the DecisionPoint Trading Room with Carl & Erin Swenlin HERE!
Technical Analysis is a windsock, not a crystal ball. --Carl Swenlin
NOTE: The stocks reported herein are from mechanical trading model scans that are based upon moving average relationships, momentum and volume. DecisionPoint analysis is then applied to get selections from the scans. The selections given should prompt readers to do a chart review using their own analysis process. This letter is not a call for a specific action to buy, sell or short any of the stocks provided. There are NO sure things or guaranteed returns on the selection of "diamonds in the rough."
Helpful DecisionPoint Links:
DecisionPoint Shared ChartList and DecisionPoint Chart Gallery
Price Momentum Oscillator (PMO)
Swenlin Trading Oscillators (STO-B and STO-V)
(c) Copyright 2025 DecisionPoint.com