
I only had a few Reader Requests come in today, but I did find three of interest. I wanted to make a note about weekly charts.
I include weekly charts to give us the context within the current move on the daily chart. I prefer them to look bullish to confirm what I'm seeing on the daily chart. However, sometimes that just isn't the case. Today I have one Reader Request with a good daily chart, but a not so good weekly chart. My note to you is to keep stocks with weak weekly charts on a short leash or basically watch them carefully in the short term. The weekly charts will often times mature bullishly, but until they do, you'll want to be proactive with the daily chart's messages.
Good Luck & Good Trading,
Erin
Today's "Diamonds in the Rough": DELL, ISRG and VALE.
Other requests: AMD, CNH, DVAX, TMQ and WPM.

Diamond Mine Trading Room:
RECORDING & DOWNLOAD LINK (2/14/2025):
Topic: DecisionPoint Diamond Mine (2/14/2025) LIVE Trading Room
Download & Recording Link
Passcode: February#14
REGISTRATION for 2/21/2025:
When: February 21, 2025 09:00 AM Pacific Time (US and Canada)
Topic: DecisionPoint Diamond Mine LIVE Trading Room
Register in advance for this webinar HERE
After registering, you will receive a confirmation email containing information about joining the webinar.

Below is the latest free DecisionPoint Trading Room recording from 2/10 (No trading room on 2/17). You'll find these recordings posted on Mondays to our DP YouTube Channel. Be sure and subscribe HERE.
Welcome to DecisionPoint Diamonds, wherein I highlight ten "Diamonds in the Rough" per week. These are selected from the results of my DecisionPoint Scans which search for stocks that could benefit from the trend and condition of the market. Remember, these are not recommendations to buy or sell, but are the most interesting of the stocks that surfaced in my scans. My objective is to save you the work of the initial, tedious culling process, but you need to apply your own analysis to see if these stocks pique your interest as well. There are no guaranteed winners here!
"Predefined Scans Triggered" are taken from StockCharts.com using the "Symbol Summary" option instead of a "SharpChart" on the workbench.
Stop levels are all rounded down.
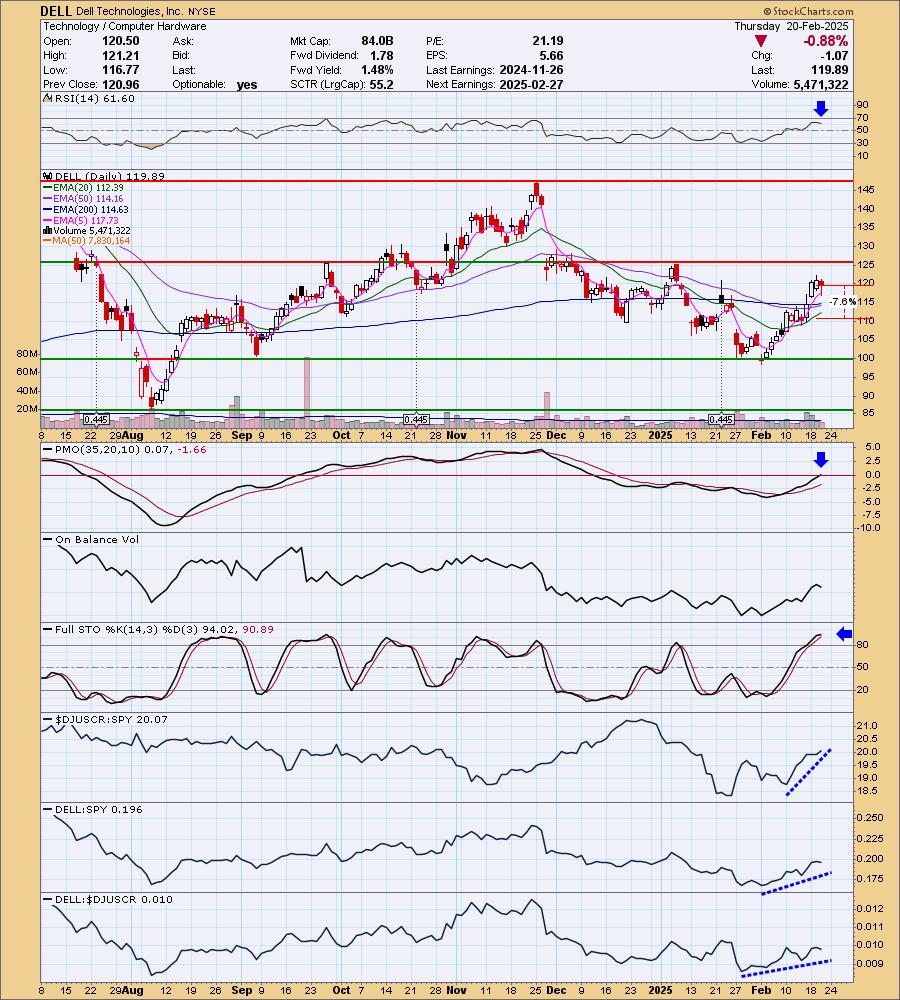
Dell Technologies, Inc. (DELL)
EARNINGS: 2025-02-27 (AMC)
Dell Technologies, Inc. is a technology company, providing customers with a broad and innovative solution portfolio to help customers modernize their information technology (IT) infrastructure, address workforce transformation, and offer critical solutions that keep people and organizations connected. It operates through the following segments: Infrastructure Solutions Group (ISG) and Client Solutions Group (CSG). The ISG segment includes servers, networking, and storage, as well as services and third-party software and peripherals that are closely tied to the sale of ISG hardware. The CSG segment includes designs for commercial and consumer customers of desktops, thin client products, and notebooks. The company was founded by Michael Saul Dell in 1984 and is headquartered in Round Rock, TX.
Predefined Scans Triggered: P&F Bearish Signal Reversal, Elder Bar Turned Blue and P&F Double Top Breakout.
DELL is down -0.17% in after hours trading. I'm lukewarm on Dell, but I must admit that the technicals look good on this rally higher. The market seems precarious given today's decline and that does make me less bullish on this one. Also, spoiler alert, the weekly chart doesn't look good. The declining trend has been broken, but overhead resistance is arriving soon. I think it has merit based on the indicators. The RSI is positive and not overbought. The PMO just entered positive territory indicating new strength not just diminishing weakness. Stochastics are above 80 and relative strength lines are all rising. I've opted for a stop beneath the 20-day EMA at 7.6% or $110.77.
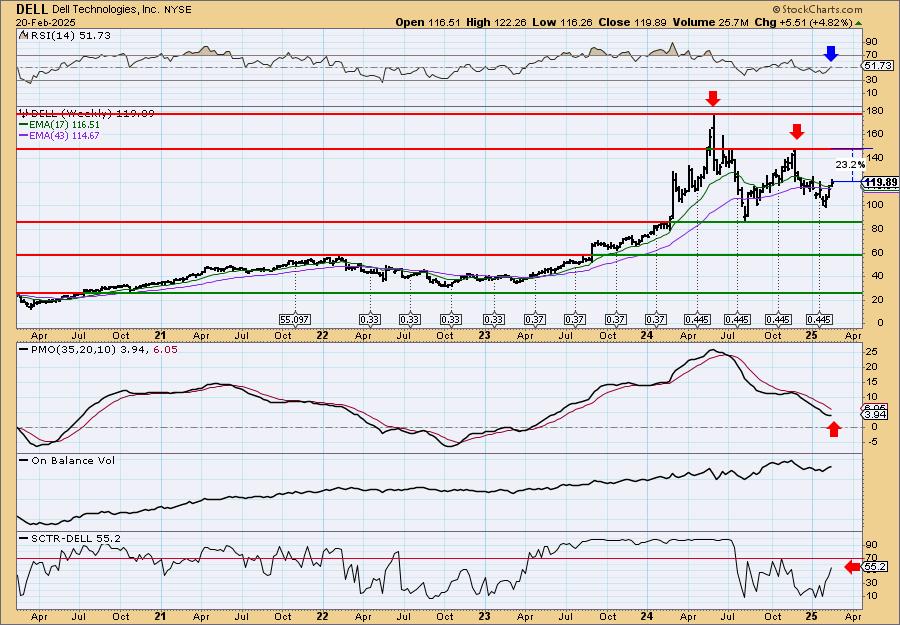
It's not the worst weekly chart I've ever seen, but there is a big bearish double top pattern. The pattern won't be aborted until price gets above at least the second top. At the same time, we got an upside reversal before price had to test support. That is a good sign. Another good sign is that the weekly RSI is positive again. The weekly PMO unfortunately is still moving lower and the StockCharts Technical Rank (SCTR) is not yet in the hot zone* above 70. If this rally can persist, there is good upside potential before it meets overhead resistance.
*If a stock is in the "hot zone" above 70, it implies that it is stronger than 70% of its universe (large-, mid-, small-caps and ETFs) primarily in the intermediate to long terms.
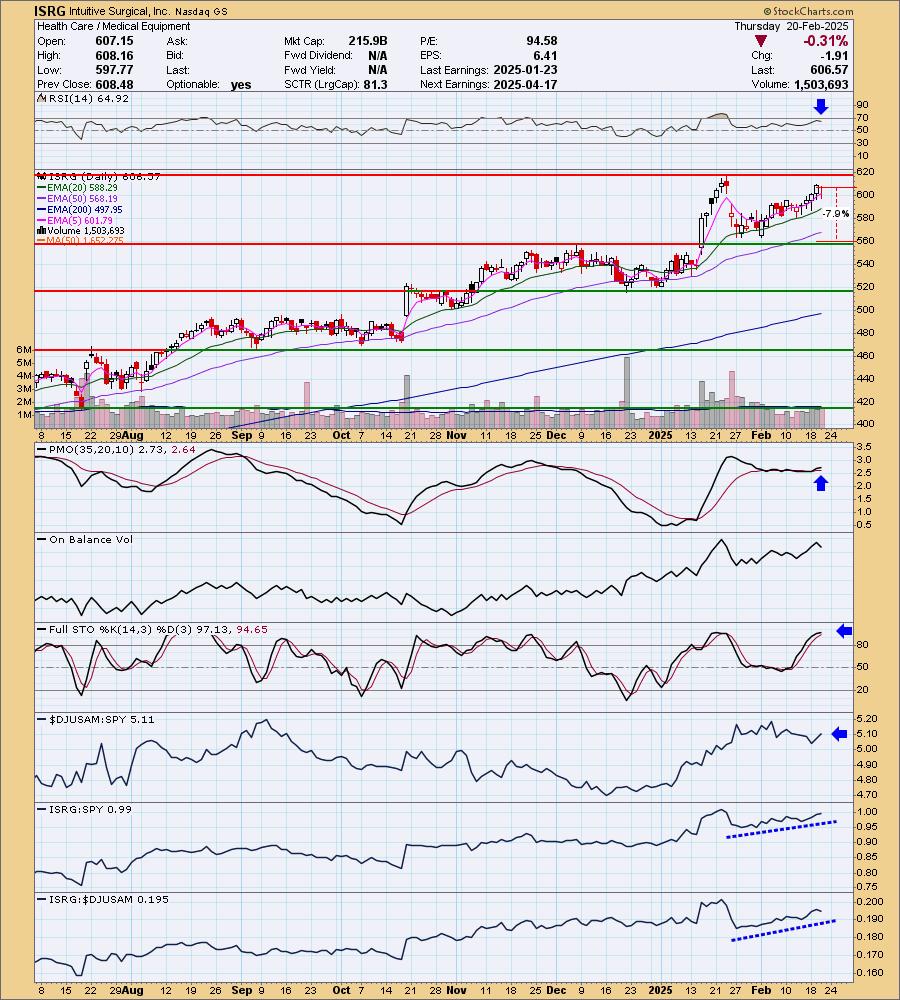
Intuitive Surgical, Inc. (ISRG)
EARNINGS: 2025-04-17 (AMC)
Intuitive Surgical, Inc. engages in the provision of robotic-assisted surgical solutions and invasive care through a comprehensive ecosystem of products and services. Its products include Da Vinci Surgical and Ion Endoluminal systems. The company was founded by Frederic H. Moll, John Gordon Freund, and Robert G. Younge in November 1995 and is headquartered in Sunnyvale, CA.
Predefined Scans Triggered: P&F Double Top Breakout.
ISRG is down -0.11% in after hours trading. I like the rally that is paring back the losses on the big gap down move. The rally is coming off solid support. It even looks a little cup with handle-ish in the short term which is bullish. The RSI is positive and not overbought. The PMO is putting margin between it and its signal line. It is also flat well above the zero line implying pure strength. Stochastics are above 80. The group hasn't been performing very well, but it is starting to see a little outperformance near-term. ISRG is doing well against the group and the SPY. I've set the stop beneath the prior lows at 7.9% or $558.65.
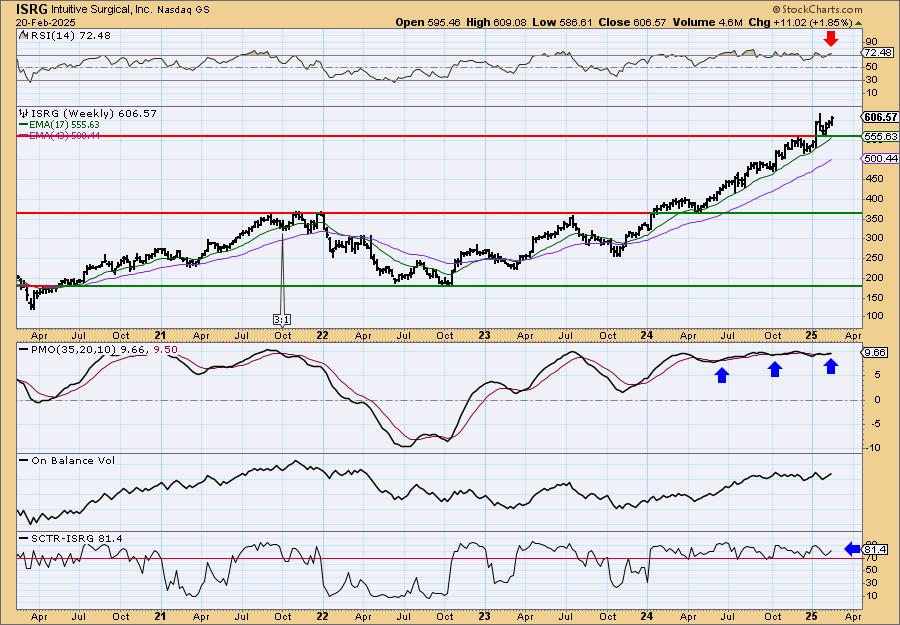
The weekly chart is very strong. We have a clear rising trend that is not parabolic. It continues to make new highs. The weekly RSI is overbought, but we can see that condition has been the norm during this rally. The weekly PMO is flat well above the zero line indicating pure strength. The SCTR is within the hot zone above 70. The OBV is a little flatter than I'd like, but overall the chart is strong. Consider a 17% upside target to about $709.69.
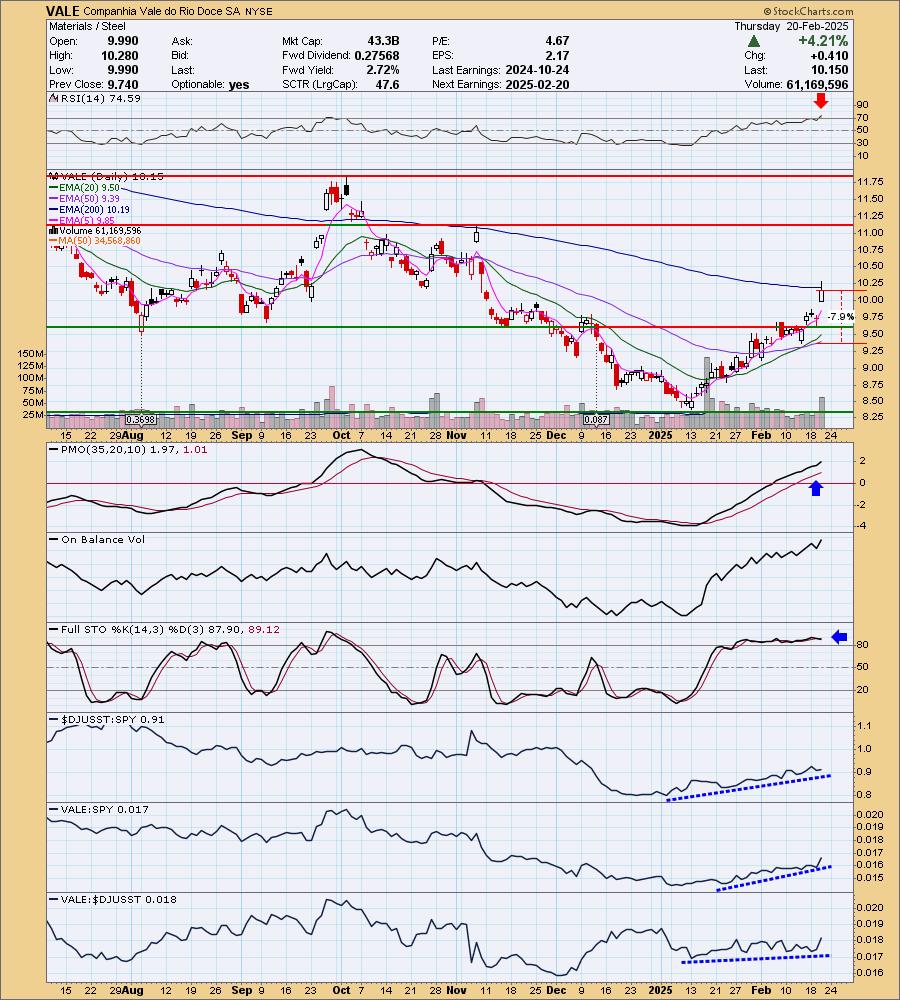
Companhia Vale do Rio Doce SA (VALE)
EARNINGS: 2025-02-20 ** Reported Today **
Vale SA engages in the production and exportation of iron ore, pellets, manganese, and iron alloys. It operates through the following segments: Iron Solutions, Energy Transition Materials, Coal and Others. The Iron Solutions segment includes the production and extraction of iron ore, iron ore pellets, manganese, other ferrous products, and logistic services. The Energy Transition Materials segment involves the production and extraction of nickel and its by-products. The Coal segment consists of the production and extraction of metallurgical and thermal coal and its logistic services. Others includes the revenues and cost of other products, services, research and development, investments in joint ventures and associates of other business. The company was founded on June 1, 1942 and is headquartered in Rio de Janeiro, Brazil.
Predefined Scans Triggered: Elder Bar Turned Green, Moved Above Upper Keltner Channel, Moved Above Upper Bollinger Band, Moved Above Ichimoku Cloud and Moved Above Upper Price Channel.
VALE is up +1.47% in after hours trading. It reported earnings today and they were well received with a nice gap up move. Steel looks very good right now and I see more followthrough ahead given this strong rally. The one problem is that it is overbought right now and it is up against resistance at the 200-day EMA. This could mean a pause or pullback ahead. The PMO is rising strongly and is accelerating higher. Stochastics are camped out above 80 signifying internal strength. VALE is performing mostly in line with the group. Both the group and VALE are outperforming the SPY which is most important. The stop is set at the 50-day EMA at 7.9% or $9.34.
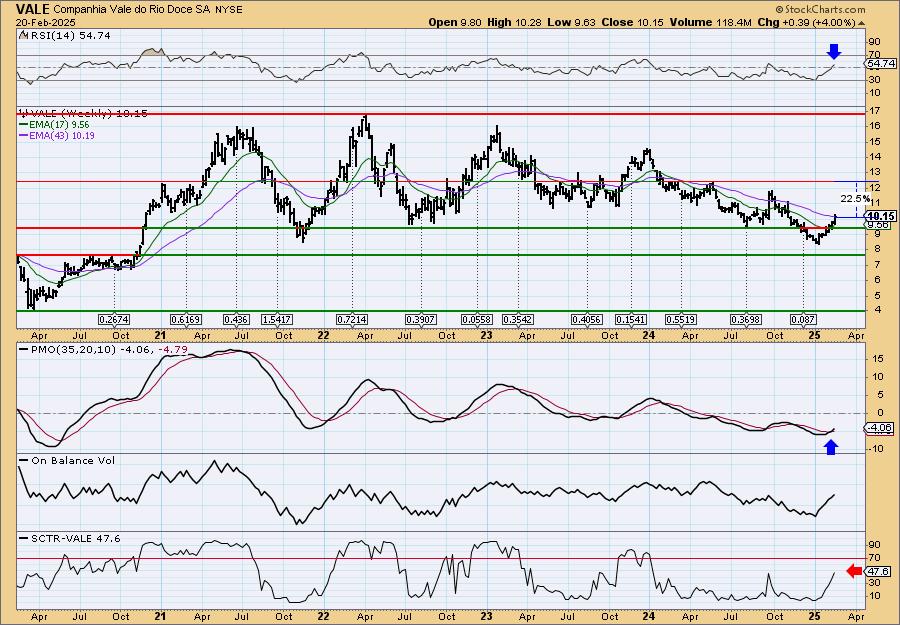
This is a mediocre weekly chart primarily because the declining trend is still intact. At the same time we do have a rebound off strong support. The weekly RSI is now in positive territory and the weekly PMO is on a Crossover BUY Signal. The SCTR is not yet in the hot zone, but it is at least headed there. I think Steel has higher to fly.
Don't forget, on Thursdays I look at reader-requested symbols, click HERE to send me an email. I read every email I receive and try to answer them all!
Current Market Outlook:
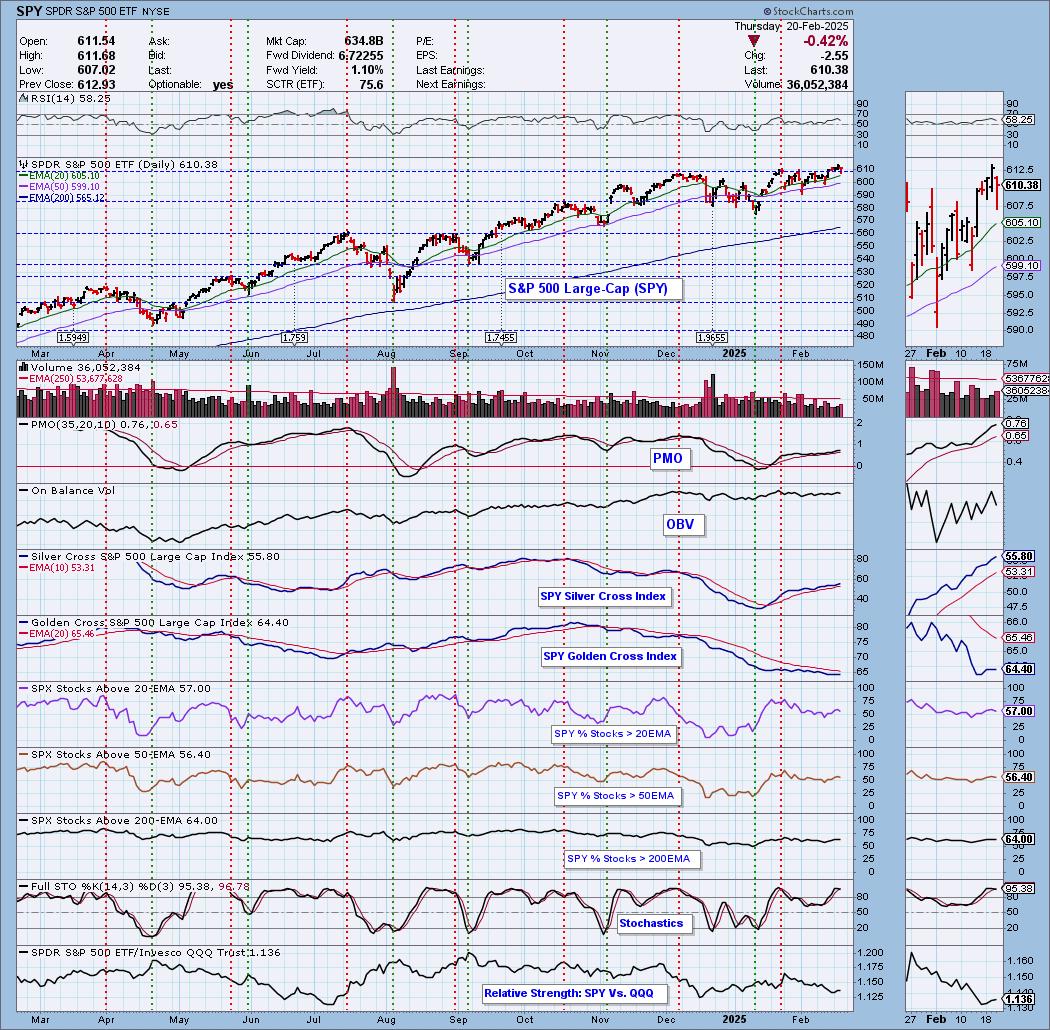
Market Environment: It is important to consider the odds for success by assessing the market tides. The following chart uses different methodologies for objectively showing the depth and trend of participation for intermediate- and long-term time frames.
- The Silver Cross Index (SCI) shows the percentage of SPX stocks on IT Trend Model BUY signals (20-EMA > 50-EMA)
- The Golden Cross Index (GCI) shows the percentage of SPX stocks on LT Trend Model BUY signals (50-EMA > 200-EMA)
Don't forget that as a "Diamonds" member, you have access to our "Under the Hood" curated ChartList on DecisionPoint.com. You'll find it under "Members Only" links on the left side on the Blogs and Links Page.
Here is the current chart:
Full Disclosure: I am 15% long, 0% short.
I'm required to disclose if I currently own a stock I mention and/or may buy/short it within the next 72 hours.
"Technical Analysis is a windsock, not a crystal ball." - Carl Swenlin
(c) Copyright 2025 DecisionPoint.com
Watch the latest episode of DecisionPoint Trading Room with Carl & Erin Swenlin Mondays on the DecisionPoint YouTube channel here!
NOTE: The stocks reported herein are from mechanical trading model scans that are based upon moving average relationships, momentum and volume. DecisionPoint analysis is then applied to get five selections from the scans. The selections given should prompt readers to do a chart review using their own analysis process. This letter is not a call for a specific action to buy, sell or short any of the stocks provided. There are NO sure things or guaranteed returns on the daily selection of "Diamonds in the Rough."
Regarding BUY/SELL Signals: The signal status reported herein is based upon mechanical trading model signals and crossovers. They define the implied bias of the price index/stock based upon moving average relationships and momentum, but they do not necessarily call for a specific action. They are information flags that should prompt chart review. Further, they do not call for continuous buying or selling during the life of the signal. For example, a BUY signal will probably (but not necessarily) return the best results if action is taken soon after the signal is generated. Additional opportunities for buying may be found as price zigzags higher, but the trader must look for optimum entry points. Conversely, exit points to preserve gains (or minimize losses) may be evident before the model mechanically closes the signal.
Helpful DecisionPoint Links:
Price Momentum Oscillator (PMO)
Swenlin Trading Oscillators (STO-B and STO-V)
For more links, go to DecisionPoint.com