
The scans did produce for ETF Day and I found two themes. I didn't go with the themes today, but thought I would share.
First was Gold. There were more ETFs that follow Gold than I knew! There were plenty. I do like Gold and I think it has higher to go, but I thought I would just share this rather than put up a Gold chart that you are already familiar with.
The second theme was Financials. While I think the group looks interesting, I found other ETFs I liked better. One I did include is the Energy Bull 2x ETF. I see some short-term strength that can be taken advantage of. I don't know that we'll see an extended rally there which is why I opted to go leveraged.
CORN was another choice today. The chart is very favorable and it looks like there is some good upside available there.
The final choice was BOTZ, the Robotics and AI ETF. I'm still not fully convinced the market will be moving higher for much longer, but for bulls out there, I think this one looks pretty good. I had to go with it based on the technicals.
Good Luck & Good Trading,
Erin
Today's "Diamonds in the Rough": BOTZ, CORN and ERX.
Runner-ups: IAU, RDVY, XLF and SMIG.

Diamond Mine Trading Room:
RECORDING & DOWNLOAD LINK (2/14/2025):
Topic: DecisionPoint Diamond Mine (2/14/2025) LIVE Trading Room
Download & Recording Link
Passcode: February#14
REGISTRATION for 2/21/2025:
When: February 21, 2025 09:00 AM Pacific Time (US and Canada)
Topic: DecisionPoint Diamond Mine LIVE Trading Room
Register in advance for this webinar HERE
After registering, you will receive a confirmation email containing information about joining the webinar.

Below is the latest free DecisionPoint Trading Room recording from 2/10 (No trading room on 2/17). You'll find these recordings posted on Mondays to our DP YouTube Channel. Be sure and subscribe HERE.
Welcome to DecisionPoint Diamonds, wherein I highlight ten "Diamonds in the Rough" per week. These are selected from the results of my DecisionPoint Scans which search for stocks that could benefit from the trend and condition of the market. Remember, these are not recommendations to buy or sell, but are the most interesting of the stocks that surfaced in my scans. My objective is to save you the work of the initial, tedious culling process, but you need to apply your own analysis to see if these stocks pique your interest as well. There are no guaranteed winners here!
"Predefined Scans Triggered" are taken from StockCharts.com using the "Symbol Summary" option instead of a "SharpChart" on the workbench.
Stop levels are all rounded down.
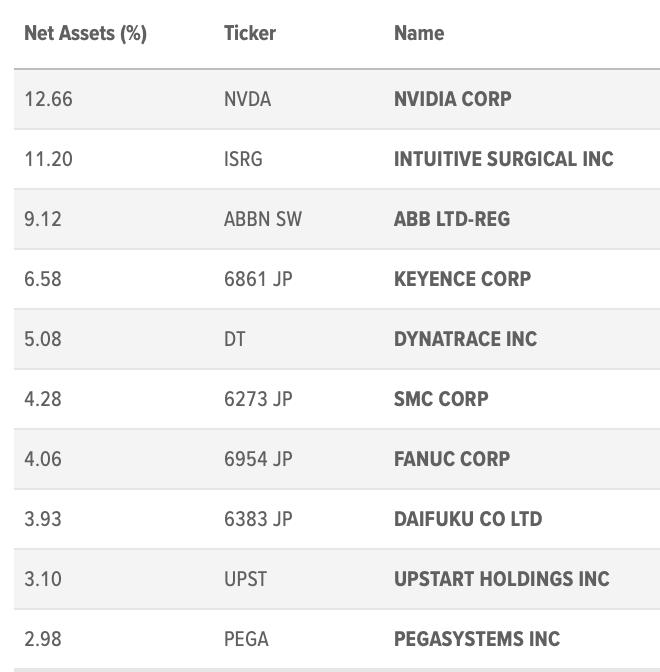
Global X Robotics & Artificial Intelligence Thematic ETF (BOTZ)
EARNINGS: N/A
BOTZ provides market- cap selected and weighted exposure to companies involved in the development and production of robots or artificial intelligence. Click HERE for more information.
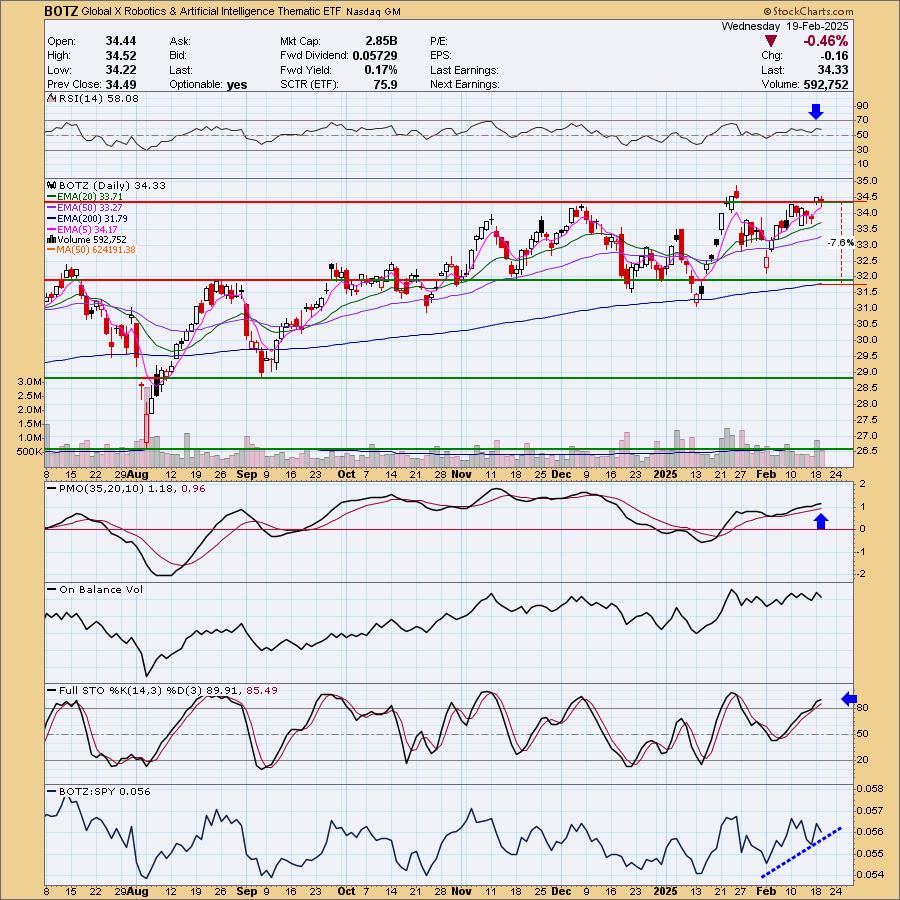
Predefined Scans Triggered: P&F Double Top Breakout and Ichimoku Cloud Turned Red.
BOTZ is up +0.03% in after hours trading. We have been in a trading range for months, but yesterday broke out. It pulled back toward new support which is good. I like breakouts with pullbacks after. The RSI is positive and not at all overbought. The PMO is rising above the zero line on a Crossover BUY Signal. Stochastics are above 80 and rising. We can even see some outperformance by the ETF against the SPY. I'm looking for some followthrough on this breakout. The stop is set at the 200-day EMA at 7.6% or $31.72.
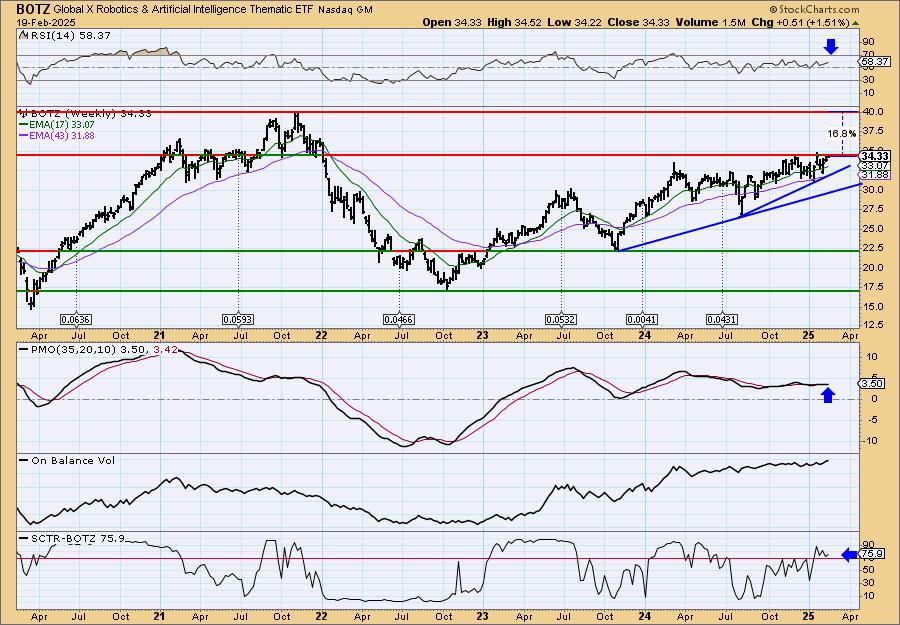
This is a strong area of overhead resistance so it isn't surprising that it is struggling to breakout here. However, we have a solid rising trend and a shorter-term rising trend that looks encouraging for a breakout. The weekly RSI is positive. The weekly PMO is flat above the zero line suggesting pure strength. It is also on a Crossover BUY Signal. The StockCharts Technical Rank (SCTR) is inside the hot zone*. I'm looking for at least a test of all-time highs.
*If a stock is in the "hot zone" above 70, it implies that it is stronger than 70% of its universe (large-, mid-, small-caps and ETFs) primarily in the intermediate to long terms.
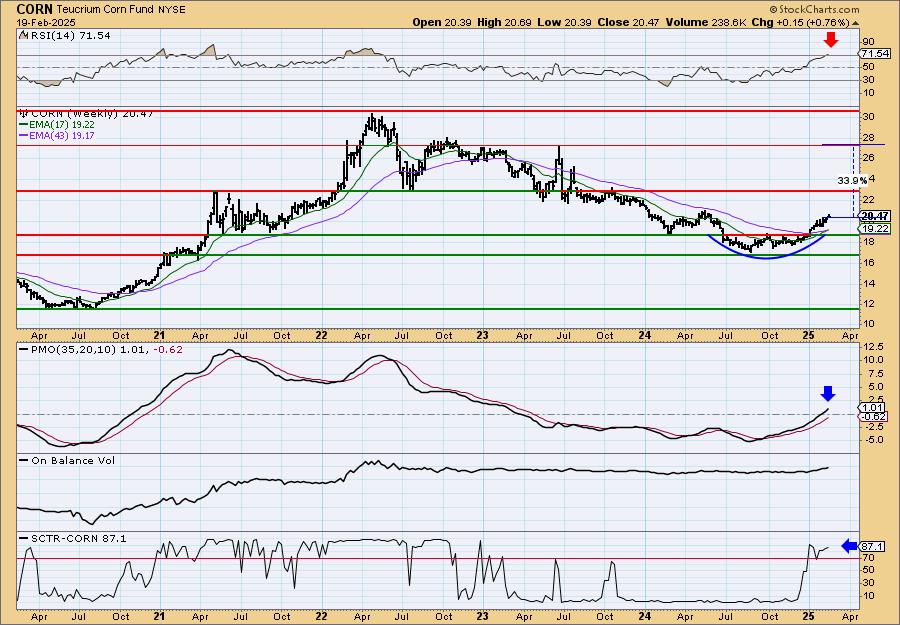
Teucrium Corn Fund (CORN)
EARNINGS: N/A
CORN tracks an index of corn futures contracts. It reflects the performance of corn by holding Chicago Board of Trade corn futures contracts with three different expiration dates. Click HERE for more information.
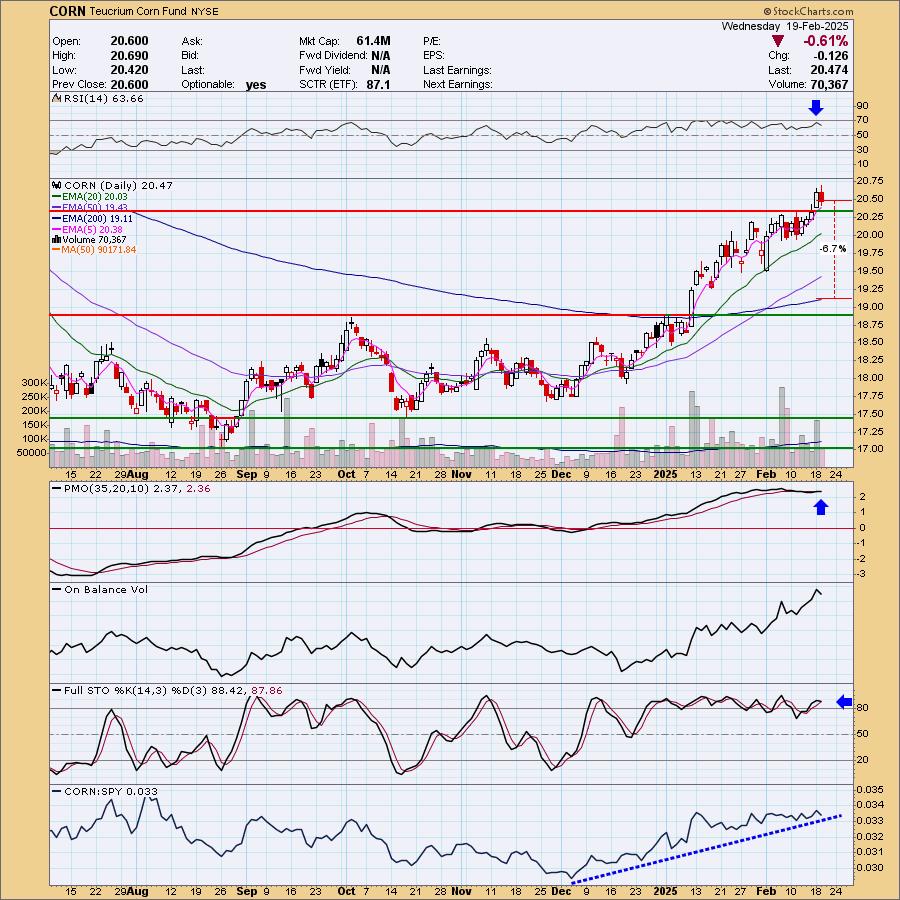
Predefined Scans Triggered: P&F Low Pole.
CORN is down -0.26% in after hours trading. We have a strong rising trend that attracted my attention. We have a breakout and a pullback. The RSI is positive and not overbought. The PMO is flat above the zero line indicating pure strength. It is also on a new Crossover BUY Signal. Volume continues to come in as the OBV is rising to confirm this advance. Stochastics did top, but they are holding above 80 and have spent most of this rally above 80. The stop is set at the 200-day EMA at 6.7% or $19.09.
This does look like a winner that will keep on winning based on the beautiful saucer-shaped basing pattern on the weekly chart. The weekly RSI is overbought now so a pause could be setting up soon. However, we have a strongly rising weekly PMO and the SCTR is in the hot zone above 70.
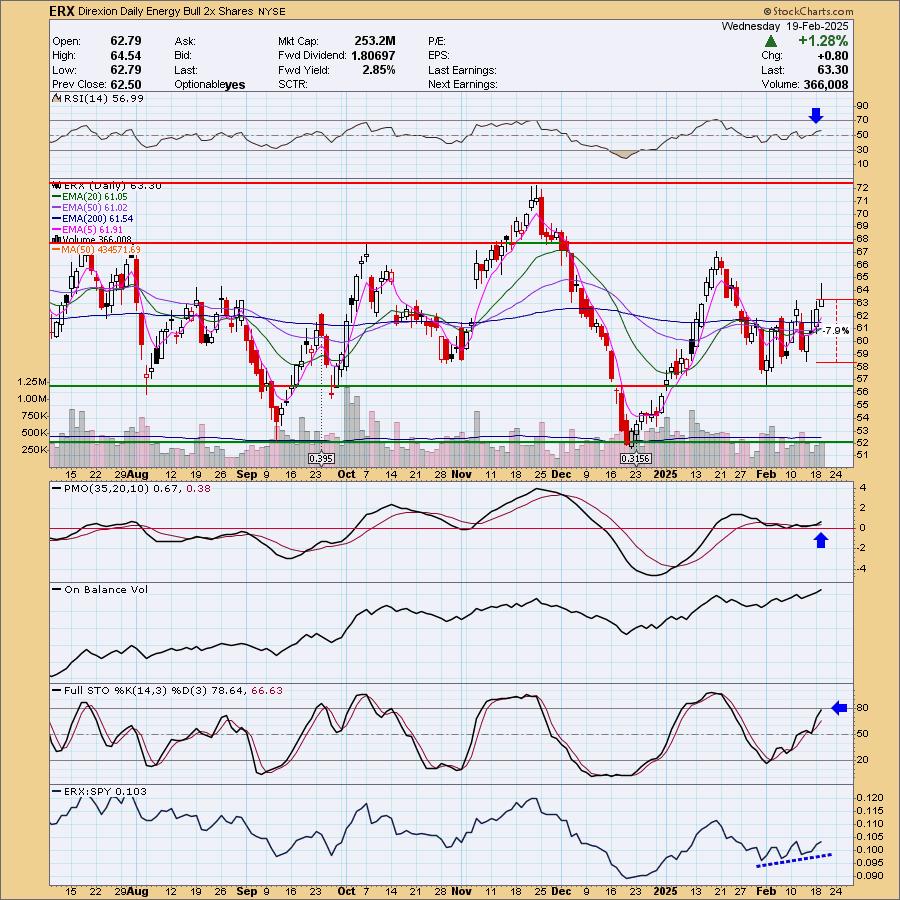
Direxion Daily Energy Bull 2x Shares (ERX)
EARNINGS: N/A
ERX provides 2x leveraged exposure to a market-cap-weighted index of US large-cap companies in the energy industry. Click HERE for more information.
Predefined Scans Triggered: P&F Ascending Triple Top Breakout, New CCI Buy Signals and P&F Double Top Breakout.
ERX is down -1.25% in after hours trading. I like this reversal off support and the rising trend that goes along with it. The RSI is positive and not overbought. The PMO is rising above the zero line and is putting margin between it and its signal line now. The OBV is rising to confirm the rally. Stochastics are just about ready to move above 80. We can also see some outperformance from this ETF against the SPY. It is leveraged so you may want a deeper stop, but for me, if the rising trend is compromised, I would probably be out. The stop is at 7.9% or $58.29.
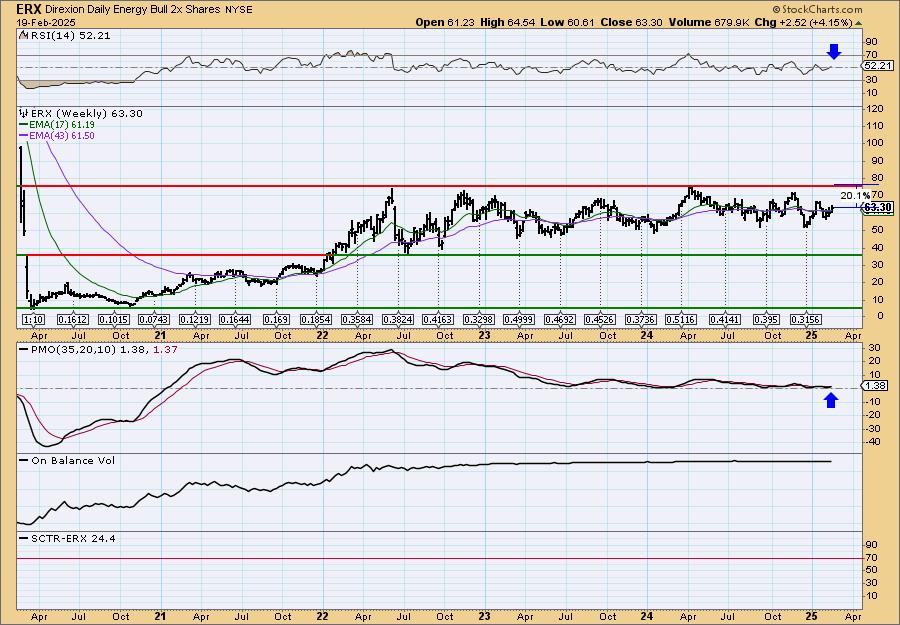
It is traveling in a sideways trading range, so we are going to try to play it as price pushes toward resistance. The weekly RSI just moved into positive territory and the weekly PMO is on a Crossover BUY Signal. The weekly PMO is very flat against the zero line which is due to the trading range. It isn't a sign of strength nor is it a sign of weakness.
Don't forget, on Thursdays I look at reader-requested symbols, click HERE to send me an email. I read every email I receive and try to answer them all!
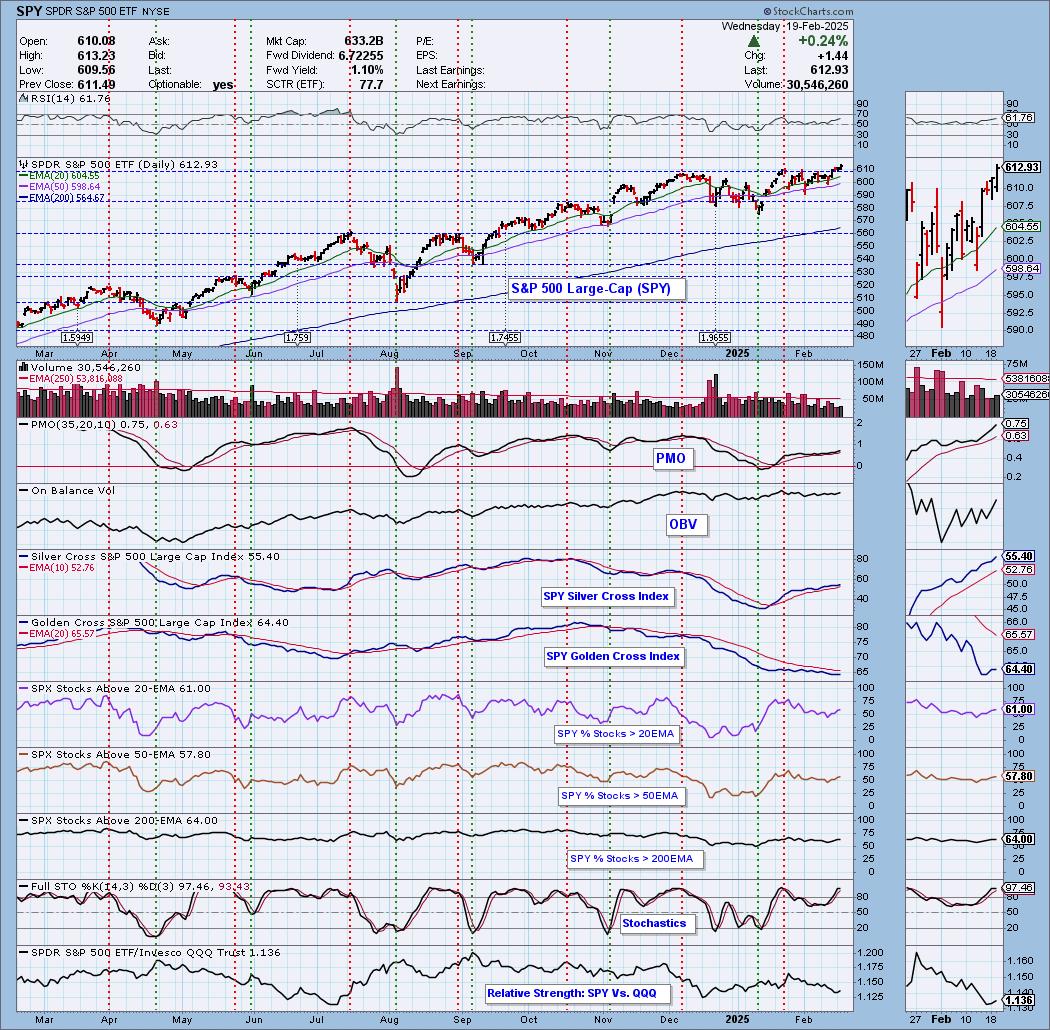
Current Market Outlook:
Market Environment: It is important to consider the odds for success by assessing the market tides. The following chart uses different methodologies for objectively showing the depth and trend of participation for intermediate- and long-term time frames.
- The Silver Cross Index (SCI) shows the percentage of SPX stocks on IT Trend Model BUY signals (20-EMA > 50-EMA)
- The Golden Cross Index (GCI) shows the percentage of SPX stocks on LT Trend Model BUY signals (50-EMA > 200-EMA)
Don't forget that as a "Diamonds" member, you have access to our "Under the Hood" curated ChartList on DecisionPoint.com. You'll find it under "Members Only" links on the left side on the Blogs and Links Page.
Here is the current chart:
Full Disclosure: I am 15% long, 0% short.
I'm required to disclose if I currently own a stock I mention and/or may buy/short it within the next 72 hours.
"Technical Analysis is a windsock, not a crystal ball." - Carl Swenlin
(c) Copyright 2025 DecisionPoint.com
Watch the latest episode of DecisionPoint Trading Room with Carl & Erin Swenlin Mondays on the DecisionPoint YouTube channel here!
NOTE: The stocks reported herein are from mechanical trading model scans that are based upon moving average relationships, momentum and volume. DecisionPoint analysis is then applied to get five selections from the scans. The selections given should prompt readers to do a chart review using their own analysis process. This letter is not a call for a specific action to buy, sell or short any of the stocks provided. There are NO sure things or guaranteed returns on the daily selection of "Diamonds in the Rough."
Regarding BUY/SELL Signals: The signal status reported herein is based upon mechanical trading model signals and crossovers. They define the implied bias of the price index/stock based upon moving average relationships and momentum, but they do not necessarily call for a specific action. They are information flags that should prompt chart review. Further, they do not call for continuous buying or selling during the life of the signal. For example, a BUY signal will probably (but not necessarily) return the best results if action is taken soon after the signal is generated. Additional opportunities for buying may be found as price zigzags higher, but the trader must look for optimum entry points. Conversely, exit points to preserve gains (or minimize losses) may be evident before the model mechanically closes the signal.
Helpful DecisionPoint Links:
Price Momentum Oscillator (PMO)
Swenlin Trading Oscillators (STO-B and STO-V)
For more links, go to DecisionPoint.com