
I still sense we are nearing a market top, but it was clear that I didn't need to go short today based on what I'm seeing in the DP Alert on primary indicators. I also didn't have a large amount of shorting candidates in the Diamond Dog Scan.
Let's take advantage of any more upside the market will give us, but set stops for protection against a market downturn. It sure doesn't want to fall right now. It is tough as I'm only 15% exposed and I'm not confident enough in the market to expand exposure greatly. I might add one or two of today's positions depending on how the market opens tomorrow. I hate sitting on the sidelines.
Good Luck & Good Trading,
Erin
Today's "Diamonds in the Rough": ALB, NRG, SNEX and VFC.
Runner-ups: NPK and CXM.

Diamond Mine Trading Room:
RECORDING & DOWNLOAD LINK (2/14/2025):
Topic: DecisionPoint Diamond Mine (2/14/2025) LIVE Trading Room
Download & Recording Link
Passcode: February#14
REGISTRATION for 2/21/2025:
When: February 21, 2025 09:00 AM Pacific Time (US and Canada)
Topic: DecisionPoint Diamond Mine LIVE Trading Room
Register in advance for this webinar HERE
After registering, you will receive a confirmation email containing information about joining the webinar.

Below is the latest free DecisionPoint Trading Room recording from 2/10 (No trading room on 2/17). You'll find these recordings posted on Mondays to our DP YouTube Channel. Be sure and subscribe HERE.
Welcome to DecisionPoint Diamonds, wherein I highlight ten "Diamonds in the Rough" per week. These are selected from the results of my DecisionPoint Scans which search for stocks that could benefit from the trend and condition of the market. Remember, these are not recommendations to buy or sell, but are the most interesting of the stocks that surfaced in my scans. My objective is to save you the work of the initial, tedious culling process, but you need to apply your own analysis to see if these stocks pique your interest as well. There are no guaranteed winners here!
"Predefined Scans Triggered" are taken from StockCharts.com using the "Symbol Summary" option instead of a "SharpChart" on the workbench.
Stop levels are all rounded down.
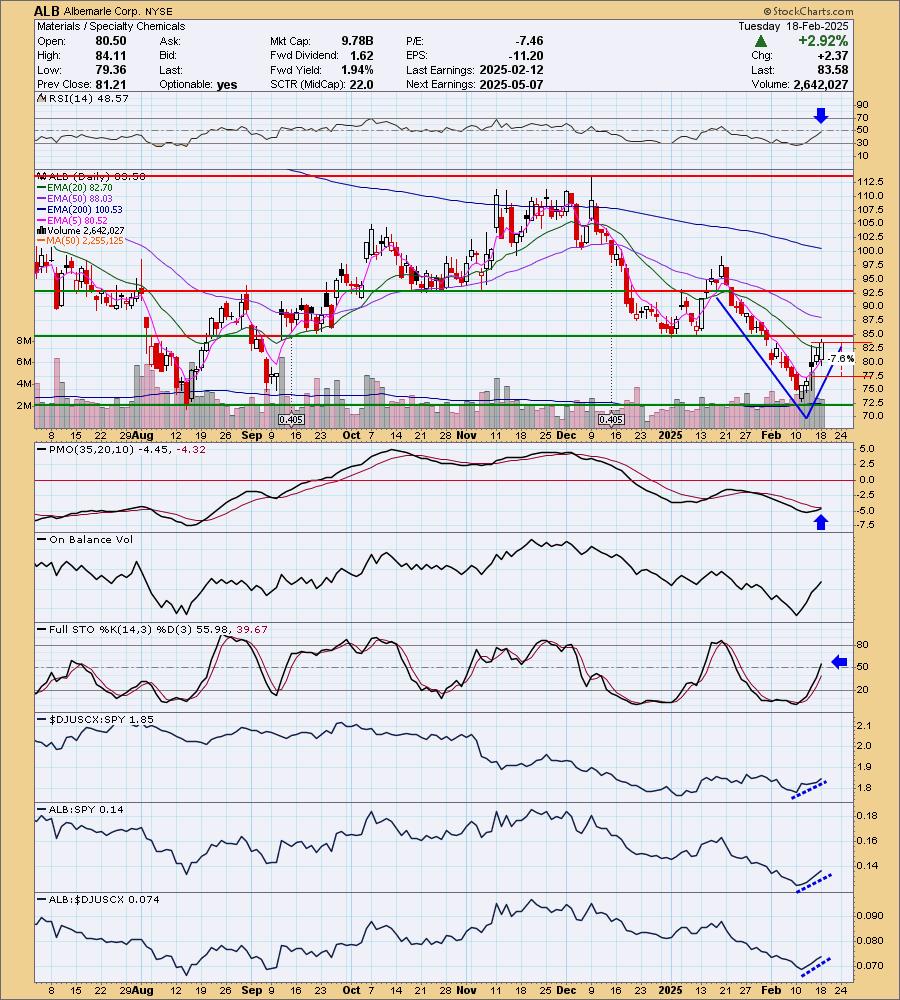
Albemarle Corp. (ALB)
EARNINGS: 2025-05-07 (AMC)
Albemarle Corp. engages in the development, manufacture, and marketing of chemicals for consumer electronics, petroleum refining, utilities, packaging, construction, transportation, pharmaceuticals, crop production, food-safety, and custom chemistry services. It operates through the following segments: Energy Storage, Specialties, Ketjen, and All Other. The Energy Storage segment develops and manufactures a broad range of basic lithium compounds, including lithium carbonate, lithium hydroxide, and lithium chloride. The Specialties segment focuses on optimizing a portfolio of bromine and specialized lithium solutions. The Ketjen segment consists of clean fuels technologies, fluidized catalytic cracking catalysts and additives, and performance catalyst solutions, which is primarily composed of organometallics and curatives. The All Other segment refers only to the FCS business that did not fit into any of the company's core businesses. The company was founded in 1993 and is headquartered in Charlotte, NC.
Predefined Scans Triggered: P&F Triple Top Breakout, Bullish MACD Crossovers and P&F Double Top Breakout.
ALB is up +0.01% in after hours trading. I liked this strong "V" Bottom chart pattern. The bounce is coming off strong support at the August low. Once 1/3rd of the "V" is retraced, the upside expectation is a breakout above the left side of the "V" which would mean a move up to $100 or more. The RSI is not positive yet, but is on its way. The PMO is nearing a Crossover BUY Signal. Stochastics are rising strongly in positive territory. Relative strength lines are all rising so the group is outperforming and ALB is outperforming the group and the SPY. I've set the stop arbitrarily at 7.6% or $77.22.
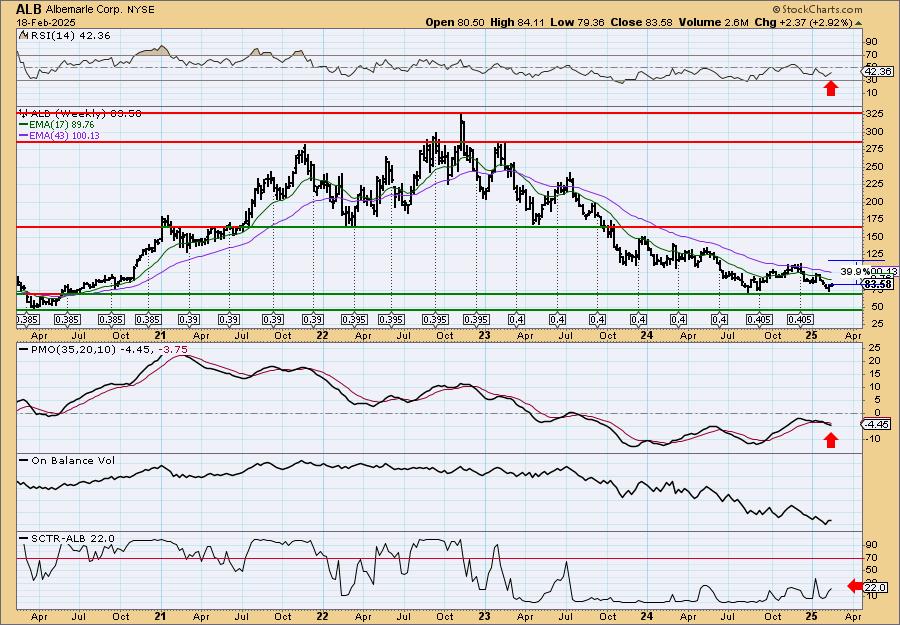
This is a reversal candidate so the weekly chart doesn't look that good. There is still a long-term declining trend to contend with. The weekly RSI is negative and the weekly PMO is falling on a Crossover SELL Signal. The StockCharts Technical Rank (SCTR) is not anywhere close to the hot zone*. Keep this one in the very short term at least until the declining trend is broken. It has very good upside potential if this rally can keep it moving in the right direction.
*If a stock is in the "hot zone" above 70, it implies that it is stronger than 70% of its universe (large-, mid-, small-caps and ETFs) primarily in the intermediate to long terms.
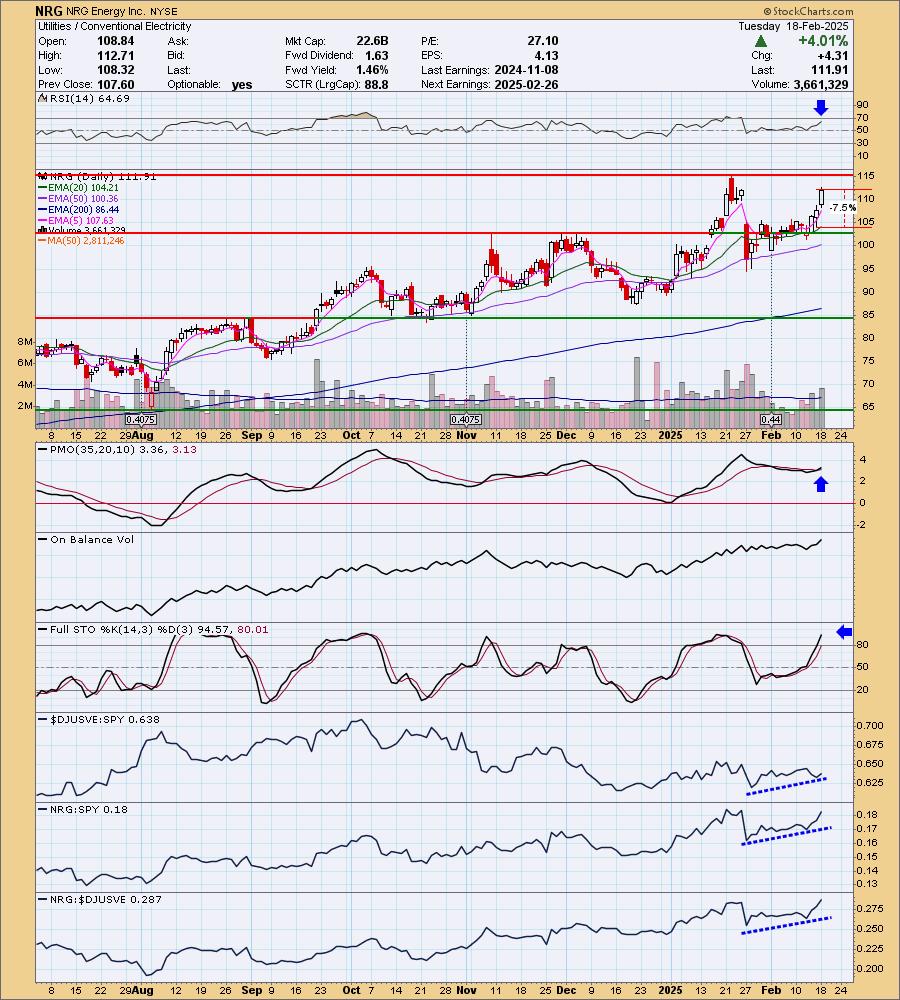
NRG Energy Inc. (NRG)
EARNINGS: 2025-02-26 (BMO)
NRG Energy, Inc. engages in the production, sale, and distribution of energy and energy services. It operates through the following segments: Generation, Retail, and Corporate. The Generation segment includes all power plant activities, domestic and international, as well as renewables. The Retail segment includes mass customers and business solutions, and other distributed and reliability products. The Corporate segment includes residential solar and electric vehicle services. The company was founded in 1989 and is headquartered in Houston, TX.
Predefined Scans Triggered: Parabolic SAR Buy Signals, New CCI Buy Signals and P&F double Top Breakout.
NRG is down -0.48% in after hours trading. I like the recuperation of price after its bad gap down. We are seeing an acceleration in the rally now. The RSI is positive and not overbought. There is a new PMO Crossover BUY Signal and Stochastics are headed higher while above 80. I like Utilities and the Conventional Electricity group is outperforming overall. NRG is showing leadership within the group and against the SPY. I've set the stop beneath the 20-day EMA at 7.5% or $103.51.
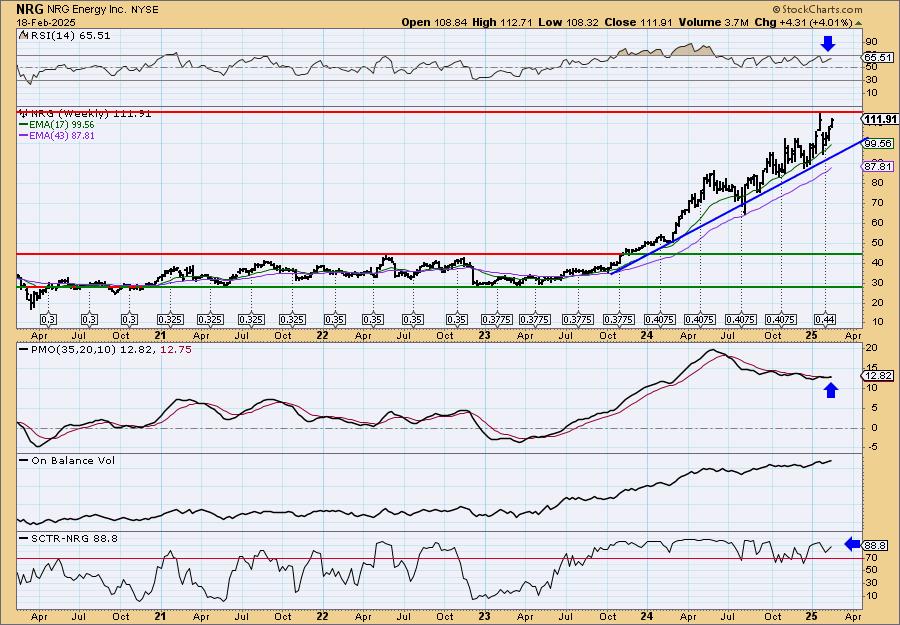
We have a very strong weekly chart showing a strong breakout and rising trend out of a long-term base. The backstory is that AI data centers will need electricity en masse so this industry group should continue to outperform. The weekly RSI is positive and the weekly PMO is on a Crossover BUY Signal. The SCTR is in the hot zone.
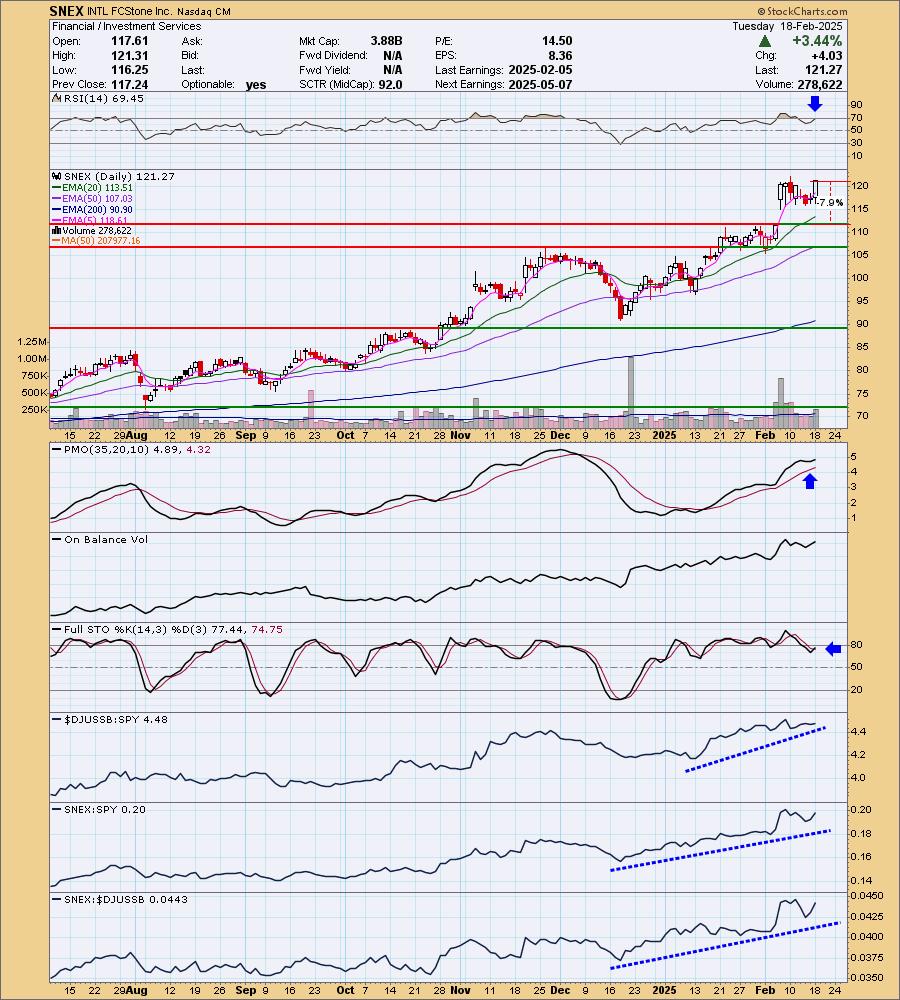
INTL FCStone Inc. (SNEX)
EARNINGS: 2025-05-07 (AMC)
StoneX Group, Inc. engages in the provision of brokerage and financial services. It operates through the following segments: Commercial Hedging, Global Payments, Securities, Physical Commodities, and Clearing and Execution Services. The Commercial Hedging segment offers risk management consulting services. The Global Payments segment includes global payment solutions for banks, commercial businesses, charities, non-governmental, and government organizations. The Securities segment consists of corporate finance advisory services and capital market solutions for middle market clients. The Physical Commodities segment consists of physical precious metals trading and the physical agricultural and energy commodity businesses. The Clearing and Execution Services segment refers to exchange-traded futures and options, foreign exchange prime brokerage, correspondent clearing, independent wealth management, and derivative voice brokerage. The company was founded by Diego J. Veitia in October 1987 and is headquartered in New York, NY.
Predefined Scans Triggered: Elder Bar Turned Green, P&F Ascending Triple Top Breakout, New CCI Buy Signals, P&F Double Top Breakout and Moved Above Upper Keltner Channel.
SNEX is up +0.03% in after hours trading. I like how this one is stair stepping up on a nice rising trend. The only issue here is that we have an island formation so it is vulnerable to a possible gap down. However, given the set up of the indicators I think that is unlikely to happen. The RSI is positive although getting overbought. The PMO shows a Surge above the signal line. Stochastics have turned back up in positive territory. Relative strength is rising for the group and SNEX against the SPY and SNEX is showing leadership among the group. I've set the stop below gap support at 7.9% or $111.68.
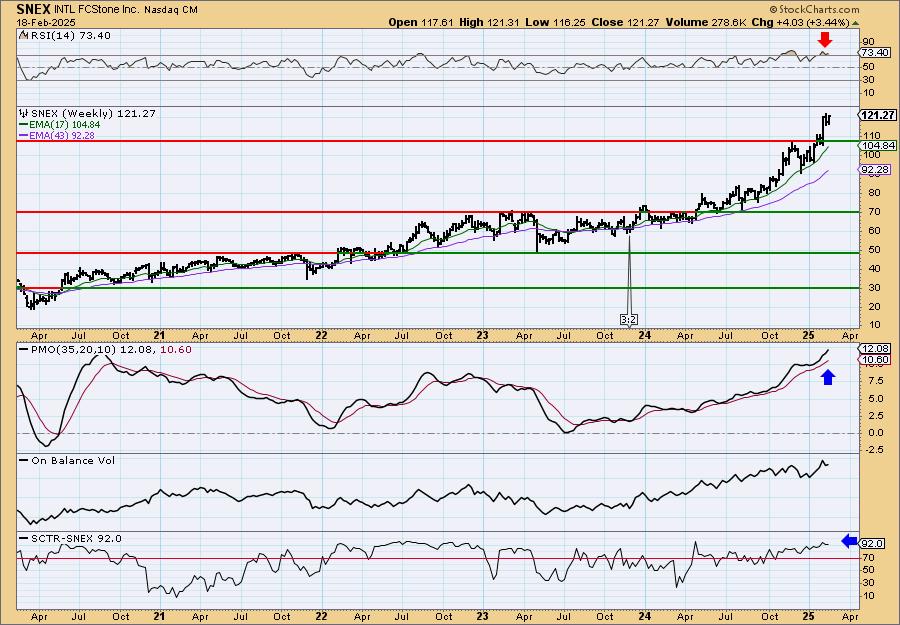
This one is getting a bit parabolic so you'll definitely want to set a stop. The rally is supported by strong indicators. The weekly RSI is unfortunately overbought. The weekly PMO looks excellent as it rises almost vertically well above the zero line on a Crossover BUY Signal. The SCTR is at the top of the hot zone. Consider a 17% upside target to about $141.88.
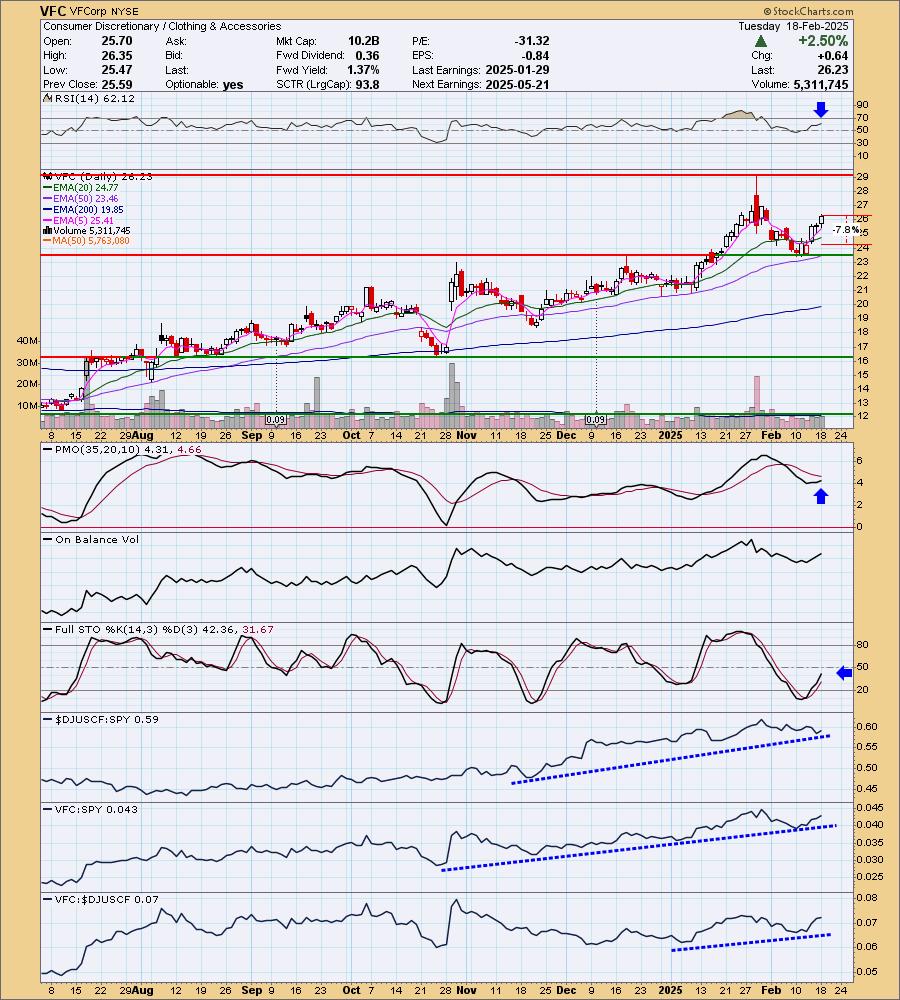
VFCorp (VFC)
EARNINGS: 2025-05-21 (BMO)
VF Corp. engages in the business of producing and marketing apparel, footwear, and accessories. It operates through the following segments: Outdoor, Active, Work, and Other. The Outdoor segment includes authentic outdoor-based lifestyle brands such as performance-based and outdoor apparel, footwear, and equipment. The Active segment focuses on activity-based lifestyle brands including active apparel, footwear, backpacks, luggage, and accessories. The Work segment offers work and work-inspired lifestyle brands with product offerings including apparel, footwear, and accessories. The Other segment refers to the sale of non-VF products and sourcing activities related to transition services. The company was founded by John Barbey in October 1899 and is headquartered in Denver, CO.
Predefined Scans Triggered: None.
VFC is down -0.30% in after hours trading. This looks like a bull flag formation with a solid rally off support. The RSI is positive and not overbought. The PMO is rising well above the zero line toward a Crossover BUY Signal. Stochastics are rising nicely. Relative strength for the group is looking pretty good although it is slowing down a bit right now (tariffs?). Overall VFC is outperforming the SPY and its industry group. I've set the stop between the 20/50-day EMAs at 7.8% or $24.18.
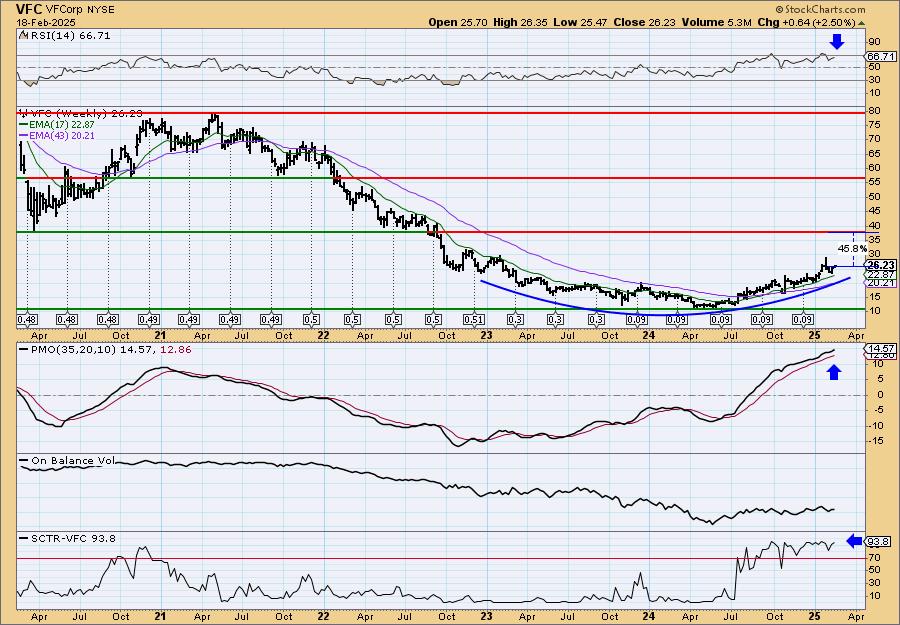
I like the setup on the weekly chart. We have a very nice saucer-shaped base. The weekly RSI is positive and the weekly PMO is rising well above the zero line on a Crossover BUY Signal. The SCTR is in the hot zone. Tariffs may cause some turbulence, but so far so good.
Don't forget, on Thursdays I look at reader-requested symbols, click HERE to send me an email. I read every email I receive and try to answer them all!
Current Market Outlook:
Market Environment: It is important to consider the odds for success by assessing the market tides. The following chart uses different methodologies for objectively showing the depth and trend of participation for intermediate- and long-term time frames.
- The Silver Cross Index (SCI) shows the percentage of SPX stocks on IT Trend Model BUY signals (20-EMA > 50-EMA)
- The Golden Cross Index (GCI) shows the percentage of SPX stocks on LT Trend Model BUY signals (50-EMA > 200-EMA)
Don't forget that as a "Diamonds" member, you have access to our "Under the Hood" curated ChartList on DecisionPoint.com. You'll find it under "Members Only" links on the left side on the Blogs and Links Page.
Here is the current chart:
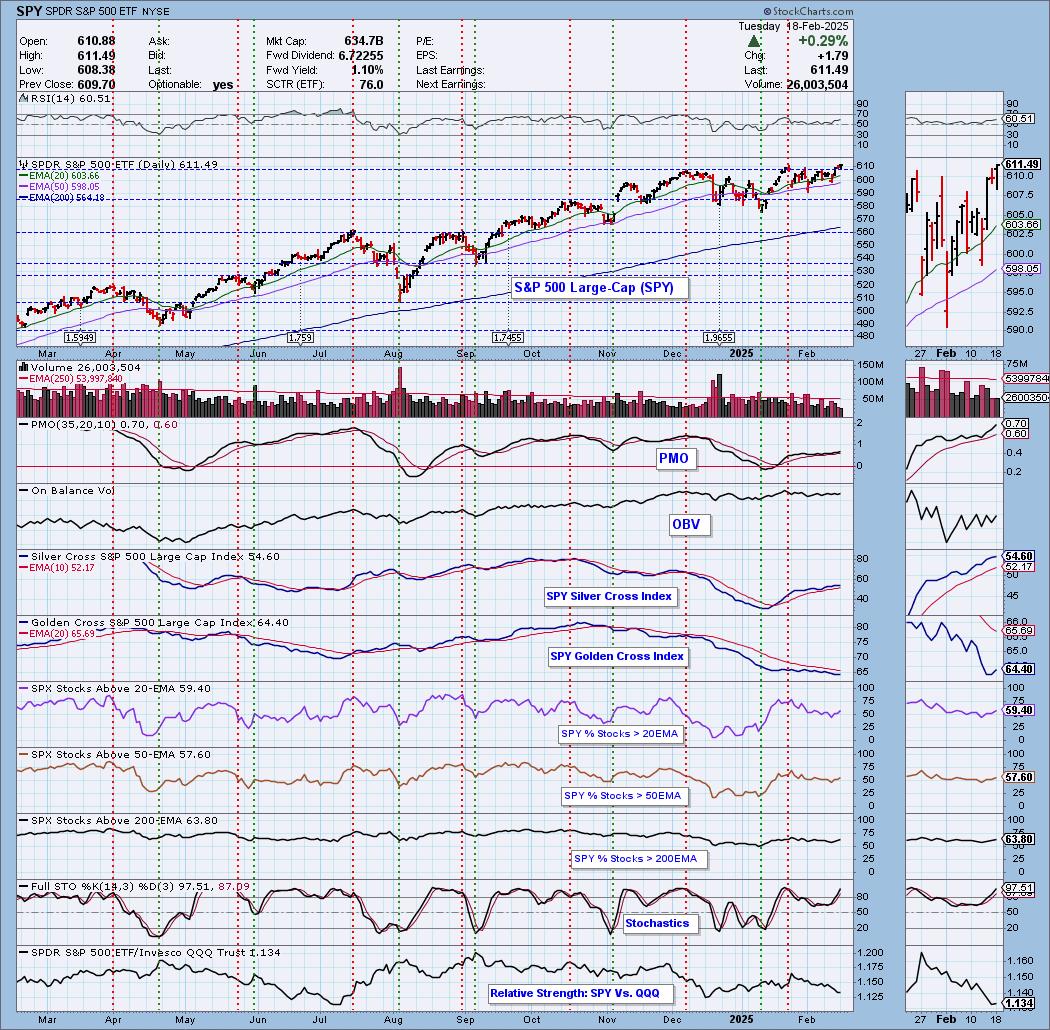
Full Disclosure: I am 15% long, 0% short.
I'm required to disclose if I currently own a stock I mention and/or may buy/short it within the next 72 hours.
"Technical Analysis is a windsock, not a crystal ball." - Carl Swenlin
(c) Copyright 2025 DecisionPoint.com
Watch the latest episode of DecisionPoint Trading Room with Carl & Erin Swenlin Mondays on the DecisionPoint YouTube channel here!
NOTE: The stocks reported herein are from mechanical trading model scans that are based upon moving average relationships, momentum and volume. DecisionPoint analysis is then applied to get five selections from the scans. The selections given should prompt readers to do a chart review using their own analysis process. This letter is not a call for a specific action to buy, sell or short any of the stocks provided. There are NO sure things or guaranteed returns on the daily selection of "Diamonds in the Rough."
Regarding BUY/SELL Signals: The signal status reported herein is based upon mechanical trading model signals and crossovers. They define the implied bias of the price index/stock based upon moving average relationships and momentum, but they do not necessarily call for a specific action. They are information flags that should prompt chart review. Further, they do not call for continuous buying or selling during the life of the signal. For example, a BUY signal will probably (but not necessarily) return the best results if action is taken soon after the signal is generated. Additional opportunities for buying may be found as price zigzags higher, but the trader must look for optimum entry points. Conversely, exit points to preserve gains (or minimize losses) may be evident before the model mechanically closes the signal.
Helpful DecisionPoint Links:
Price Momentum Oscillator (PMO)
Swenlin Trading Oscillators (STO-B and STO-V)
For more links, go to DecisionPoint.com