
I opted to present hedges this week and the market decided it would go up a bit higher. They were hit rather hard. I opted to take the inverse Bond ETF off the table, but am leaving the other two hedges in your court. They didn't have a good week, but they are still good hedges if the market takes a turn for the worse. Internals are very weak so we are not confident this rally will continue unabated.
The Darling this week was Byrna Technologies (BYRN). It was up +1.45% since being picked on Tuesday. I'm a bit nervous about this one as it was mentioned that President Trump wants to lower defense spending. It wouldn't happen anytime soon, but it could put a damper on Defense stocks like BYRN so proceed with caution.
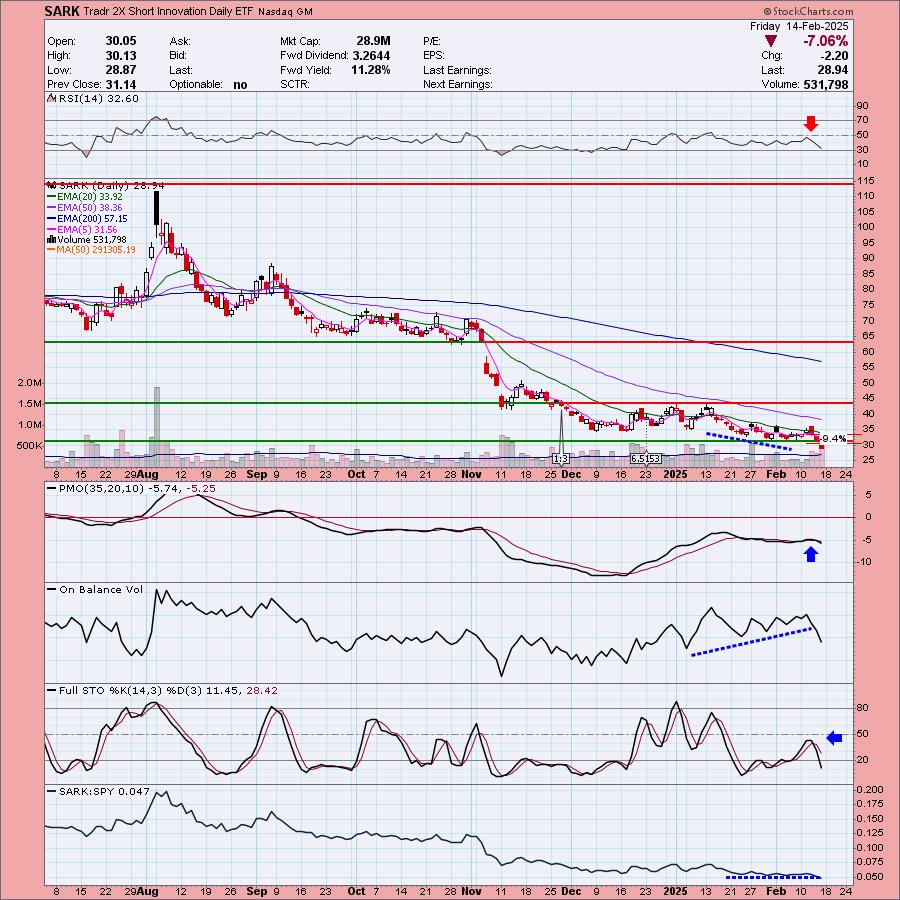
The Dud this week was the inverse Innovation ETF (SARK). This hedge hit its stop on the market rally in Tech today. I still think this is a possible hedge moving into next week if you're ready for one.
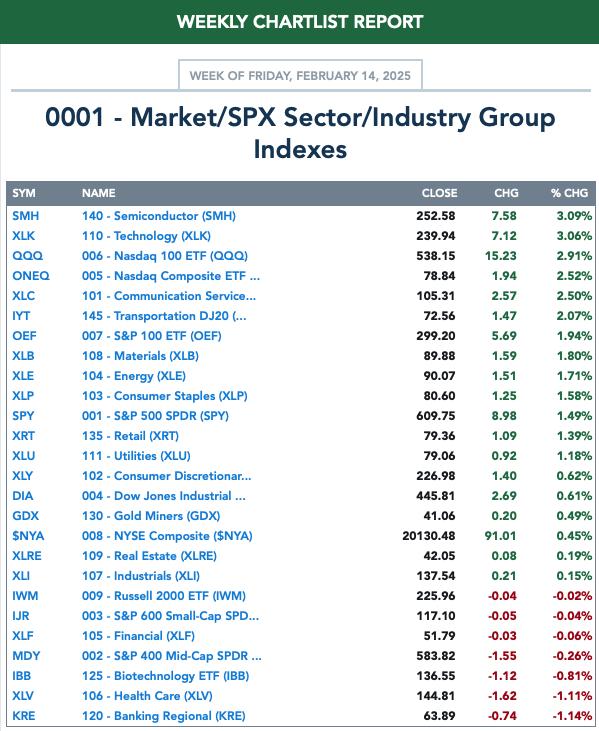
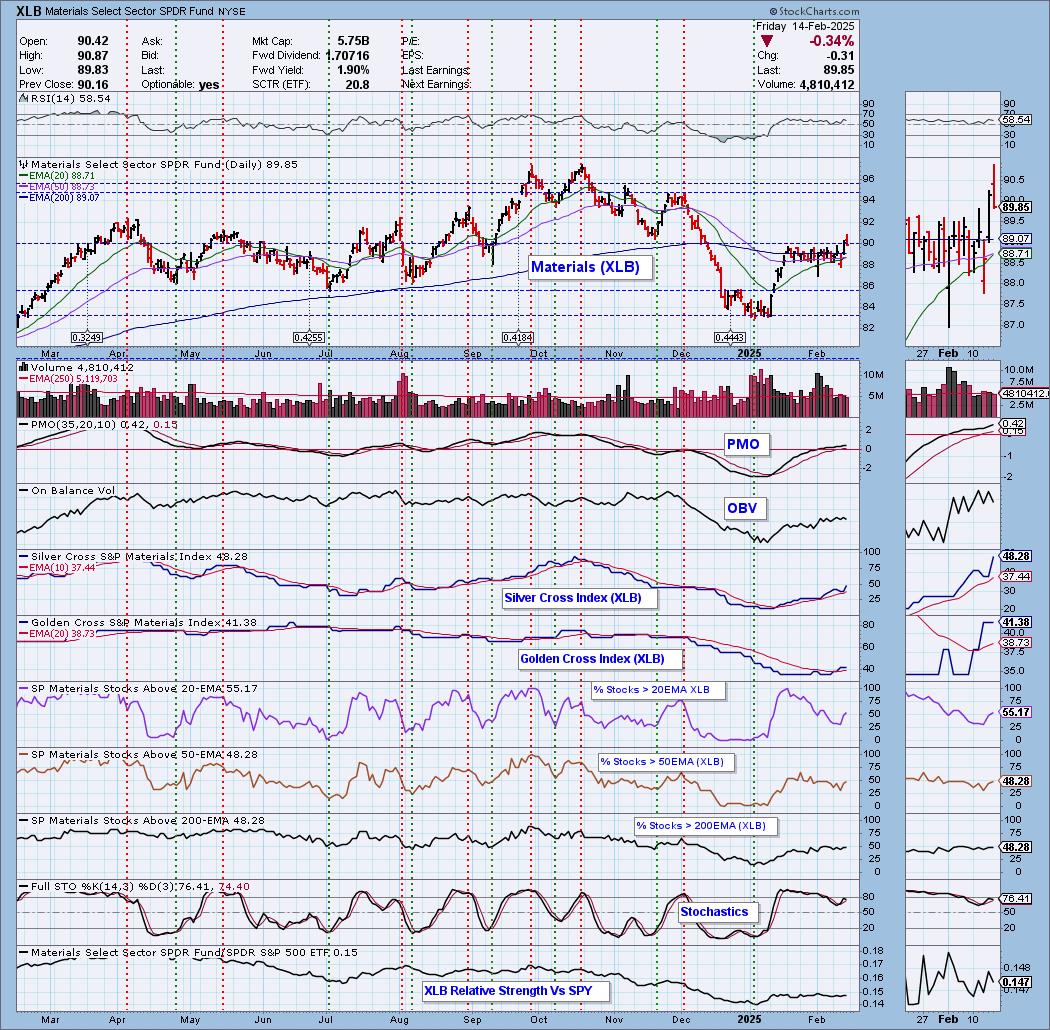
The Sector to Watch is Materials (XLB). I could've picked XLRE or XLU which both look healthy too. But on XLB, I like the recent breakout. We'll look under the hood below. The Industry Group to Watch is Nonferrous Metals which is really starting to rally. It had a bad day, but the future does look bright. Stocks to watch in this group are: SILV, MAG, WPM and SVM. I really liked the SVM chart.
I ran a handful of scans at the end of the trading room and was able to find some stocks to put on your watch list for next week: LQDT, APA, WSO and WYNN.
There will be no Monday trading room next week due to the Presidents' Day holiday.
Have a wonderful three day weekend!
Good Luck & Good Trading,
Erin

Diamond Mine Trading Room:
RECORDING & DOWNLOAD LINK (2/14/2025):
Topic: DecisionPoint Diamond Mine (2/14/2025) LIVE Trading Room
Download & Recording Link
Passcode: February#14
REGISTRATION for 2/21/2025:
When: February 21, 2025 09:00 AM Pacific Time (US and Canada)
Topic: DecisionPoint Diamond Mine LIVE Trading Room
Register in advance for this webinar HERE
After registering, you will receive a confirmation email containing information about joining the webinar.

Below is the latest free DecisionPoint Trading Room recording from 2/10. You'll find these recordings posted on Mondays to our DP YouTube Channel. Be sure and subscribe HERE.
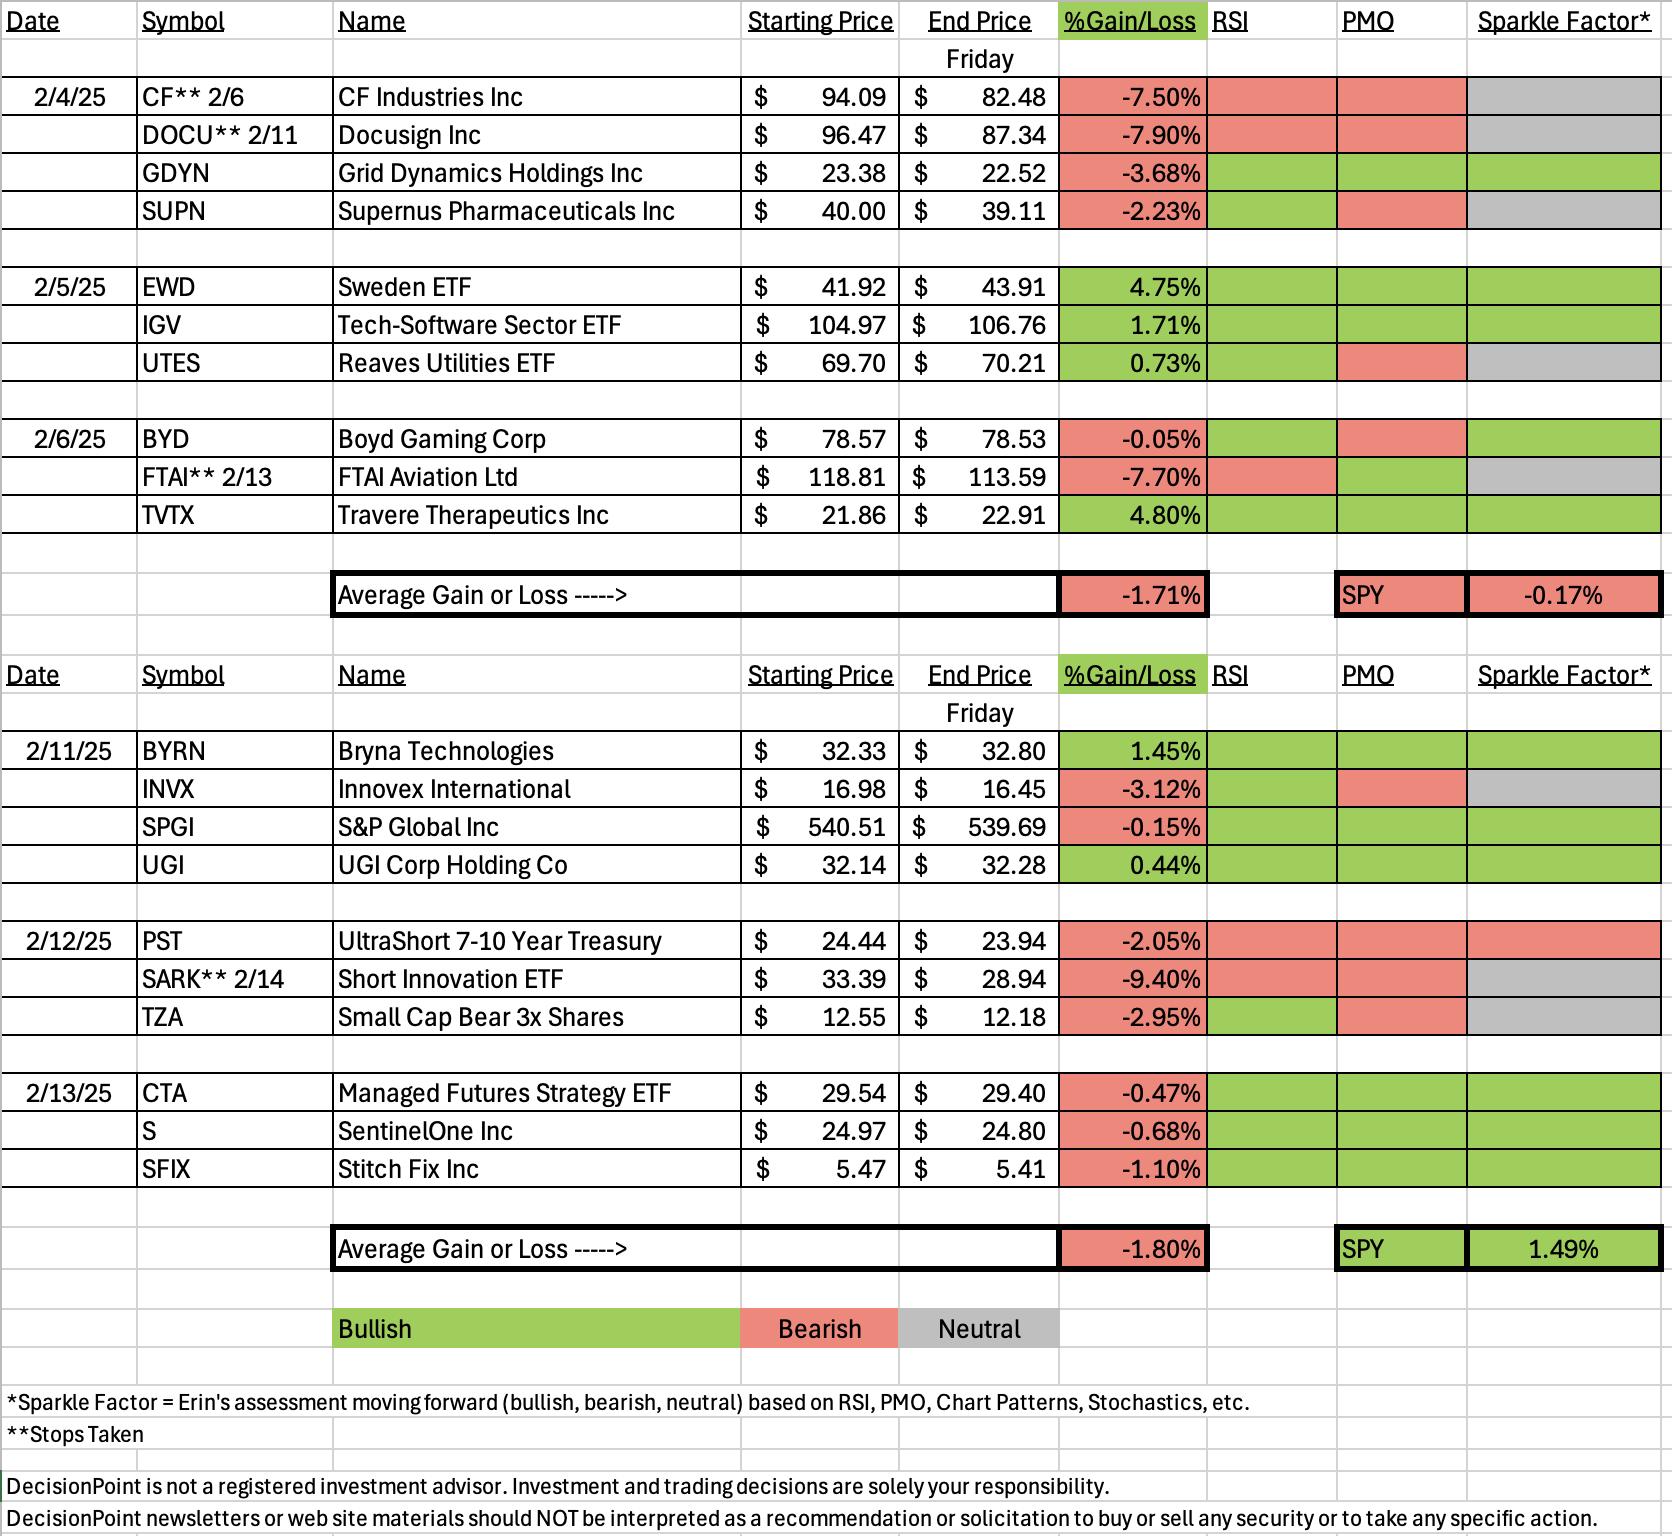
A few items about the spreadsheet: I've put on the spreadsheet whether the RSI is positive (green) or negative (red). The PMO column tells you if it is rising (green) or falling (red). Finally I've added my own "Sparkle Factor" that gives you my assessment going forward, bullish (green), bearish (red) or neutral (gray). The Sparkle Factor is basically my thoughts on whether I expect it to rise or fall. A neutral means it could really go either way so it could be added to a watch list. If you're in a stock I consider "neutral" going forward, the ball is in your court.
Darling:
Byrna Technologies Inc (BYRN)
EARNINGS: 2025-04-03 (BMO)
Byrna Technologies, Inc. is a less-lethal self-defense technology company, which engages in the business of developing, manufacturing, and selling innovative less-lethal personal security solutions. It operates through the following geographical segments: the United States, South Africa, Europe, South America, and Asia, and Canada. The company was founded on March 1, 2005 and is headquartered in Andover, MA.
Predefined Scans Triggered: Bearish Harami, P&F Triple Top Breakout and P&F Double Top Breakout.
Below are the commentary and chart from Tuesday, 2/11:
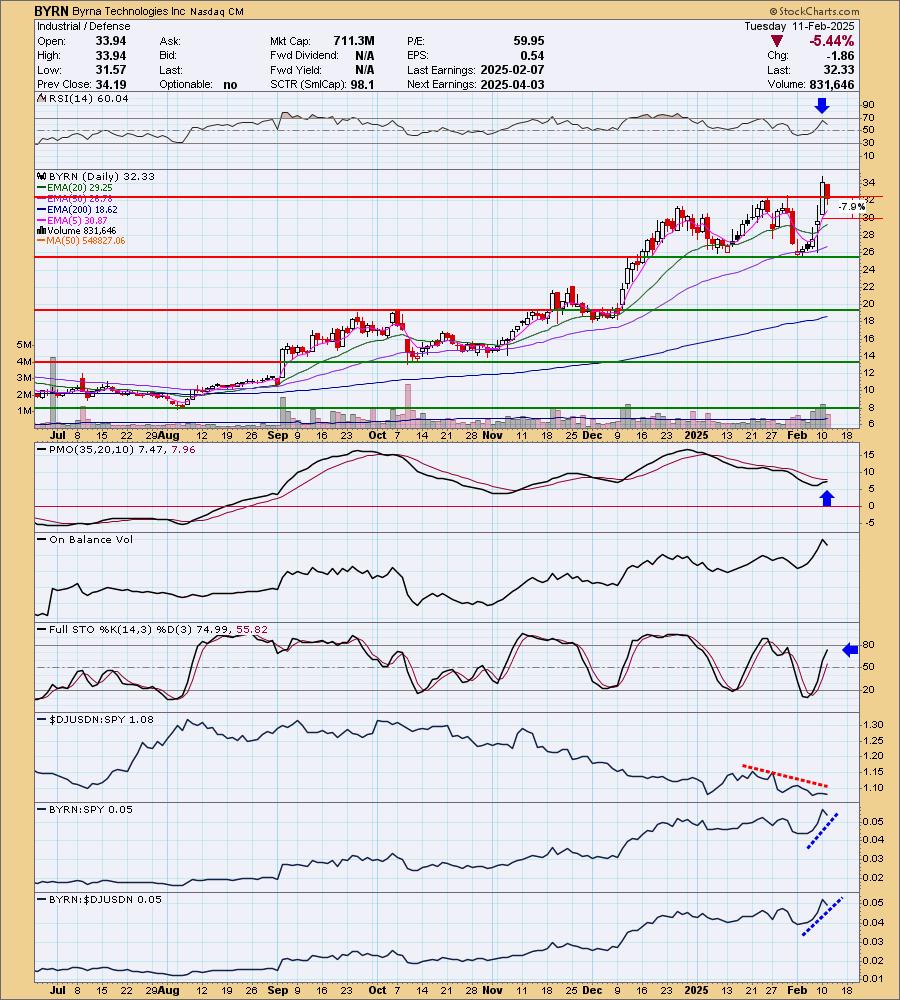
"BYRN is unchanged in after hours trading. This one came from the Diamond PMO Scan when I opened up the universe I was scanning. It had a terrible day, but I like the breakout followed by this snapback to support. It did well with earnings so we should see some upside here. The RSI is not overbought. The PMO is still rising toward a Crossover BUY Signal. Stochastics are rising. The group isn't performing very well, but BYRN is outperforming the group and the SPY. I've set the stop as close to the 20-day EMA as possible at 7.9% or $29.77."
Here is today's chart:
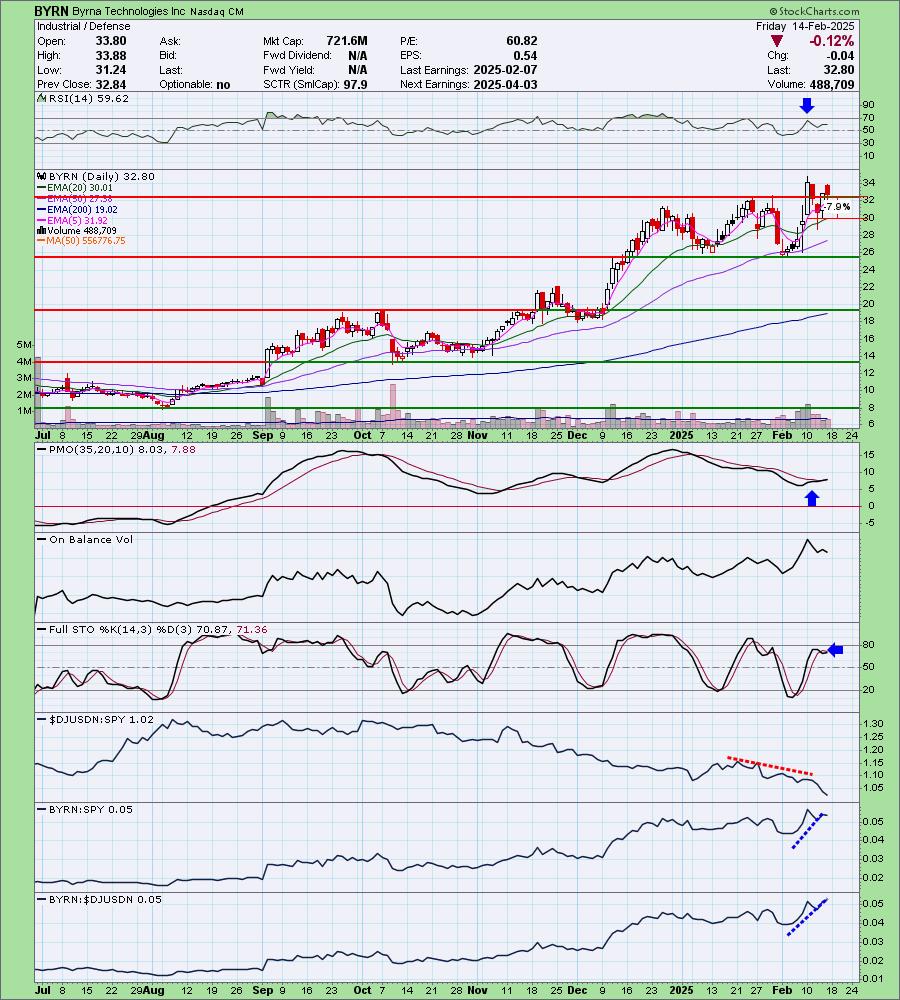
We have some jagged trading that could indicate a near-term top, but the indicators are still going in the right direction suggesting we should see BYRN continue higher. The group is still underperforming, but there is still some outperformance for BYRN against the group and the SPY. Stochastics have turned up alongside a new PMO Crossover BUY Signal so we should see some upside here.
Don't forget, on Thursdays I look at reader-requested symbols, so shoot me an email at erin@decisionpoint.com. I read every email I receive and try to answer them all!
Dud:
Tradr 2X Short Innovation Daily ETF (SARK)
EARNINGS: N/A
SARK is an actively managed fund that seeks to achieve -2x the return, for a single day, of the ARK Innovation ETF (ARKK) through swap agreements with major global financial institutions. Click HERE for more information.
Predefined Scans Triggered: Bearish Engulfing and Elder Bar Turned Red.
Below are the commentary and chart from Wednesday, 2/12:
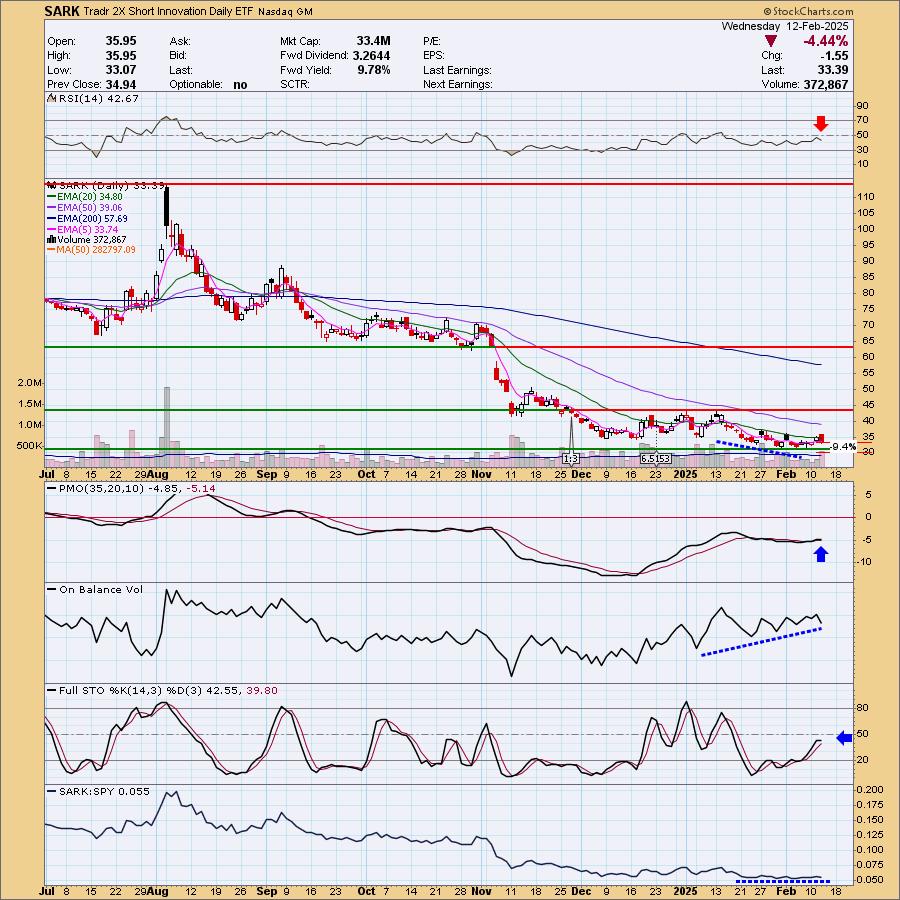
"SARK is down -0.12% in after hours trading. The price pattern isn't that positive right now, but remember, this is a hedge in case the market takes a turn for the worse. Price is trying to form a cup shaped bottom. The RSI is unfortunately negative below net neutral (50), but the PMO is still rising despite today's big decline. There is a positive OBV divergence. Stochastics have stagnated, but are still technically rising. Given this is leveraged, I'm going with a deep stop at 9.4% or $30.25."
Here is today's chart:
I went in with this hedge thinking we'd see some decline out of the Tech sector, primarily some of these disruptive technologies that ARKK covers. Instead we saw a nice rally on Thursday and today which put this hedge in the tank. I still like it as a hedge choice so I'd keep on your lists for future reference. I'm still not liking internals of the market and this hedge should work well if the market reverses in a serious way. Right now the market could inch higher thanks to cap-weighting.
THIS WEEK's Performance:
DecisionPoint Market Scoreboard (Mechanical Trend Model Signals):
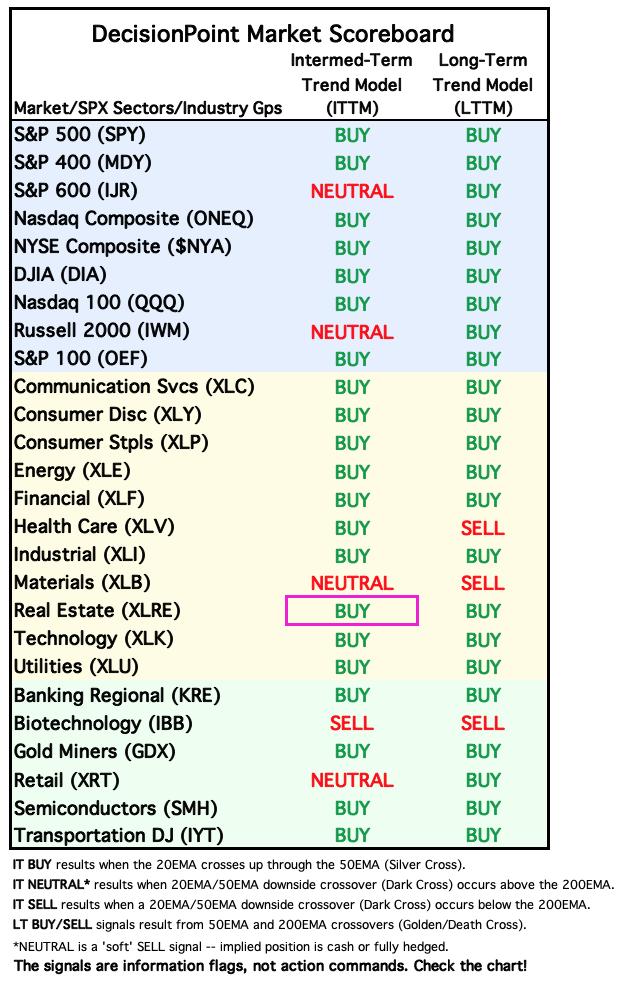
Friday signal changes are outlined in purple.
Click Here to view Carl's annotated "Under the Hood" ChartList!
Sector to Watch: Materials (XLB)
I liked the chart much better this morning when it was trading on the positive side, but technically we did see a breakout yesterday and this is a pullback toward the breakout point. That mechanical setup often leads to some upside. The RSI is positive and the PMO has surged (bottomed) above the signal line which is especially bullish. Stochastics unfortunately turned down, but the Silver Cross Index is above its signal line and rising for an IT BULLISH Bias. The Golden Cross Index is above its signal line so the LT Bias is also BULLISH. We are seeing some nice gains on participation, particularly on %Stocks > 20EMA which has broken its declining trend.
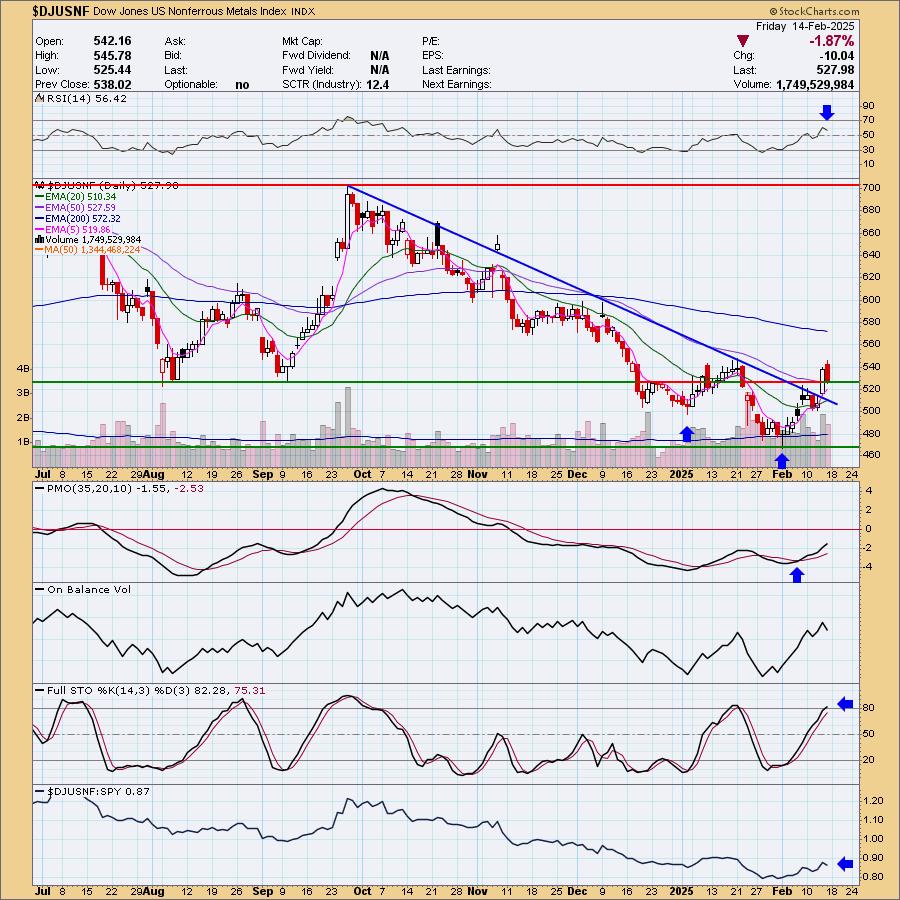
Industry Group to Watch: Nonferrous Metals ($DJUSNF)
I like this rally that broke the longer-term declining trend. We have a possible double bottom. It isn't textbook as the lows are totally even, but I think this is a bottoming formation nonetheless. Price has also broken above resistance and despite today's loss, it remains above this new support level. The RSI is positive and the PMO is rising on a Crossover BUY Signal showing new strength. Stochastics are now above 80 and we can see the group is now outperforming the market.
Go to our Under the Hood ChartList on DecisionPoint.com to get an in-depth view of all the sectors. On StockCharts.com you can find the Industry Summary.
Good Luck & Good Trading!
- Erin
erin@decisionpoint.com
Full Disclosure: I'm 15% long, 0% short.
Watch the latest episode of the DecisionPoint Trading Room with Carl & Erin Swenlin HERE!
Technical Analysis is a windsock, not a crystal ball. --Carl Swenlin
NOTE: The stocks reported herein are from mechanical trading model scans that are based upon moving average relationships, momentum and volume. DecisionPoint analysis is then applied to get selections from the scans. The selections given should prompt readers to do a chart review using their own analysis process. This letter is not a call for a specific action to buy, sell or short any of the stocks provided. There are NO sure things or guaranteed returns on the selection of "diamonds in the rough."
Helpful DecisionPoint Links:
DecisionPoint Shared ChartList and DecisionPoint Chart Gallery
Price Momentum Oscillator (PMO)
Swenlin Trading Oscillators (STO-B and STO-V)
(c) Copyright 2025 DecisionPoint.com