
I'm pleased to report that we had plenty of Reader Requests to look at today. It was a tough decision and I apologize to anyone who didn't get there symbol in the report. I will say that nearly every request with the exception of one or two which had falling PMOs, had merit. I recommend that you take a look at these requests if you have time. Readers, you did very well today.
One that I almost included was a Pipeline stock, MPLX. The chart looks great in every way, but it is in the Energy sector and I just don't like that area of the market right now. Pipelines will not always travel with Crude Oil. Crude has been down for some time and yet MPLX has been rallying. Certainly worth looking at.
One of today's selections has a great daily chart, but a pretty ugly weekly chart. I almost took it off the list for that reason, but ultimately our picks in Diamonds are short-term so I decided that with such a nice daily chart, it was worth presenting.
Tomorrow is the Diamond Mine trading room! Be sure to register! We would love to expand the room past the regulars. We're a welcoming group and you are sure to enjoy yourself so give it a try. You can always download the replay if you can't make it.
Good Luck & Good Trading,
Erin
Today's "Diamonds in the Rough": ACN, MUSA and TEM.
Other requests: PSO, WAB, SONY, PPA, DECK, ANET, FLUT, CLS, VRT and MPLX.

Diamond Mine Trading Room:
RECORDING & DOWNLOAD LINK (1/24/2025):
Topic: DecisionPoint Diamond Mine (1/24/2025) LIVE Trading Room
Download & Recording Link HERE
Passcode: January#24
REGISTRATION for 1/31/2025:
When: January 31, 2025 09:00 AM Pacific Time (US and Canada)
Topic: DecisionPoint Diamond Mine LIVE Trading Room
Register in advance for this webinar HERE
After registering, you will receive a confirmation email containing information about joining the webinar.

Below is the latest free DecisionPoint Trading Room recording from 1/27. You'll find these recordings posted on Mondays to our DP YouTube Channel. Be sure and subscribe HERE.
Welcome to DecisionPoint Diamonds, wherein I highlight ten "Diamonds in the Rough" per week. These are selected from the results of my DecisionPoint Scans which search for stocks that could benefit from the trend and condition of the market. Remember, these are not recommendations to buy or sell, but are the most interesting of the stocks that surfaced in my scans. My objective is to save you the work of the initial, tedious culling process, but you need to apply your own analysis to see if these stocks pique your interest as well. There are no guaranteed winners here!
"Predefined Scans Triggered" are taken from StockCharts.com using the "Symbol Summary" option instead of a "SharpChart" on the workbench.
Stop levels are all rounded down.
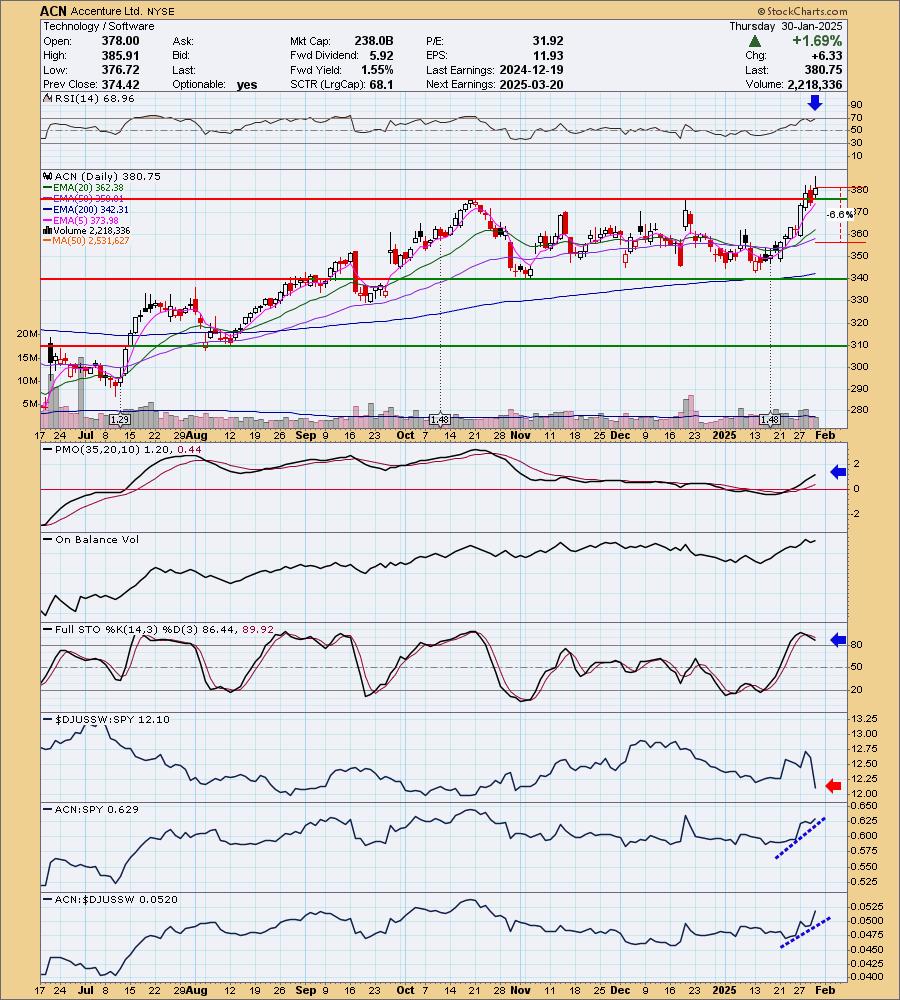
Accenture Ltd. (ACN)
EARNINGS: 2025-03-20 (BMO)
Accenture is a global professional services company that helps the world's businesses, governments and other organizations build their digital core, optimize their operations, accelerate revenue growth and enhance citizen services, creating tangible value at speed and scale. The firm combines technology and leadership in cloud, data and AI with industry experience, functional expertise and global delivery capability. Its services include Strategy & Consulting, Technology, Operations, Industry X, and Song. It operates through the following geographical segments: North America, EMEA, and Growth Markets. The company was founded in 1951 and is headquartered in Dublin, Ireland.
Predefined Scans Triggered: Moved Above Upper Bollinger Band, P&F Double Top Breakout, Moved Above Upper Keltner Channel, New 52-week Highs, P&F Bear Trap and Ichimoku Cloud Turned Green.
ACN is up +0.02% in after hours trading. This one caught my eye as we have a breakout from a period of accumulation or a trading range. The RSI is not quite overbought yet. The PMO is showing pure strength on its strong move above the zero line. I'm not happy that Stochastics have turned over, but they are above 80 so it is fine for now. The Software group is really underperforming right now so we definitely want a stock showing leadership within the group. ACN is showing that leadership with a rising relative strength line to both the group and the SPY. The stop is set beneath the 50-day EMA at 6.6% or $355.62.
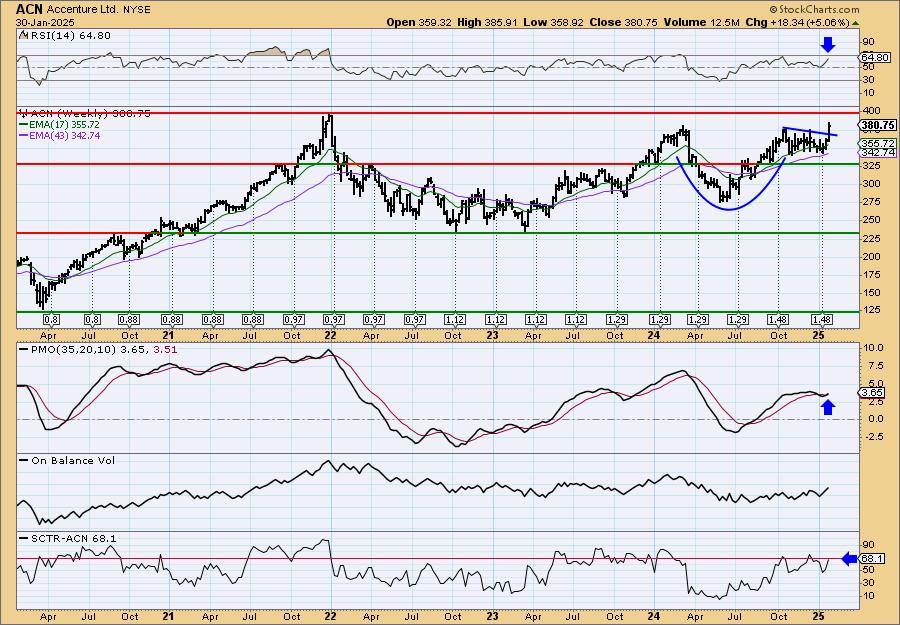
The weekly chart is encouraging as we see a bullish cup with handle pattern. Price is breaking out of the pattern, confirming it. The weekly RSI is positive and not overbought. The weekly PMO just had a Crossover BUY Signal. The StockCharts Technical Rank (SCTR) is not yet in the hot zone* but it is close enough. Consider a 17% upside target to about $445.48.
*If a stock is in the "hot zone" above 70, it implies that it is stronger than 70% of its universe (large-, mid-, small-caps and ETFs) primarily in the intermediate to long terms.
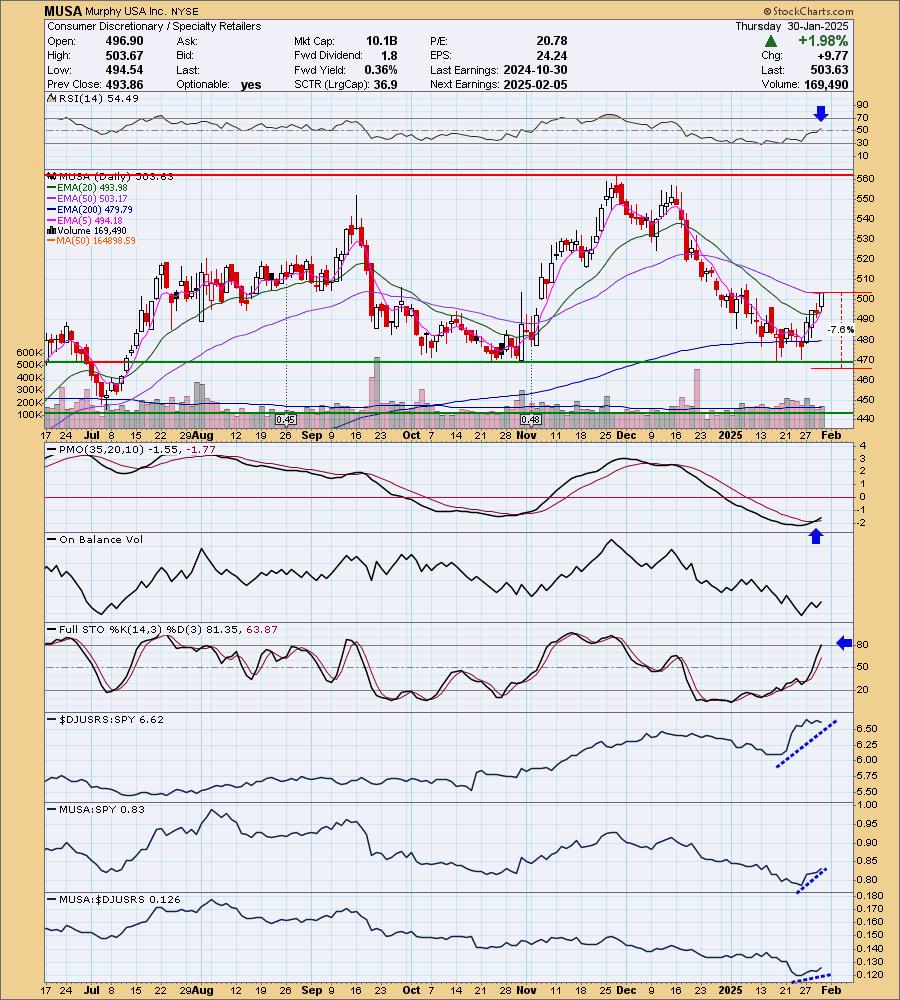
Murphy USA Inc. (MUSA)
EARNINGS: 2025-02-05 (AMC)
Murphy USA, Inc. engages in marketing motor fuel products and convenience merchandise through retail stores, namely Murphy USA and Murphy Express. It collaborates with Walmart to offer customers discounted and free items based on purchases of qualifying fuel and merchandise. It operates through the Marketing, and Corporate and Other Assets segments. The company was founded in 1996 and is headquartered in El Dorado, AR.
Predefined Scans Triggered: New CCI Buy Signals and P&F Double Top Breakout.
MUSA is up +0.07% in after hours trading. This looks like a solid rally off strong support. Price closed above the 50-day EMA and I noticed that the 5-day EMA has crossed above the 20-day EMA for a ST Trend Model BUY Signal. The RSI has just moved into positive territory. The PMO is on a new Crossover BUY Signal in oversold territory. I like that Stochastics have just moved above 80. Relative strength for the group is good and we can see that MUSA is outperforming the group and the SPY. The stop is set beneath support at 7.6% or $465.35.
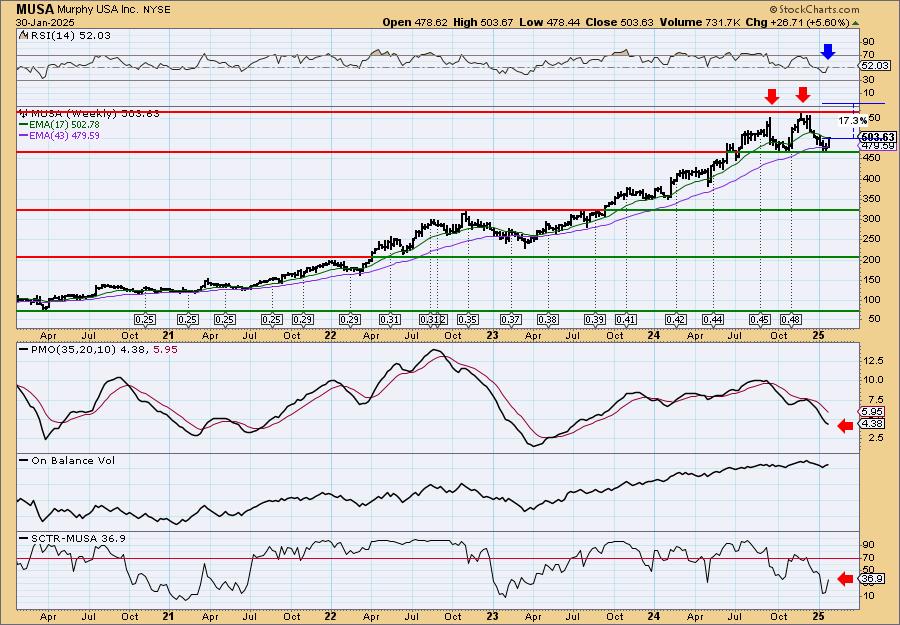
It is not a great weekly chart. Certainly this bounce is coming off strong support, but it is still part of a bearish double top pattern. The weekly RSI did just enter positive territory so it is going the right way. The SCTR is not in the hot zone, but it is rising. The weekly PMO looks terrible given the recent decline. It will need much more upside to reverse. Consider a 17% upside target to about $589.25.
Tempus AI Inc. (TEM)
EARNINGS: None Listed.
Tempus AI, Inc. is a healthcare technology company, which engages in bringing artificial intelligence and machine learning to healthcare. It focuses on building platforms for oncology, neuropsychiatry, cardiology, infectious disease, and radiology. The company was founded by Eric Paul Lefkofsky in August 2015 and is headquartered in Chicago, IL.
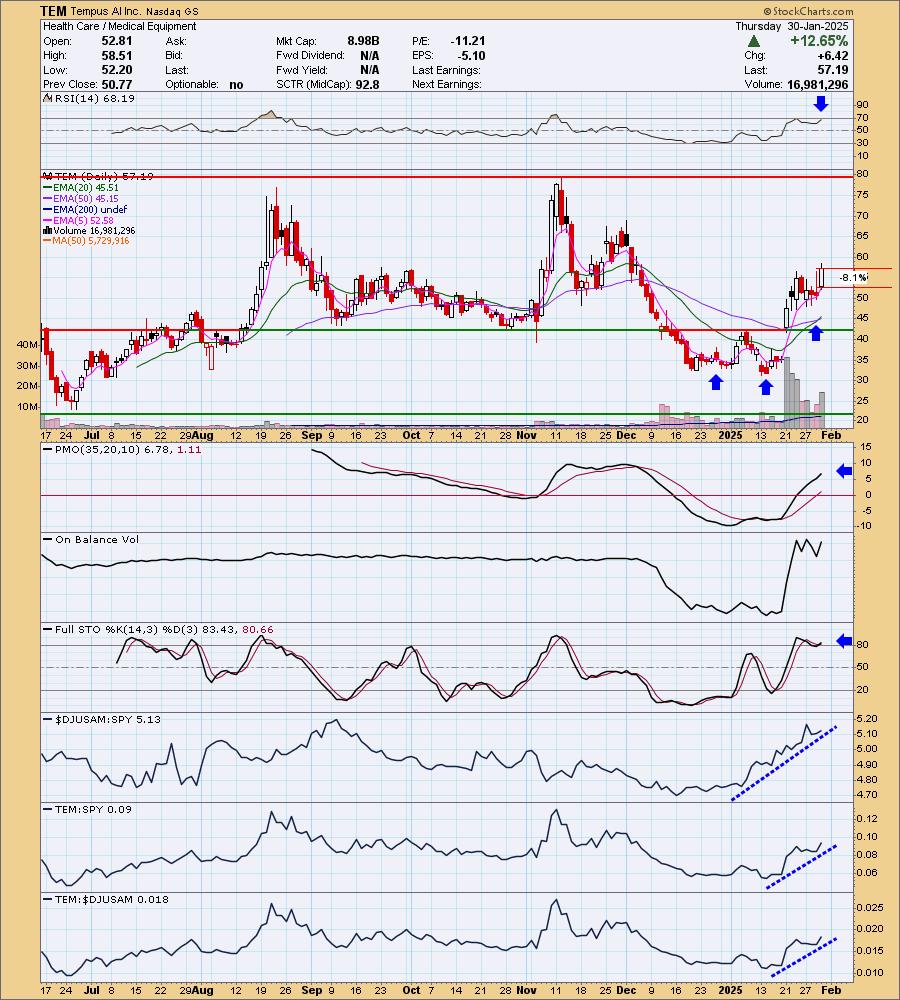
Predefined Scans Triggered: Moved Above Ichimoku Cloud, Elder Bar Turned Green, Moved Above Upper Price Channel, P&F Ascending Triple Top Breakout, P&F Double Top Breakout and Moved Above Upper Keltner Channel.
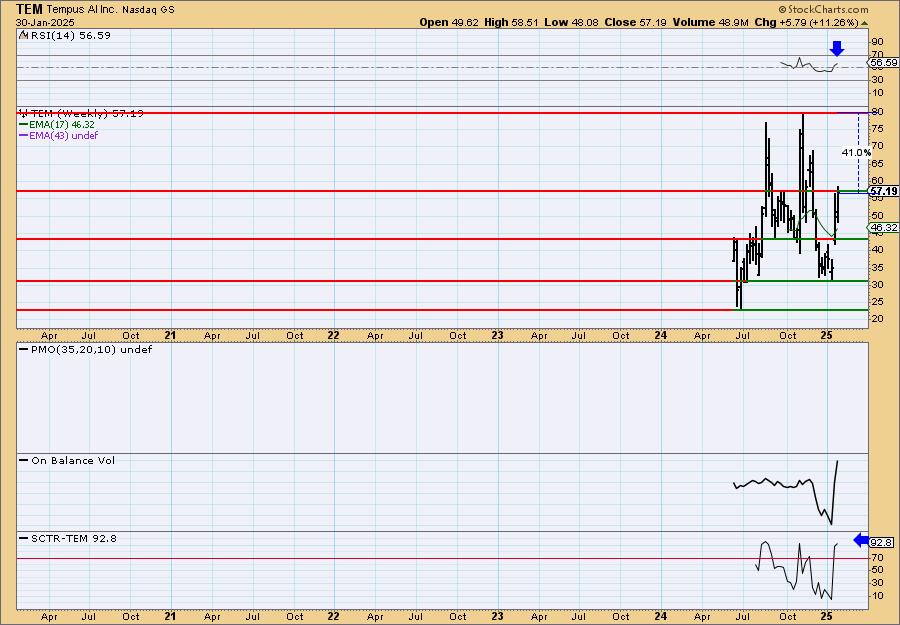
TEM is up +1.15% in after hours trading. This one interested me as it combine health care and AI. It is a somewhat new issue. The other reason I liked it was the crazy upside potential that you'll see on the weekly chart. Price is coming out of a bullish double bottom pattern. The RSI is not yet overbought. There is a new Silver Cross BUY Signal as the 20-day EMA crossed above the 50-day EMA. The PMO is rising very strongly and is well above the zero line. Volume has definitely come in as interest rises in this unique stock. The industry group is doing very well and we can see that TEM is outperforming the group by a lot and consequently is outperforming the SPY. The stop was hard to set due to today's big move higher. I set it a bit deep at 8.1% or $52.55.
There isn't much to look at on the weekly chart as it is a rather new issue. We do see the OBV shooting skyward on a good volume. It appears that price is ready to rebound back to the top of the wide trading range. The SCTR is at the top of the hot zone. It'll be interesting to see how high this one will go. Might be a bit volatile along the way based on today's big swing.
Don't forget, on Thursdays I look at reader-requested symbols, click HERE to send me an email. I read every email I receive and try to answer them all!
Current Market Outlook:
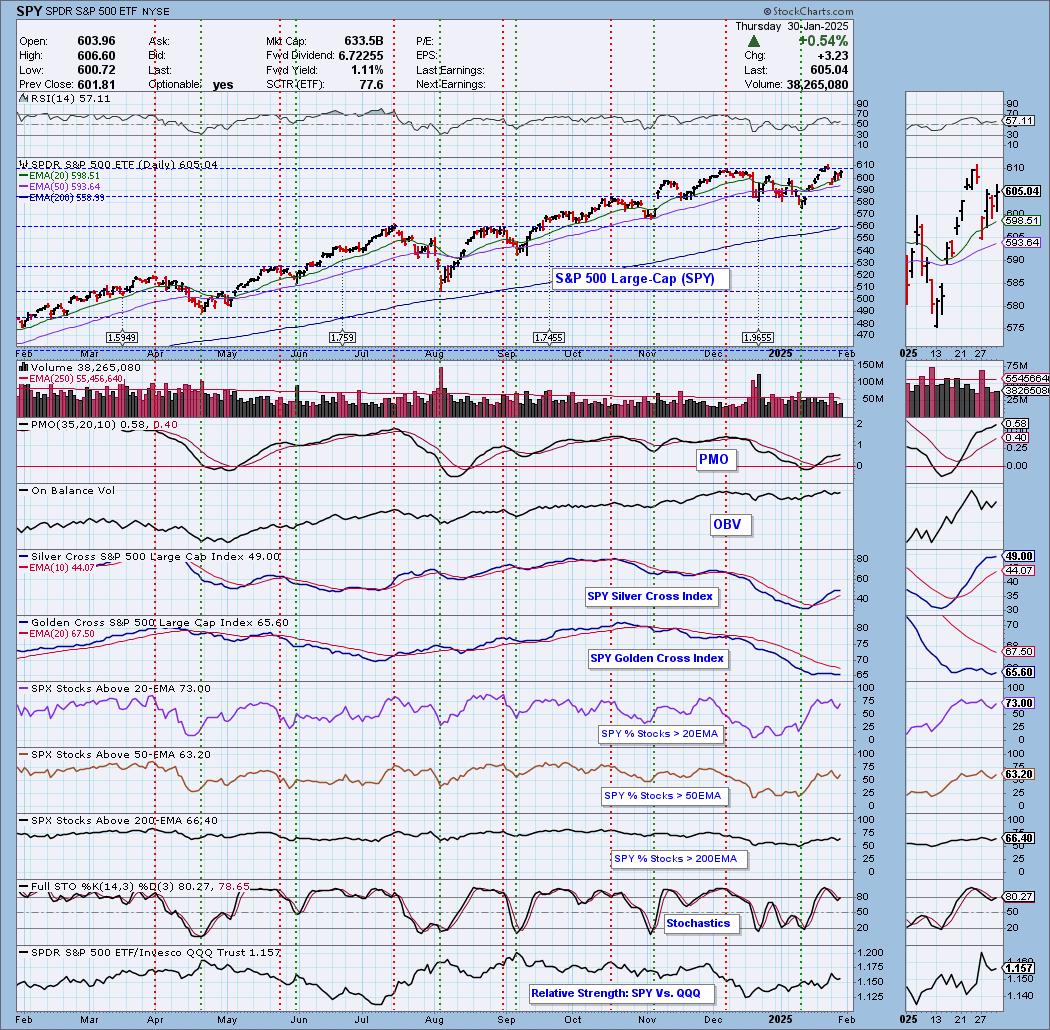
Market Environment: It is important to consider the odds for success by assessing the market tides. The following chart uses different methodologies for objectively showing the depth and trend of participation for intermediate- and long-term time frames.
- The Silver Cross Index (SCI) shows the percentage of SPX stocks on IT Trend Model BUY signals (20-EMA > 50-EMA)
- The Golden Cross Index (GCI) shows the percentage of SPX stocks on LT Trend Model BUY signals (50-EMA > 200-EMA)
Don't forget that as a "Diamonds" member, you have access to our "Under the Hood" curated ChartList on DecisionPoint.com. You'll find it under "Members Only" links on the left side on the Blogs and Links Page.
Here is the current chart:
Full Disclosure: I am 50% long, 0% short.
I'm required to disclose if I currently own a stock I mention and/or may buy/short it within the next 72 hours.
"Technical Analysis is a windsock, not a crystal ball." - Carl Swenlin
(c) Copyright 2025 DecisionPoint.com
Watch the latest episode of DecisionPoint Trading Room with Carl & Erin Swenlin Mondays on the DecisionPoint YouTube channel here!
NOTE: The stocks reported herein are from mechanical trading model scans that are based upon moving average relationships, momentum and volume. DecisionPoint analysis is then applied to get five selections from the scans. The selections given should prompt readers to do a chart review using their own analysis process. This letter is not a call for a specific action to buy, sell or short any of the stocks provided. There are NO sure things or guaranteed returns on the daily selection of "Diamonds in the Rough."
Regarding BUY/SELL Signals: The signal status reported herein is based upon mechanical trading model signals and crossovers. They define the implied bias of the price index/stock based upon moving average relationships and momentum, but they do not necessarily call for a specific action. They are information flags that should prompt chart review. Further, they do not call for continuous buying or selling during the life of the signal. For example, a BUY signal will probably (but not necessarily) return the best results if action is taken soon after the signal is generated. Additional opportunities for buying may be found as price zigzags higher, but the trader must look for optimum entry points. Conversely, exit points to preserve gains (or minimize losses) may be evident before the model mechanically closes the signal.
Helpful DecisionPoint Links:
Price Momentum Oscillator (PMO)
Swenlin Trading Oscillators (STO-B and STO-V)
For more links, go to DecisionPoint.com