
The scans were dry today, bringing in only a handful of ETFs, most of which I wasn't a fan of. There was the appearance of Magnificent Seven ETFs and a few Vanguard funds for the market as a whole, but I'm not convinced the market will be moving much higher and with earnings coming out on many of the Mag 7 stocks, I didn't want to get involved with those ETFs as volatility could be a problem.
I'm bearish on Energy as a whole, but particularly Crude Oil and now Nat Gas. I found two leveraged bear ETFs that will take advantage. With production likely to increase under the new administration, prices should move lower.
The third ETF has a nice set up but I am not thoroughly convinced it will get too much higher. It is a Web ETF that should see action if the Communications Services sector and Technology sector stay elevated. I'm less confident about this selection, but if you're a bull on the market, it is a great candidate.
Tomorrow is Reader Request Day! Don't forget to send in your symbols tonight or tomorrow morning for possible inclusion in tomorrow's report. There are certainly choices out there among stocks so I am interested in where your interest currently lies.
Good Luck & Good Trading,
Erin
Today's "Diamonds in the Rough": ARKW, DRIP and KOLD.

Diamond Mine Trading Room:
RECORDING & DOWNLOAD LINK (1/24/2025):
Topic: DecisionPoint Diamond Mine (1/24/2025) LIVE Trading Room
Download & Recording Link HERE
Passcode: January#24
REGISTRATION for 1/31/2025:
When: January 31, 2025 09:00 AM Pacific Time (US and Canada)
Topic: DecisionPoint Diamond Mine LIVE Trading Room
Register in advance for this webinar HERE
After registering, you will receive a confirmation email containing information about joining the webinar.

Below is the latest free DecisionPoint Trading Room recording from 1/27. You'll find these recordings posted on Mondays to our DP YouTube Channel. Be sure and subscribe HERE.
Welcome to DecisionPoint Diamonds, wherein I highlight ten "Diamonds in the Rough" per week. These are selected from the results of my DecisionPoint Scans which search for stocks that could benefit from the trend and condition of the market. Remember, these are not recommendations to buy or sell, but are the most interesting of the stocks that surfaced in my scans. My objective is to save you the work of the initial, tedious culling process, but you need to apply your own analysis to see if these stocks pique your interest as well. There are no guaranteed winners here!
"Predefined Scans Triggered" are taken from StockCharts.com using the "Symbol Summary" option instead of a "SharpChart" on the workbench.
Stop levels are all rounded down.
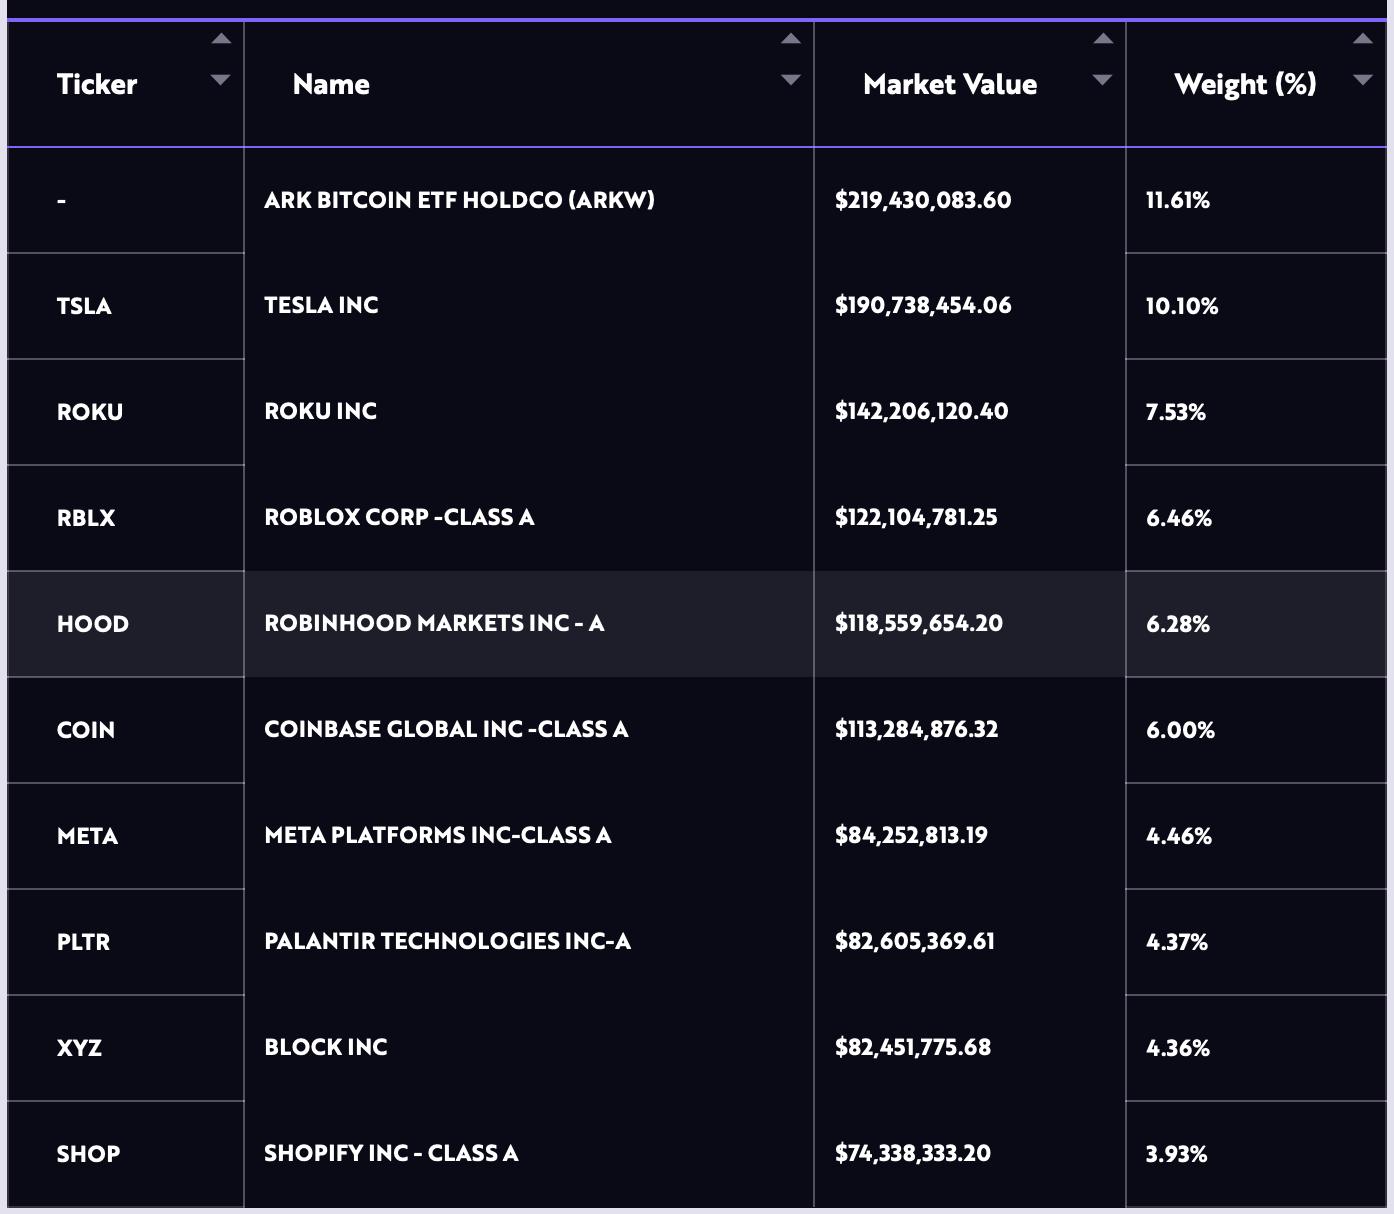
ARK Web x.0 ETF (ARKW)
EARNINGS: N/A
ARKW is an actively managed fund with a broad mandate to invest in companies its managers have identified as benefiting from an infrastructure shift away from hardware and software toward cloud and mobile. Click HERE for more information.
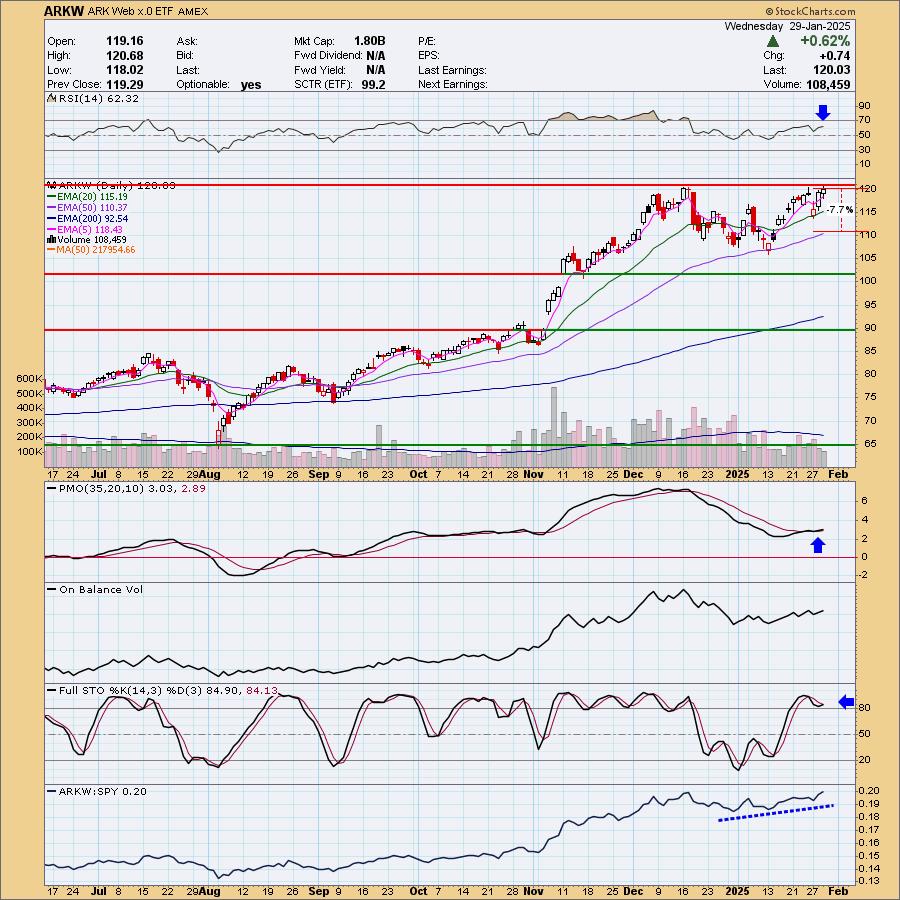
Predefined Scans Triggered: New 52-week Highs.
ARKW is unchanged in after hours trading. I would've preferred a breakout here, but we do have new 52-week highs. The indicators are lined up well which is the reason I'm including this one even though I'm not completely on board with investing in aggressive groups right now. If the market is going to move higher, this one will too. It managed a good rally on a day when the market finished lower so we'll see. The RSI is positive and not overbought. The PMO is on a new Crossover BUY Signal and is rising above the zero line. I'd like to see more volume as the OBV isn't very close to a new high. Stochastics did turn up and we do see that the ETF is outperforming the market currently. The stop is set near the 50-day EMA at 7.7% or $110.78.
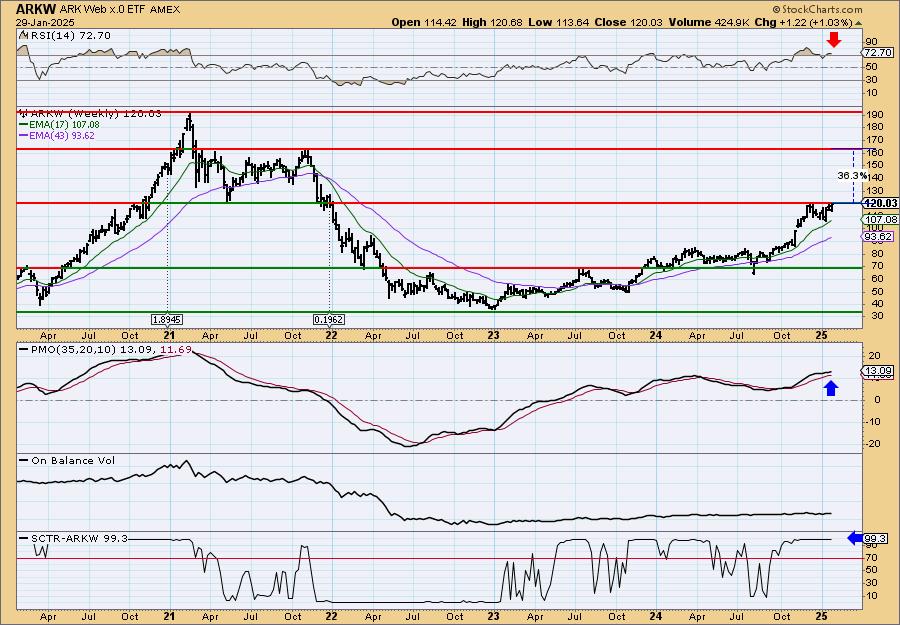
There is plenty of upside potential should we get the breakout here. It does look like a breakout from a bull flag formation that does suggest higher prices ahead. The weekly RSI is unfortunately overbought, but the weekly PMO is rising on a Crossover BUY Signal above the zero line. The StockCharts Technical Rank (SCTR) is incredibly strong at nearly the highest reading it can have in the hot zone* above 70.
*If a stock is in the "hot zone" above 70, it implies that it is stronger than 70% of its universe (large-, mid-, small-caps and ETFs) primarily in the intermediate to long terms.
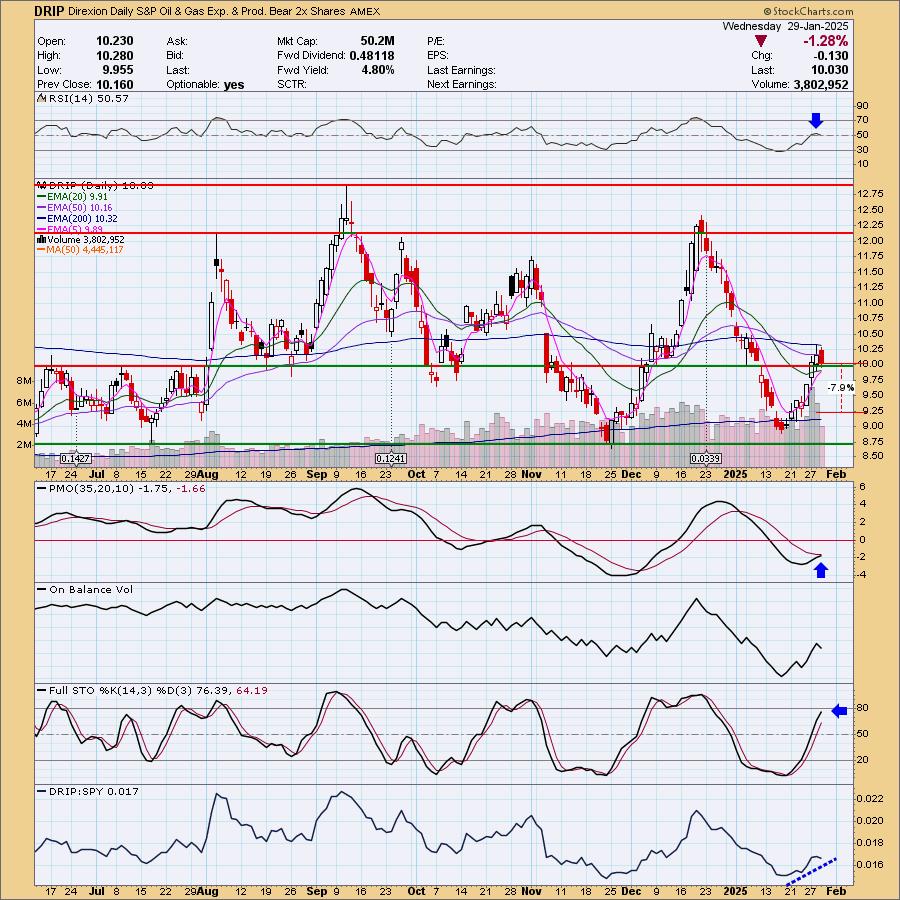
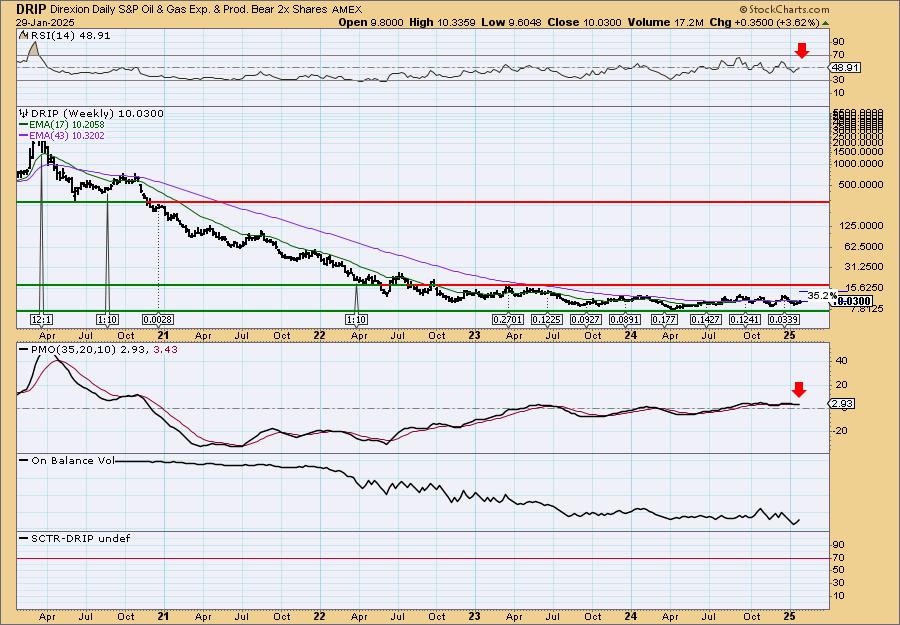
Direxion Daily S&P Oil & Gas Exp. & Prod. Bear 2x Shares (DRIP)
EARNINGS: N/A
DRIP provides 2x inverse daily exposure to an equal-weighted index of the largest oil and gas exploration and production companies in the US. Click HERE for more information.
Predefined Scans Triggered: None.
DRIP is up +0.48% in after hours trading. Price is coming off the bottom of a trading range and it sure looks like it is headed back up to the top of that range. The RSI is positive and far from being overbought. The PMO is nearing a Crossover BUY Signal. Stochastics are rising strongly. Not surprisingly, it is outperforming the SPY. I'm very bearish on Crude Oil and I think this will be a great way to play that bearish outlook. The stop needs to be deep given this is a leveraged ETF so I've set it at 7.9% or $9.23.
Upside potential is incredible if it can just get back to prior tops. The weekly RSI is negative, but it is rising now. The weekly PMO is in decline still.
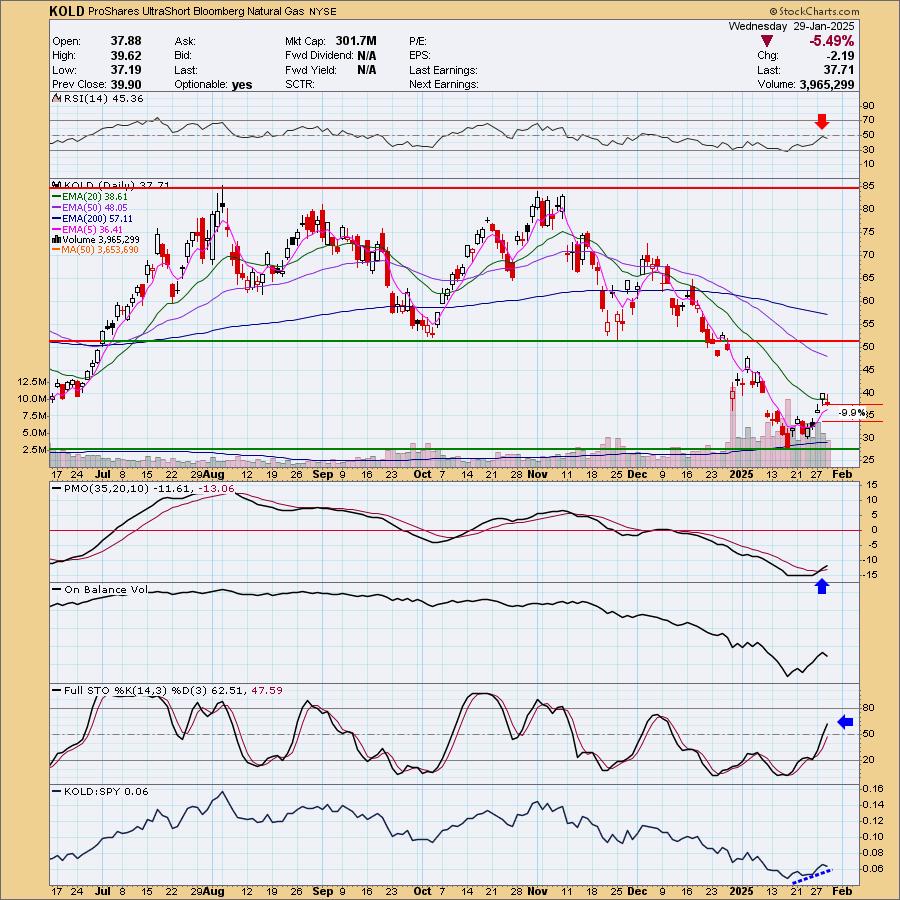
ProShares UltraShort Bloomberg Natural Gas (KOLD)
EARNINGS: N/A
KOLD provides daily -2x exposure to an index that tracks natural gas by holding one second month futures contract at a time. Click HERE for more information.
Predefined Scans Triggered: P&F Double Top Breakout.
KOLD is up +0.16% in after hours trading. Natural Gas had an excellent rally, but it does appear ready to come back down, at least to support. In the case of KOLD, we want it to get to overhead resistance. The RSI is not yet positive due to today's big loss, but the PMO does seem to suggest we will see prices move higher on KOLD. Stochastics are also very positive despite today's decline. The ETF has been outperforming the SPY of late and if Nat Gas really starts to decline, it will fare even better. The stop has to be set deeply (today's action is a good example as to why) so I've opted to set it at 9.9% or $33.97.
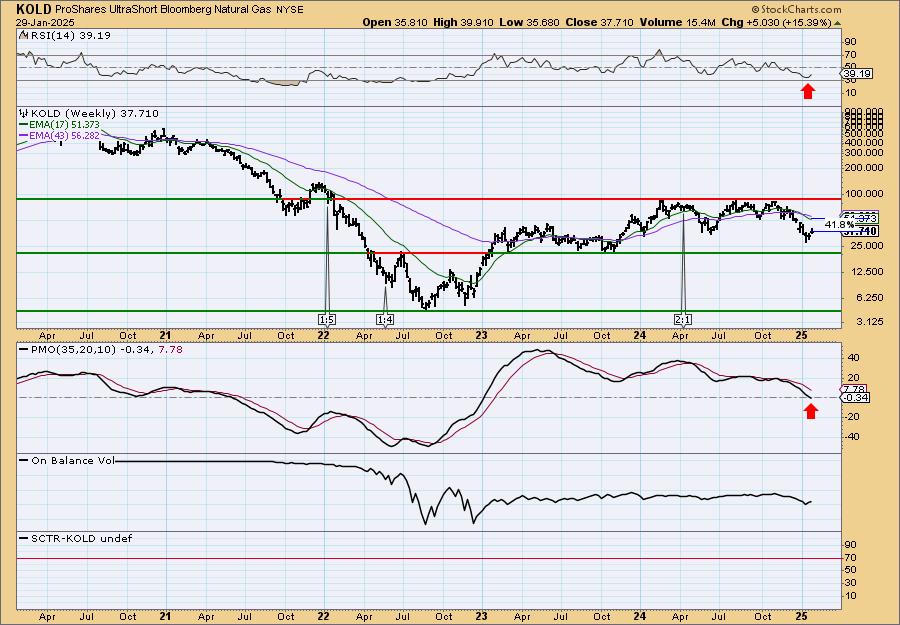
We can see that KOLD is range bound right now. It did turn up before having to test support this last time and appears ready to move higher from here. The weekly RSI is negative after the recent decline and the weekly PMO is also damaged and has moved below the zero line. These type of ETFs are very short-term holds so a great weekly chart is helpful but not required. A move to those prior lows would mean a big gain.
Don't forget, on Thursdays I look at reader-requested symbols, click HERE to send me an email. I read every email I receive and try to answer them all!
Current Market Outlook:
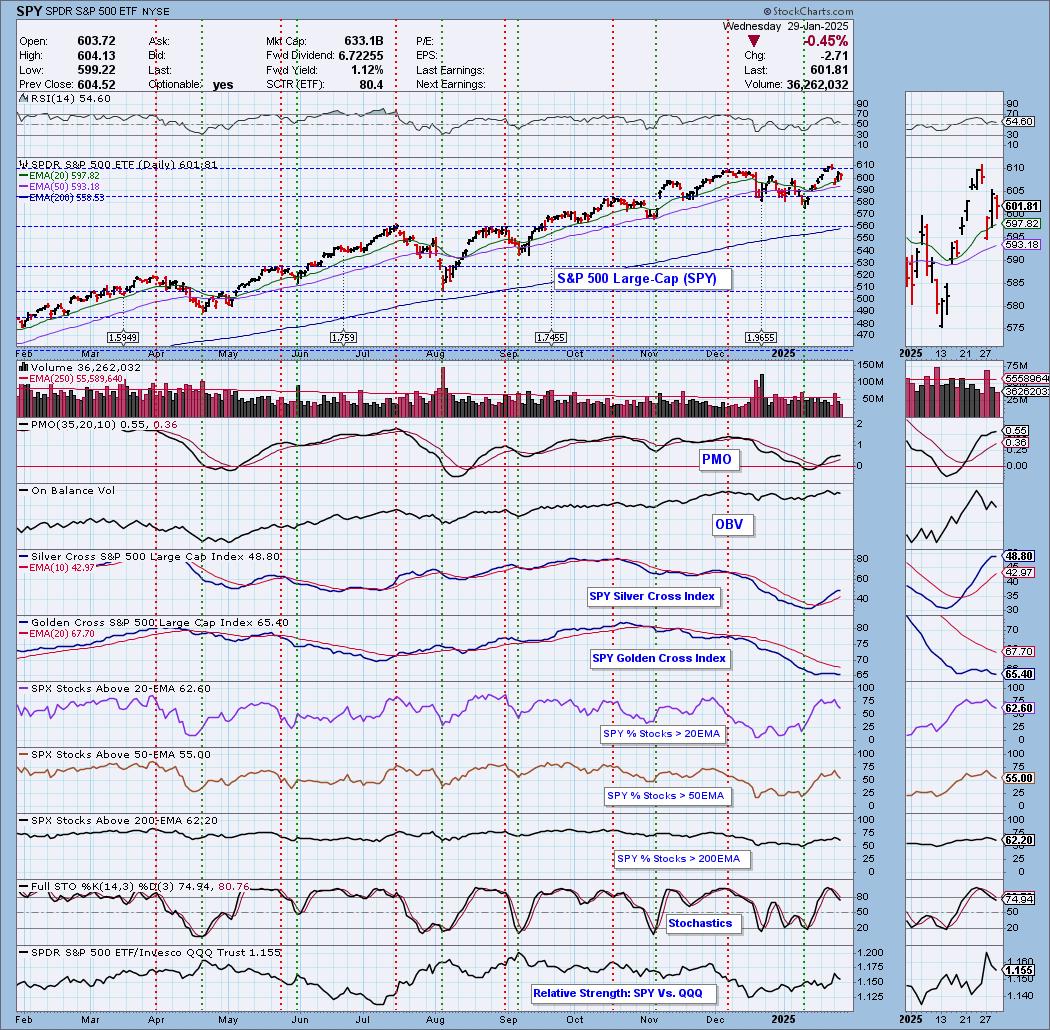
Market Environment: It is important to consider the odds for success by assessing the market tides. The following chart uses different methodologies for objectively showing the depth and trend of participation for intermediate- and long-term time frames.
- The Silver Cross Index (SCI) shows the percentage of SPX stocks on IT Trend Model BUY signals (20-EMA > 50-EMA)
- The Golden Cross Index (GCI) shows the percentage of SPX stocks on LT Trend Model BUY signals (50-EMA > 200-EMA)
Don't forget that as a "Diamonds" member, you have access to our "Under the Hood" curated ChartList on DecisionPoint.com. You'll find it under "Members Only" links on the left side on the Blogs and Links Page.
Here is the current chart:
Full Disclosure: I am 50% long, 0% short.
I'm required to disclose if I currently own a stock I mention and/or may buy/short it within the next 72 hours.
"Technical Analysis is a windsock, not a crystal ball." - Carl Swenlin
(c) Copyright 2025 DecisionPoint.com
Watch the latest episode of DecisionPoint Trading Room with Carl & Erin Swenlin Mondays on the DecisionPoint YouTube channel here!
NOTE: The stocks reported herein are from mechanical trading model scans that are based upon moving average relationships, momentum and volume. DecisionPoint analysis is then applied to get five selections from the scans. The selections given should prompt readers to do a chart review using their own analysis process. This letter is not a call for a specific action to buy, sell or short any of the stocks provided. There are NO sure things or guaranteed returns on the daily selection of "Diamonds in the Rough."
Regarding BUY/SELL Signals: The signal status reported herein is based upon mechanical trading model signals and crossovers. They define the implied bias of the price index/stock based upon moving average relationships and momentum, but they do not necessarily call for a specific action. They are information flags that should prompt chart review. Further, they do not call for continuous buying or selling during the life of the signal. For example, a BUY signal will probably (but not necessarily) return the best results if action is taken soon after the signal is generated. Additional opportunities for buying may be found as price zigzags higher, but the trader must look for optimum entry points. Conversely, exit points to preserve gains (or minimize losses) may be evident before the model mechanically closes the signal.
Helpful DecisionPoint Links:
Price Momentum Oscillator (PMO)
Swenlin Trading Oscillators (STO-B and STO-V)
For more links, go to DecisionPoint.com