
It is Reader Request Day but I only had one reader turn in symbols. They were LABU and BTU. I'm not a fan of BTU just yet, it's a little early and I suspect that the Energy sector will be pulling back after its long run higher. I did opt to present LABU, but just remember it is a "juiced" or leveraged ETF, 3x Bull for Biotechs. If you're not comfortable with the leveraged version, you can always use XBI or IBB.
I opted to run my original Diamond PMO Scan to fill in the blanks today. You can find the scan code in the first "Helpful Links" article. Rather than scanning on just the SP1500, Dow 65 and Nasdaq 100, I opened it up to all issues. It gave me some interesting results. I have runner-ups for you from that list.
Tomorrow is the Diamond Mine trading room! Don't forget to register below! Would love to see some new faces. Come try it out if you haven't already!
Good Luck & Good Trading,
Erin
Today's "Diamonds in the Rough": AXON, LABU and PTCT.
Runner-ups: BTU, RKLB, DECK, MIR, TEAM, PRLB and UPST.

Diamond Mine Trading Room:
RECORDING & DOWNLOAD LINK (1/17/2025):
Topic: DecisionPoint Diamond Mine (1/17/2025) LIVE Trading Room
Download & Recording Link
Passcode: January#17
REGISTRATION for 1/24/2025:
When: January 24, 2025 09:00 AM Pacific Time (US and Canada)
Topic: DecisionPoint Diamond Mine LIVE Trading Room
Register in advance for this webinar HERE
After registering, you will receive a confirmation email containing information about joining the webinar.

Below is the latest free DecisionPoint Trading Room recording from 1/6 (No recording 1/13 or 1/27). You'll find these recordings posted on Mondays to our DP YouTube Channel. Be sure and subscribe HERE.
Welcome to DecisionPoint Diamonds, wherein I highlight ten "Diamonds in the Rough" per week. These are selected from the results of my DecisionPoint Scans which search for stocks that could benefit from the trend and condition of the market. Remember, these are not recommendations to buy or sell, but are the most interesting of the stocks that surfaced in my scans. My objective is to save you the work of the initial, tedious culling process, but you need to apply your own analysis to see if these stocks pique your interest as well. There are no guaranteed winners here!
"Predefined Scans Triggered" are taken from StockCharts.com using the "Symbol Summary" option instead of a "SharpChart" on the workbench.
Stop levels are all rounded down.
Axon Enterprise, Inc. (AXON)
EARNINGS: 2025-02-25 (AMC)
Axon Enterprise, Inc. engages in the development, manufacture, and sale of conducted electrical weapons for personal defense. It operates through the TASER segment and Software and Sensors segment. The TASER segment sells conducted electrical weapons, accessories, and other related products and services. The Software and Sensors segment includes devices, wearables, applications, cloud, and mobile products. The company was founded by Patrick W. Smith and Thomas P. Smith on September 7, 1993 and is headquartered in Scottsdale, AZ.
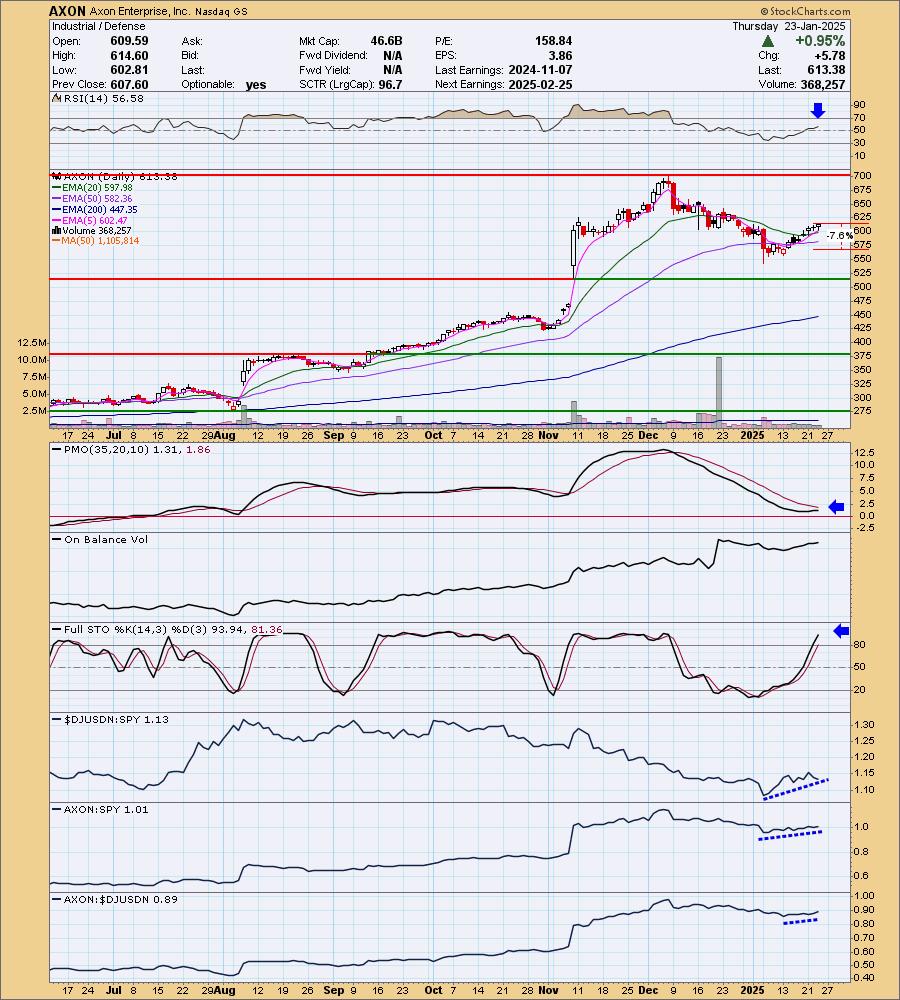
Predefined Scans Triggered: P&F Double Top Breakout.
AXON is unchanged in after hours trading. I liked the nice reversal, but I do have to say that it looks a little bear flag-ish so if this one turns on you, you might want to bail. Still, I see this as a new rally to test resistance. The RSI is now positive and is not overbought. The PMO is making its way higher toward a Crossover BUY Signal above the zero line. Stochastics are rising above 80 so there is internal strength. Relative strength for the group is improving and we can see that AXON is outperforming the SPY and the industry group. I've set the stop below the 50-day EMA at 7.6% or $566.76.
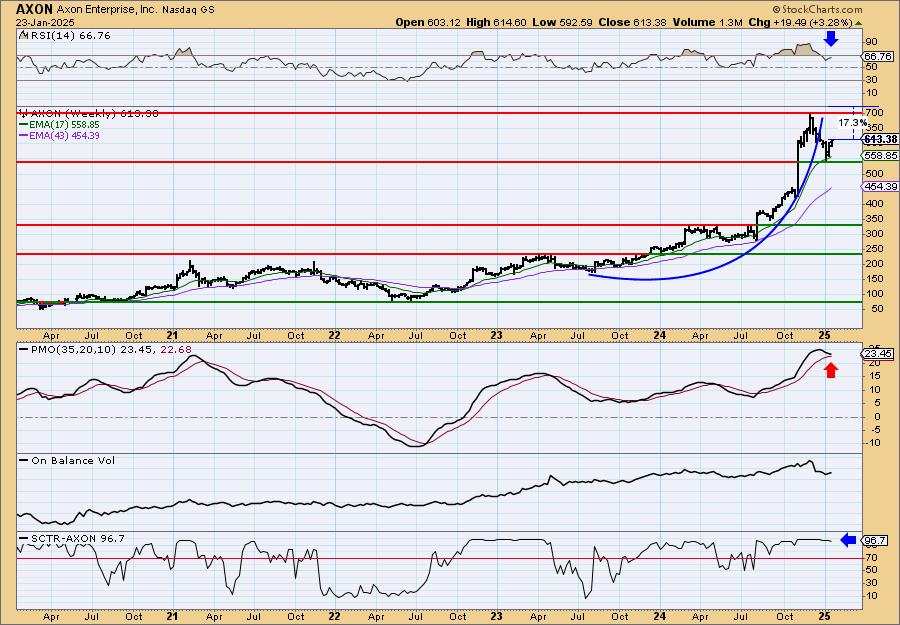
The weekly chart shows a parabolic breakdown and now we have an upside reversal. The weekly PMO is still trying to recover from the breakdown, but the rest of the weekly chart looks bullish. The weekly RSI is positive and not overbought and the StockCharts Technical Rank (SCTR) is at the top of the hot zone*. I'm looking for a breakout to new all-time highs. Under the new administration, Defense could be an interesting area to exploit.
*If a stock is in the "hot zone" above 70, it implies that it is stronger than 70% of its universe (large-, mid-, small-caps and ETFs) primarily in the intermediate to long terms.
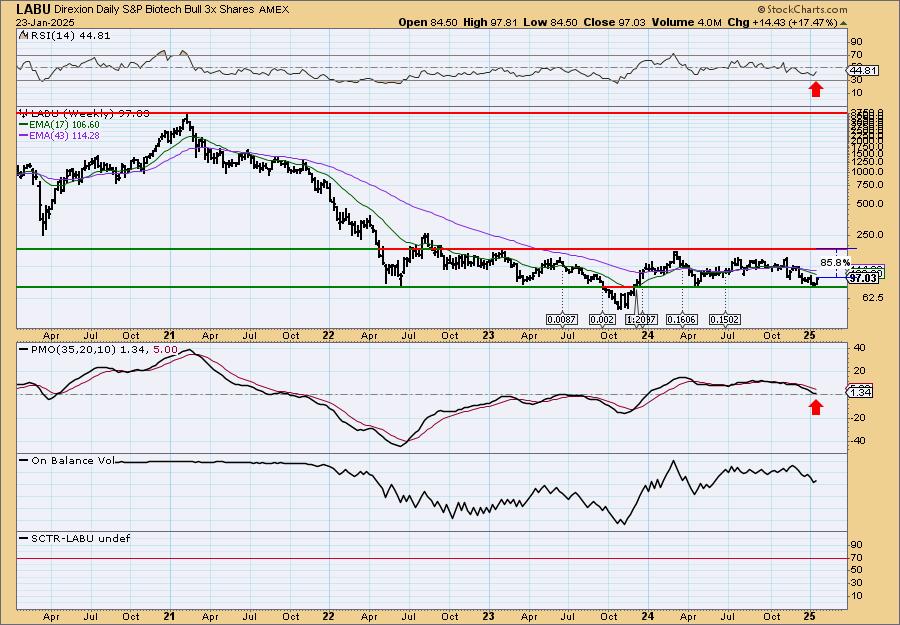
Direxion Daily S&P Biotech Bull 3x Shares (LABU)
EARNINGS: N/A
LABU provides daily 3 times exposure to the S&P Biotechnology Select Industry Index.
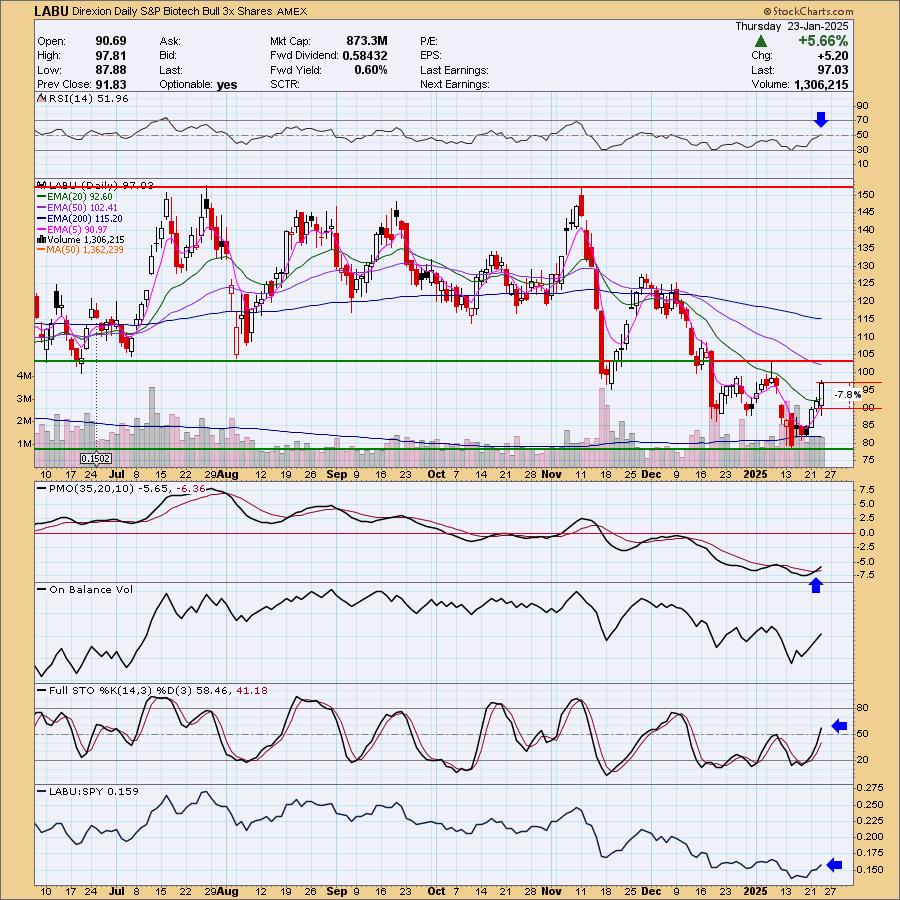
Predefined Scans Triggered: Parabolic SAR Buy Signals and P&F Double Top Breakout.
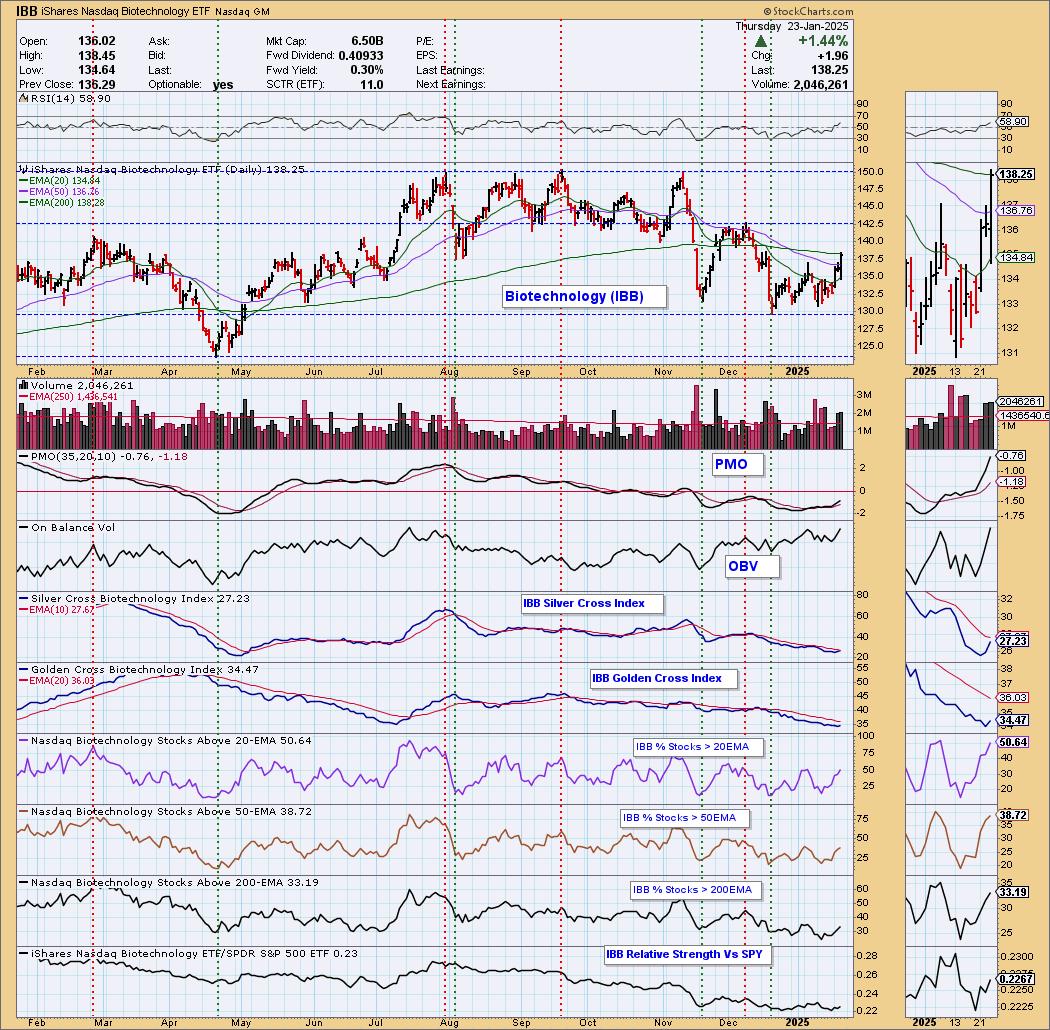
LABU is down -0.56% in after hours trading so we'll see how it does tomorrow. Remember this is leveraged so position size wisely. I think Biotechs are perking up. I've included the "under the hood" chart for Biotechnology for more information. This does look like a good bounce, but the declining trend is still intact right now. The RSI just moved into positive territory. The PMO is rising on a Crossover BUY Signal. Stochastics are rising strongly. Relative strength is beginning to kick in. The stop probably should be set deeper given this is leveraged, but I've opted for 7.8% or $89.46.
Under the hood, we see that participation is improving. The PMO is picking up speed and the Silver Cross Index is nearing a Bull Shift across the signal line. We should see price hit the first level of resistance at a minimum in my estimation.
We see that price is essentially stuck in a sideways trading range, but good news is that it looks ready to go back up and test the top of the range. The weekly RSI and weekly PMO aren't configured well so this is a short-term trade. As a leveraged position it shouldn't be held too long.
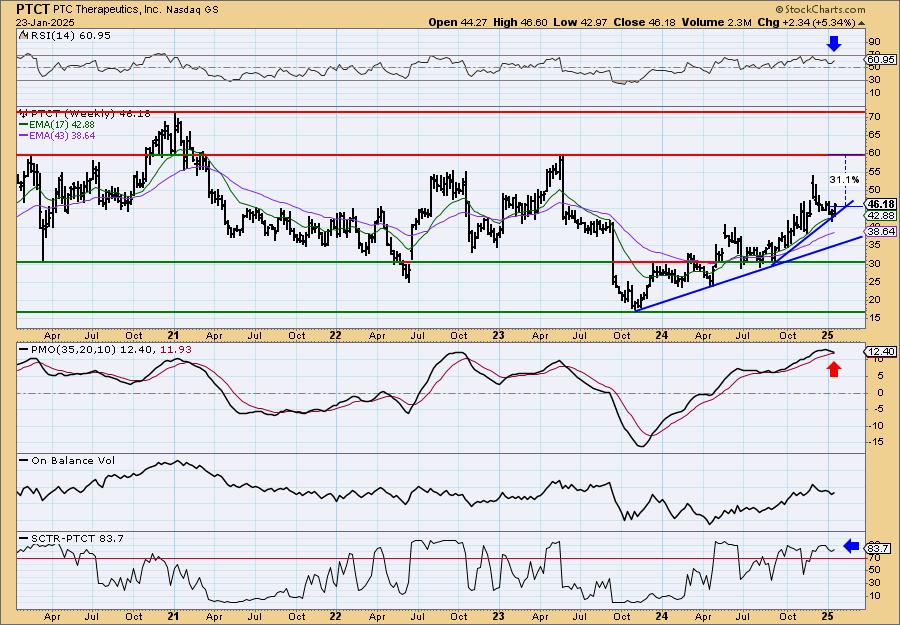
PTC Therapeutics, Inc. (PTCT)
EARNINGS: 2025-03-03 (AMC)
PTC Therapeutics, Inc. is a biopharmaceutical company, which focuses on the discovery, development, and commercialization of clinically differentiated medicines that provide benefits to patients with rare disorders. The company was founded by Allan Steven Jacobson and Stuart Walter Peltz on March 31, 1998 and is headquartered in Warren, NJ.
Predefined Scans Triggered: Bullish MACD Crossovers.
PTCT is unchanged in after hours trading. Biotechs look pretty good so I picked a Biotech stock for your review. I like the breakout from the declining trend and move above the 20/50-day EMAs. This one could also be looked at as a bearish flag, but the indicators are really improving so I am looking for followthrough. The RSI is now in positive territory. The PMO is rising above the zero line getting ready for a Crossover BUY Signal. Stochastics are rising strongly toward 80. Relative strength for the group is somewhat mediocre, but PTCT is outperforming it and the SPY right now. Today's candlestick was bullish engulfing. The stop is set as close to support as possible at 7.8% or $42.57.

Price is in a steepening rising trend and is just now bouncing off it. The weekly RSI looks good, but unfortunately the weekly PMO is nearing a Crossover SELL Signal. I'm okay with it for now given the SCTR is in the hot zone with the positive weekly RSI. There is very good upside potential.
Don't forget, on Thursdays I look at reader-requested symbols, click HERE to send me an email. I read every email I receive and try to answer them all!
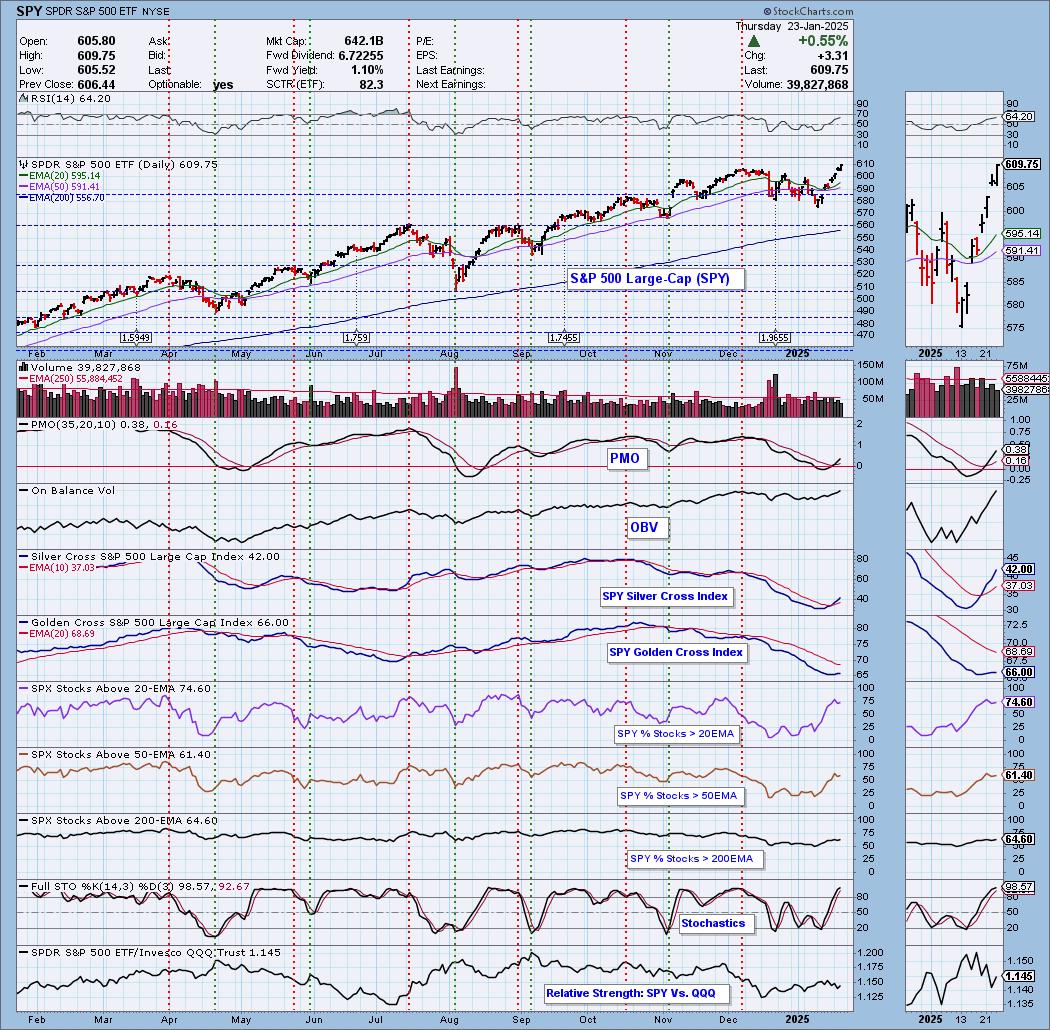
Current Market Outlook:
Market Environment: It is important to consider the odds for success by assessing the market tides. The following chart uses different methodologies for objectively showing the depth and trend of participation for intermediate- and long-term time frames.
- The Silver Cross Index (SCI) shows the percentage of SPX stocks on IT Trend Model BUY signals (20-EMA > 50-EMA)
- The Golden Cross Index (GCI) shows the percentage of SPX stocks on LT Trend Model BUY signals (50-EMA > 200-EMA)
Don't forget that as a "Diamonds" member, you have access to our "Under the Hood" curated ChartList on DecisionPoint.com. You'll find it under "Members Only" links on the left side on the Blogs and Links Page.
Here is the current chart:
Full Disclosure: I am 55% long, 0% short.
I'm required to disclose if I currently own a stock I mention and/or may buy/short it within the next 72 hours.
"Technical Analysis is a windsock, not a crystal ball." - Carl Swenlin
(c) Copyright 2025 DecisionPoint.com
Watch the latest episode of DecisionPoint Trading Room with Carl & Erin Swenlin Mondays on the DecisionPoint YouTube channel here!
NOTE: The stocks reported herein are from mechanical trading model scans that are based upon moving average relationships, momentum and volume. DecisionPoint analysis is then applied to get five selections from the scans. The selections given should prompt readers to do a chart review using their own analysis process. This letter is not a call for a specific action to buy, sell or short any of the stocks provided. There are NO sure things or guaranteed returns on the daily selection of "Diamonds in the Rough."
Regarding BUY/SELL Signals: The signal status reported herein is based upon mechanical trading model signals and crossovers. They define the implied bias of the price index/stock based upon moving average relationships and momentum, but they do not necessarily call for a specific action. They are information flags that should prompt chart review. Further, they do not call for continuous buying or selling during the life of the signal. For example, a BUY signal will probably (but not necessarily) return the best results if action is taken soon after the signal is generated. Additional opportunities for buying may be found as price zigzags higher, but the trader must look for optimum entry points. Conversely, exit points to preserve gains (or minimize losses) may be evident before the model mechanically closes the signal.
Helpful DecisionPoint Links:
Price Momentum Oscillator (PMO)
Swenlin Trading Oscillators (STO-B and STO-V)
For more links, go to DecisionPoint.com