
During this morning's trading room, the market was still looking fairly healthy, but a decline during the day changed the picture somewhat. I'll be writing more on this in today's DP Alert. It should concern us, but given the bullish bias of the market currently, I'm not looking for a big decline, probably just some cooling or churn.
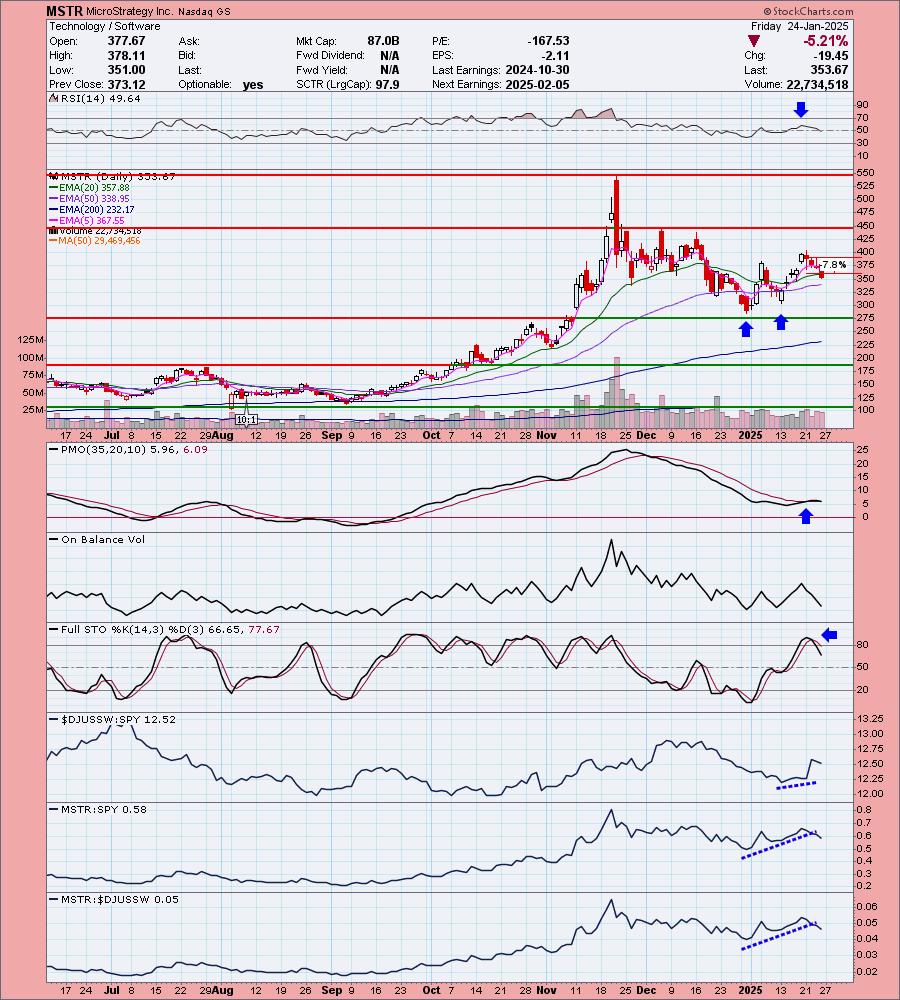
Due to the turnaround, many positions that were positive to start the day, switched gears into negative territory. MicroStrategy (MSTR) was my risky reversal candidate. Unfortunately it took a turn for the worse and was down over 5% on the day which triggered the stop. Short-lived "Diamond in the Rough". It could be watch list material.
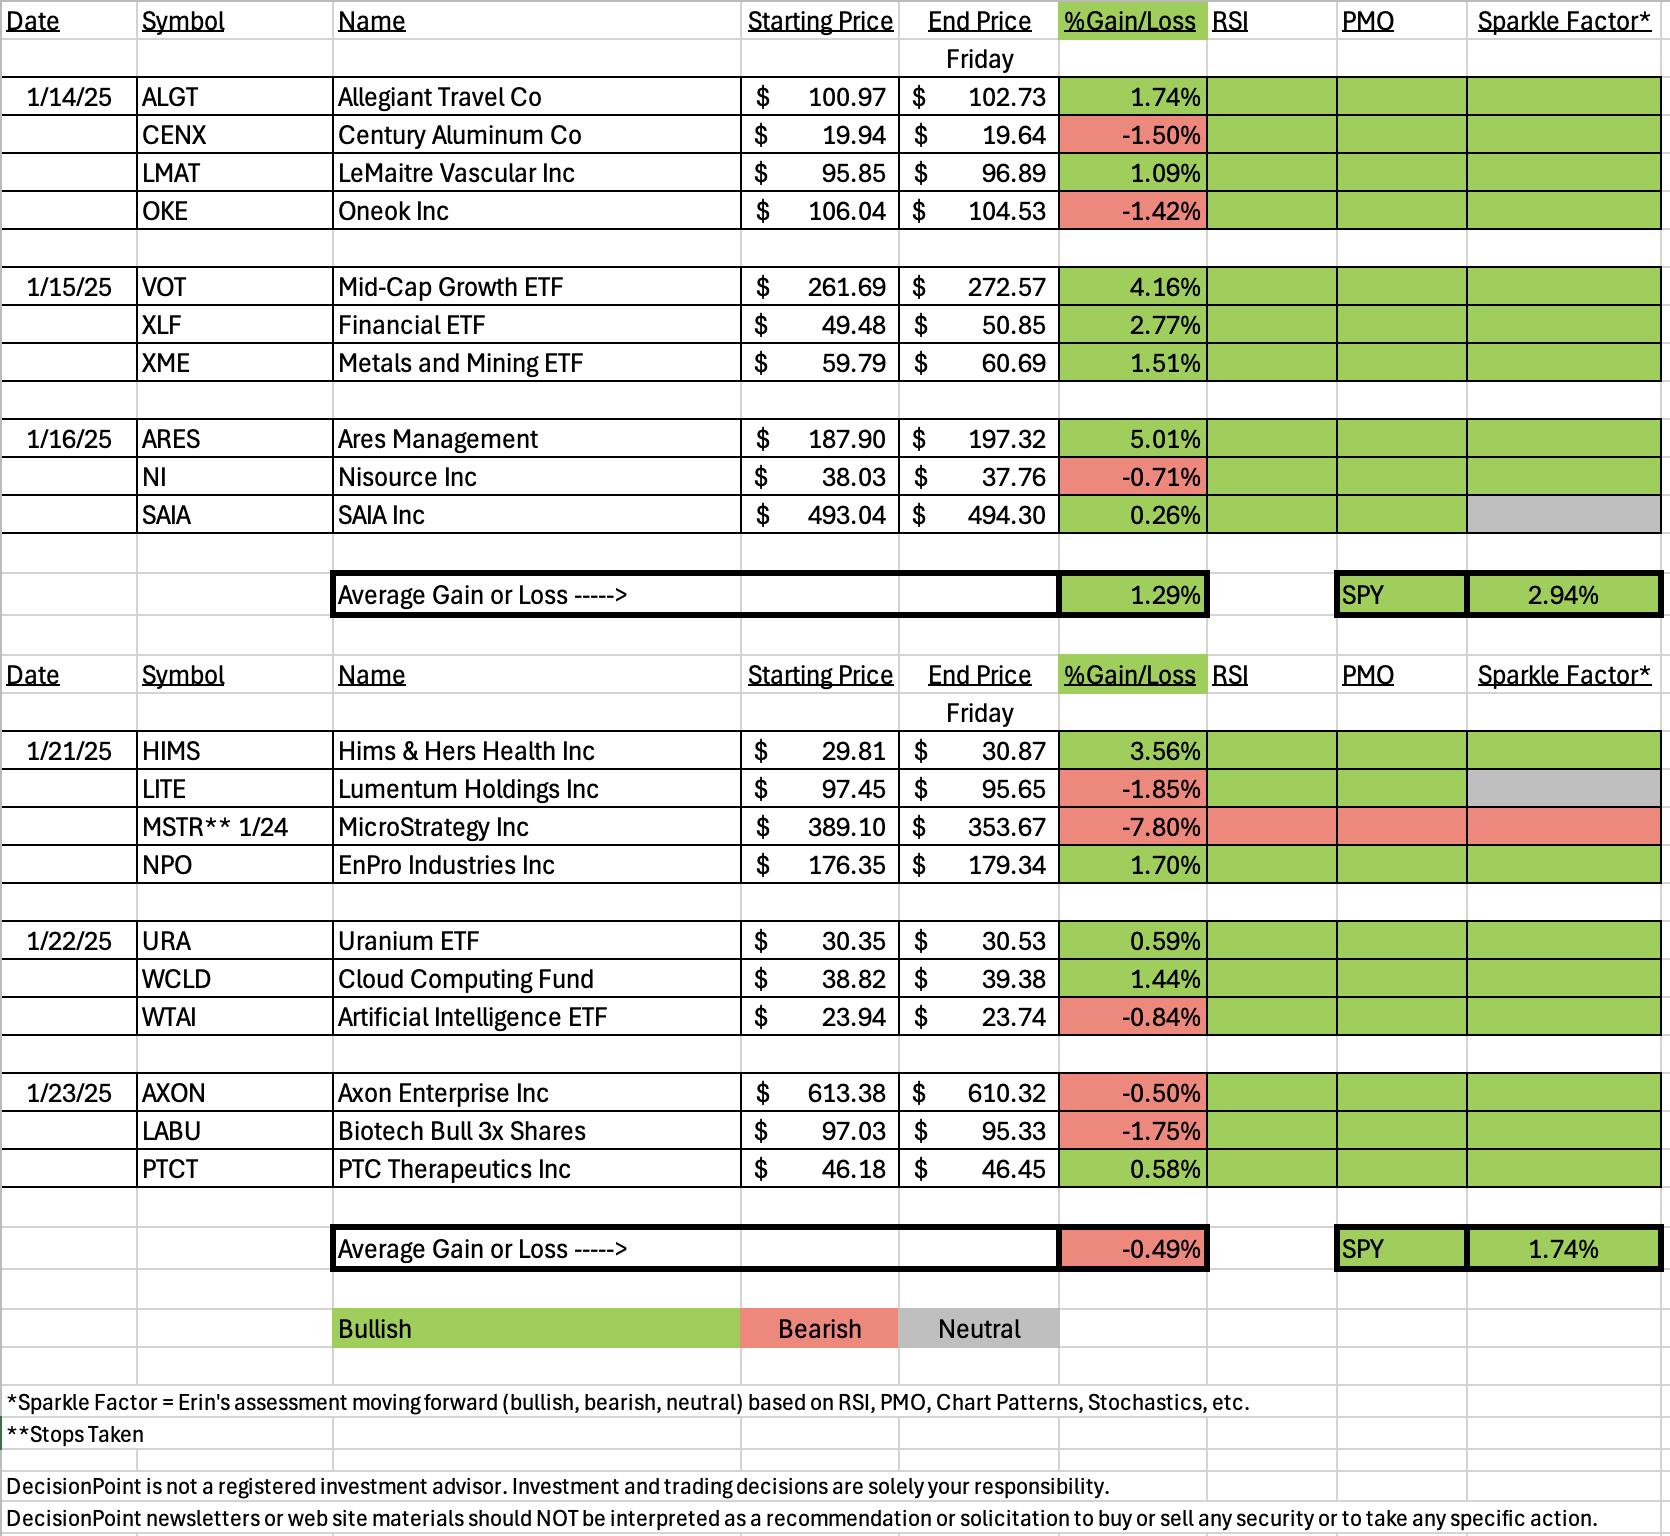
The Darling this week was Hims & Hers Health (HIMS) which was up +3.56% on the week.
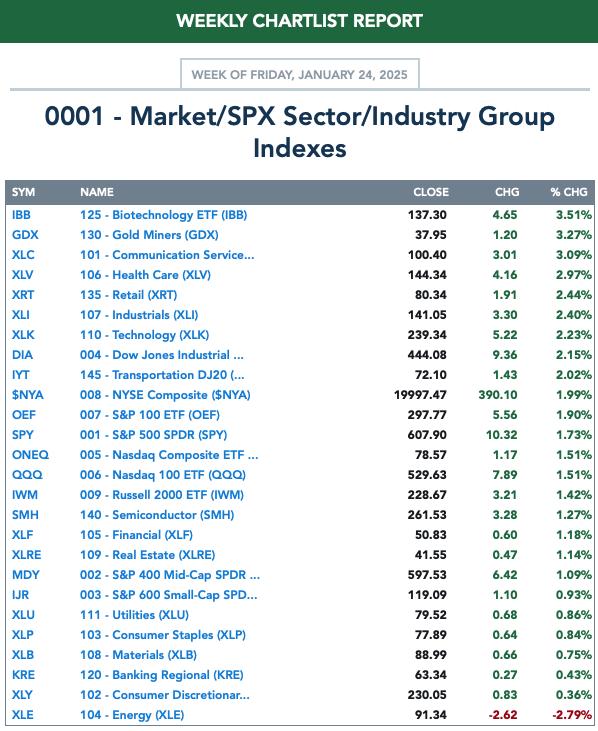
The Sector to Watch could have been any number of the sectors as most do look bullish. I opted to go with Healthcare (XLV) as I liked the shape of the current rally. Energy (XLE) should be avoided.
The Industry Group to Watch was Healthcare Providers, but it could've been Biotechs (IBB) which I wrote about in a free article. You'll find that article here. I found a handful of symbols from Healthcare Providers you may want to look at: MD, LFST, OSLR, FMS and PGNY. I also looked within Biotechs and found: VERV, TVTX, ADPT and VCYT.
I ran the Diamond PMO Scan and a scan that I don't use often to see what we could find. I was able to find a few symbols I liked: PLTR, APP, WMT, PRLB and REZI.
Have a great weekend! See you in the Monday trading room at Noon ET! If you haven't signed up for the free trading room, here is a link to get you started. The best part is that you only have to register once for Monday's trading rooms.
Good Luck & Good Trading,
Erin

Diamond Mine Trading Room:
RECORDING & DOWNLOAD LINK (1/24/2025):
Topic: DecisionPoint Diamond Mine (1/24/2025) LIVE Trading Room
Download & Recording Link HERE
Passcode: January#24
REGISTRATION for 1/31/2025:
When: January 31, 2025 09:00 AM Pacific Time (US and Canada)
Topic: DecisionPoint Diamond Mine LIVE Trading Room
Register in advance for this webinar HERE
After registering, you will receive a confirmation email containing information about joining the webinar.

Below is the latest free DecisionPoint Trading Room recording from 1/6 (No recording 1/13 or 1/27). You'll find these recordings posted on Mondays to our DP YouTube Channel. Be sure and subscribe HERE.
A few items about the spreadsheet: I've put on the spreadsheet whether the RSI is positive (green) or negative (red). The PMO column tells you if it is rising (green) or falling (red). Finally I've added my own "Sparkle Factor" that gives you my assessment going forward, bullish (green), bearish (red) or neutral (gray). The Sparkle Factor is basically my thoughts on whether I expect it to rise or fall. A neutral means it could really go either way so it could be added to a watch list. If you're in a stock I consider "neutral" going forward, the ball is in your court.
Darling:
Hims & Hers Health, Inc. (HIMS)
EARNINGS: 2025-02-24 (AMC)
Hims & Hers Health, Inc. operates a telehealth consultation platform. It connects consumers to healthcare professionals, enabling them to access medical care for mental health, sexual health, dermatology and primary care. The company was founded in 2017 and is headquartered in San Francisco, CA.
Predefined Scans Triggered: Moved Above Upper Bollinger Band, Moved Above Ichimoku Cloud, New CCI buy Signals and P&F Double Top Breakout.
Below are the commentary and chart from Tuesday, 1/21:
"HIMS is up +0.40% in after hours trading. There is a bullish triple bottom that has essentially been confirmed with this breakout. The PMO is a little bit flat right now, but it is going in for a Crossover BUY Signal above the zero line. Price bottoms are angling lower while the OBV shows rising bottoms for a positive divergence. Stochastics are almost above 80. Relative strength for the group is kicking up again and overall it is on a rising trend. HIMS is outperforming both the SPY and the group. The stop is set near the 20-day EMA at 7.8% or $27.48."
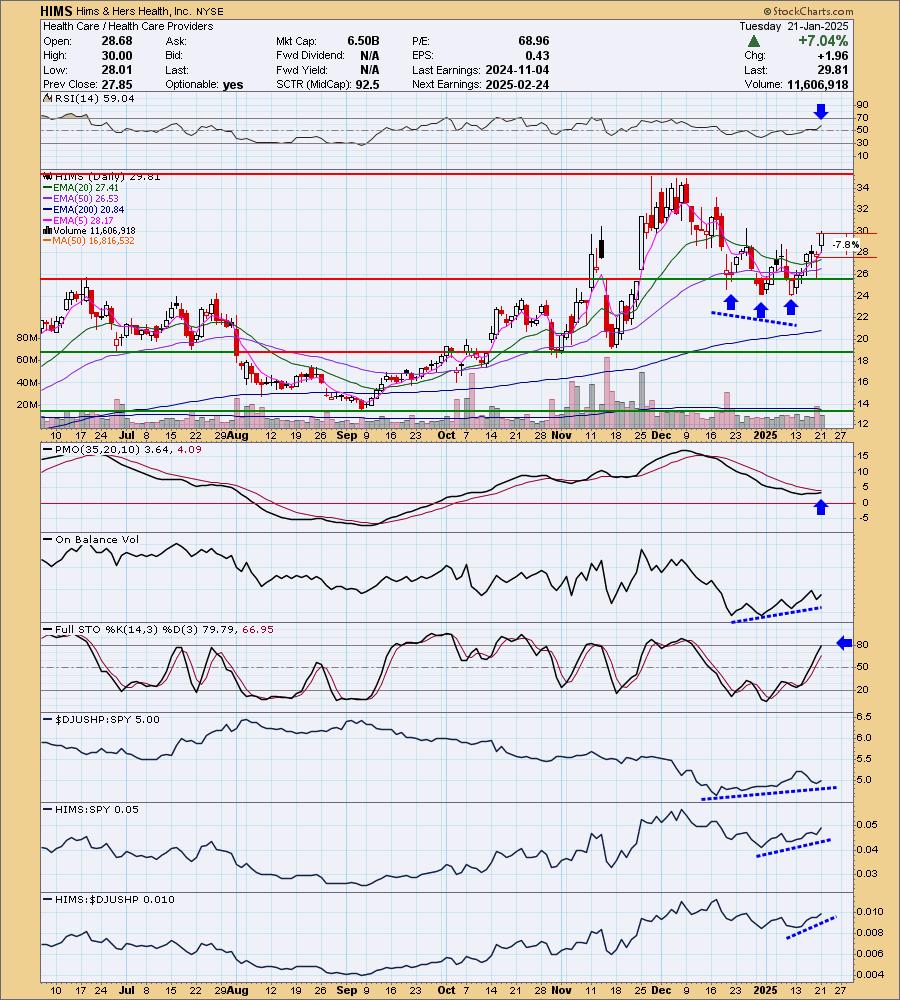
Here is today's chart:
This one was really set up well. The OBV positive divergence set things in motion and now momentum is rising as it should. Stochastics did top, but we had a little decline today that could be responsible. This comes from our Industry Group to Watch, Healthcare Providers. I think it has more upside to go.
Don't forget, on Thursdays I look at reader-requested symbols, so shoot me an email at erin@decisionpoint.com. I read every email I receive and try to answer them all!
Dud:
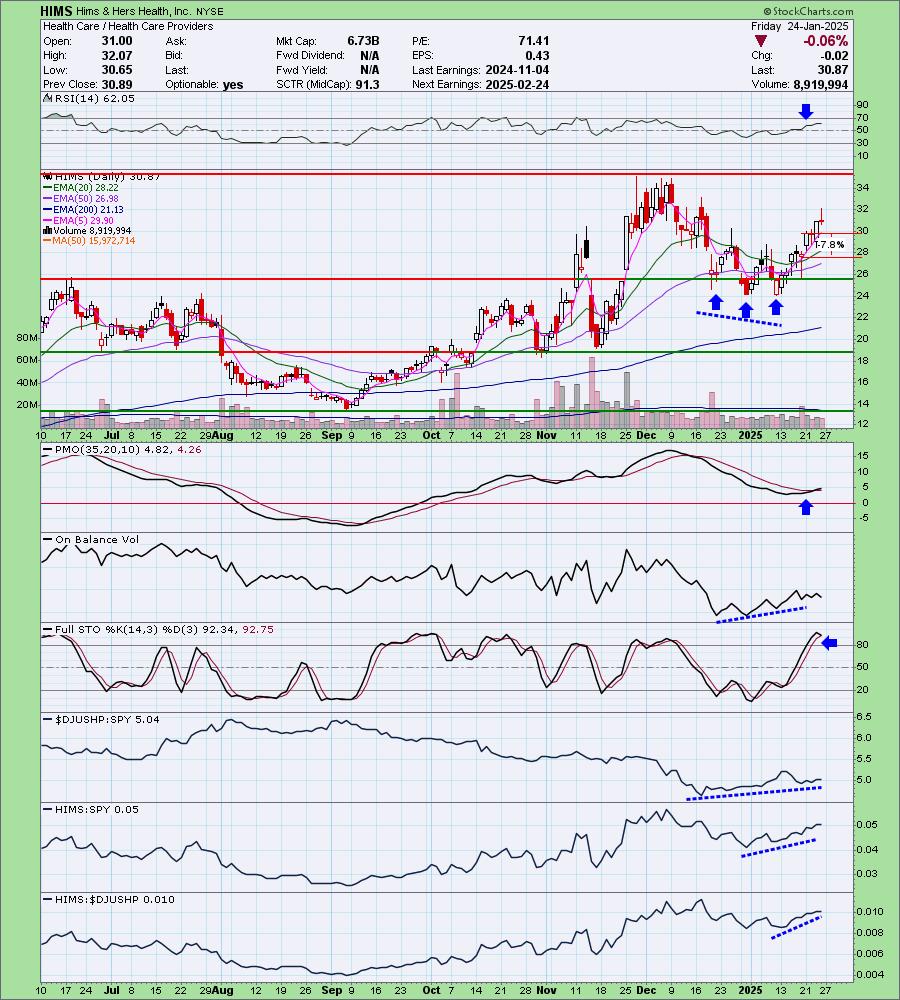
MicroStrategy Inc. (MSTR)
EARNINGS: 2025-02-06 (AMC)
MicroStrategy, Inc. engages in the provision of enterprise analytics and mobility software. The firm designs, develops, markets, and sells software platforms through licensing arrangements and cloud-based subscriptions and related services. Its product packages include Hyper. The company was founded by Michael J. Saylor and Sanjeev K. Bansal on November 17, 1989, and is headquartered in Vienna, VA.
Predefined Scans Triggered: Entered Ichimoku Cloud and P&F Double Top Breakout.
Below are the commentary and chart from Tuesday, 1/21:
"MSTR is down -0.09% in after hours trading. This is your high risk play on a stock that isn't a meme, but is certainly seeing some buzz. We can see a parabolic breakdown in November. It corrected and is now working its way back up. This one had the highest PMO value of all the stocks I looked at today. I was disappointed it didn't rally today, but that offers a better entry. The RSI is positive and not overbought. The PMO is on a new Crossover BUY Signal. Stochastics are rising above 80. It does have a big negative P/E so consider it very short-term. Relative strength looks like it is improving for Software. MSTR is outperforming the group and most importantly it is outperforming the SPY. The stop is set at the 20-day EMA at 7.8% or $358.75."
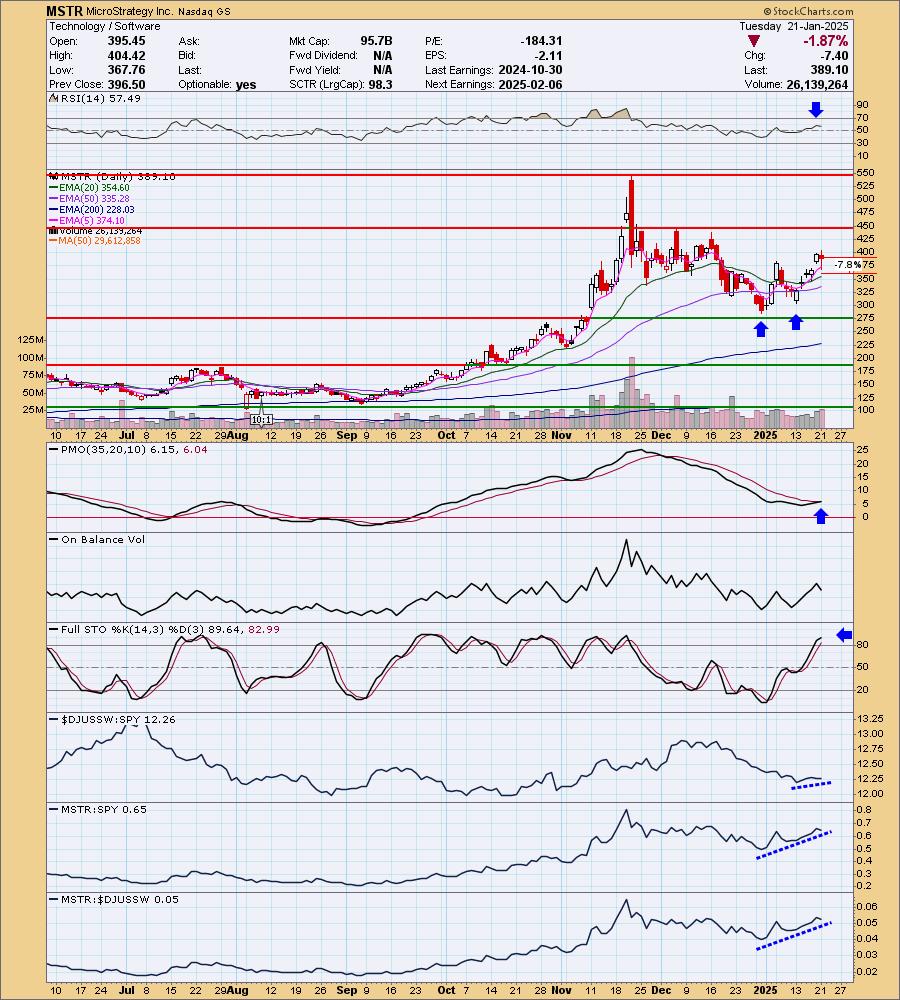
Here is today's chart:
The bullish double bottom hasn't busted yet, but it is on its way. What went wrong? I suppose it could be handed to a somewhat flat PMO Crossover BUY Signal. Everything was lined up on the chart. The RSI is now in negative territory and there is a new PMO Crossover SELL Signal. It's time to wait on this one again and add it to a watch list to see if it can reverse and offer a good entry. This was probably one of my favorite setups this week, not sure where it went wrong. It does report earnings on 2/5 so you may want to wait that out before giving this one another try.
THIS WEEK's Performance:
DecisionPoint Market Scoreboard (Mechanical Trend Model Signals):
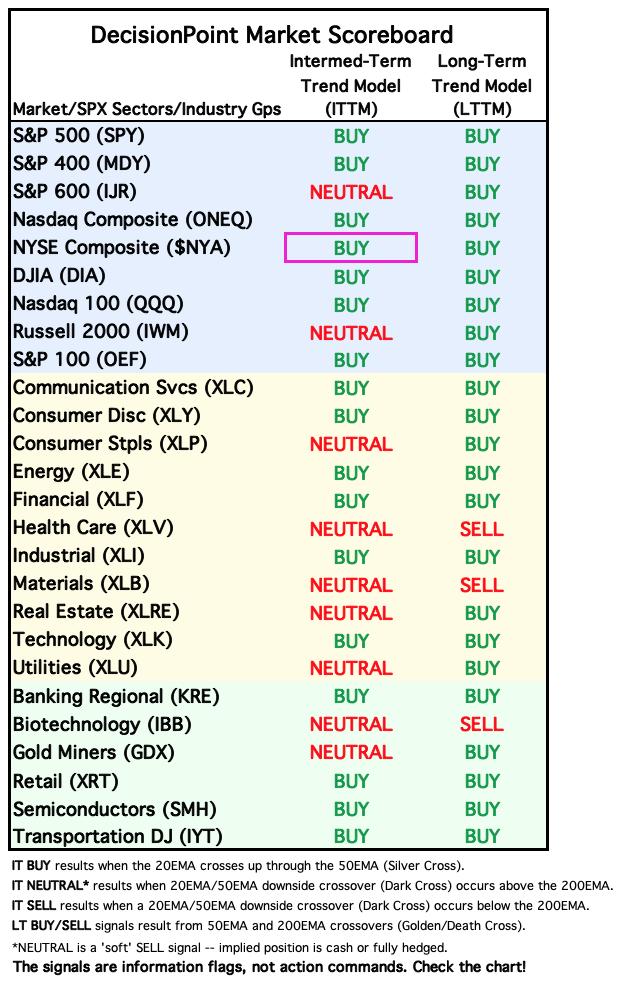
Friday signal changes are outlined in purple.
Click Here to view Carl's annotated "Under the Hood" ChartList!
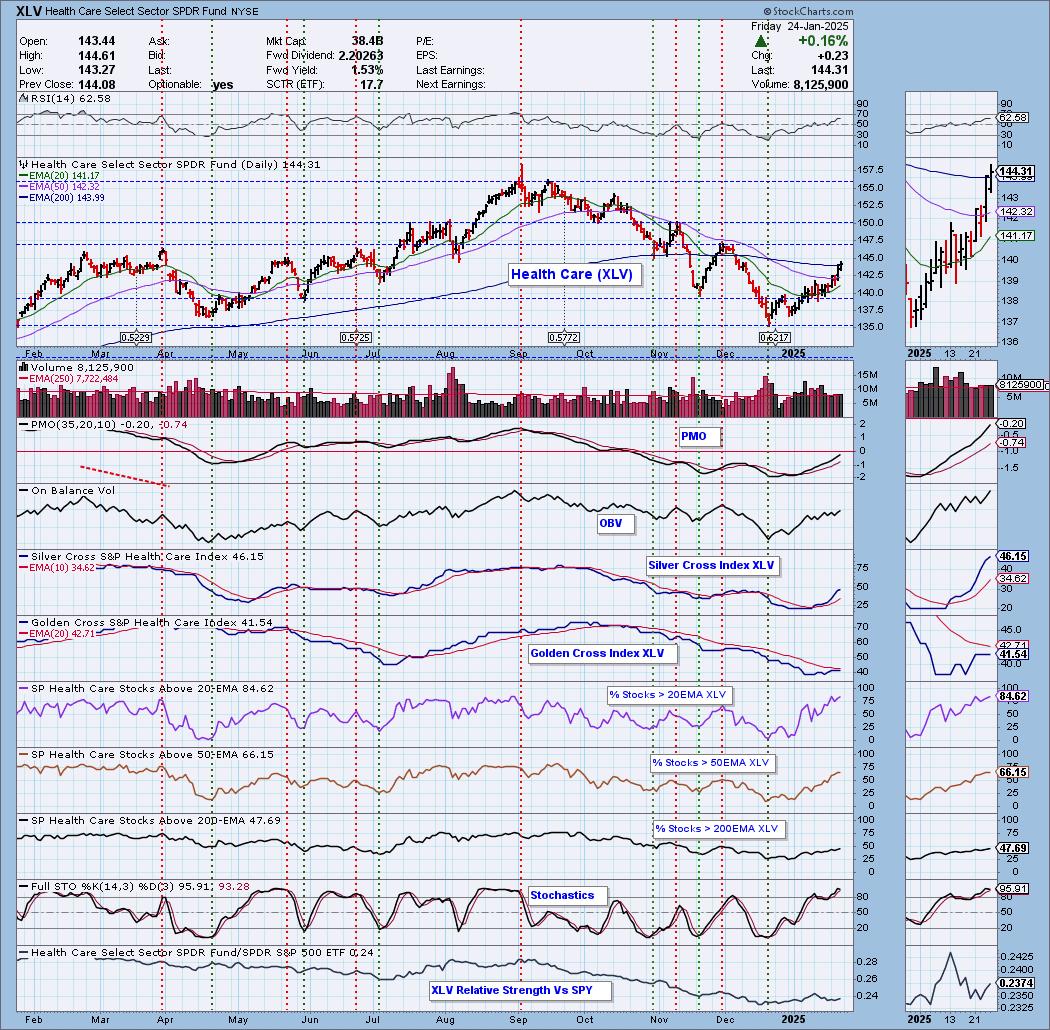
Sector to Watch: Health Care (XLV)
We have a very nice rally going on here with a move and close above the 200-day EMA. The rally seems to be picking up speed and internals are very strong. The RSI is positive and not overbought. The PMO is nearing positive territory on a Crossover BUY Signal. The Silver Cross Index is rising strongly. The Golden Cross Index is flat so I'd like to see more out of it. Participation of stocks above key moving averages is improving and is currently at very healthy levels. Stochastics look good above 80 and we can see a little bit of relative strength coming in.
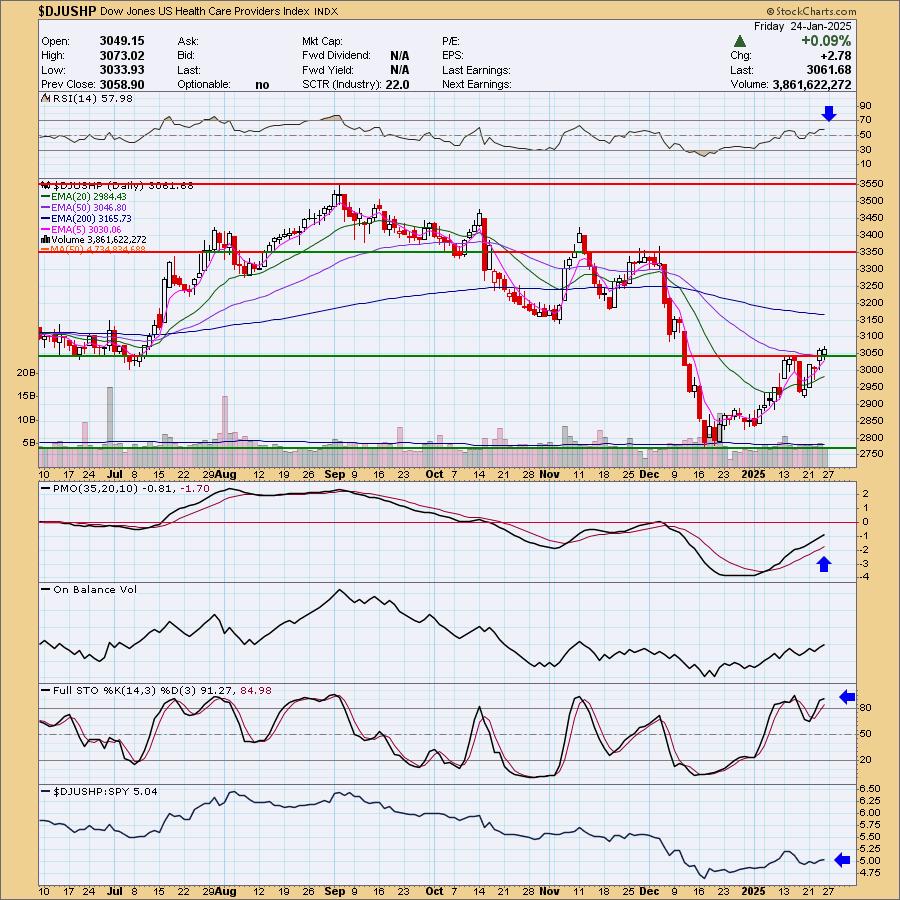
Industry Group to Watch: Health Care Providers ($DJUSHP)
I was drawn to the breakout more than anything else. However, indicators are certainly on board for more upside in this group. The RSI is positive and not overbought. The PMO is on the rise, albeit in negative territory. Stochastics are above 80. That PMO looks very strong and I would say is new strength on this rally so I'm forgiving it being in negative territory. We are beginning to see some outperformance against the SPY. The symbols of interest here are: MD, LFST, OSLR, FMS and PGNY.
Go to our Under the Hood ChartList on DecisionPoint.com to get an in-depth view of all the sectors. On StockCharts.com you can find the Industry Summary.
Good Luck & Good Trading!
- Erin
erin@decisionpoint.com
Full Disclosure: I'm 55% long, 0% short.
Watch the latest episode of the DecisionPoint Trading Room with Carl & Erin Swenlin HERE!
Technical Analysis is a windsock, not a crystal ball. --Carl Swenlin
NOTE: The stocks reported herein are from mechanical trading model scans that are based upon moving average relationships, momentum and volume. DecisionPoint analysis is then applied to get selections from the scans. The selections given should prompt readers to do a chart review using their own analysis process. This letter is not a call for a specific action to buy, sell or short any of the stocks provided. There are NO sure things or guaranteed returns on the selection of "diamonds in the rough."
Helpful DecisionPoint Links:
DecisionPoint Shared ChartList and DecisionPoint Chart Gallery
Price Momentum Oscillator (PMO)
Swenlin Trading Oscillators (STO-B and STO-V)
(c) Copyright 2025 DecisionPoint.com