
The scans produced, mainly growth type funds or Technology based funds. I actually went out on my own with one of today's selections to an area that is seeing new found interest.
I opted to go with two Technology related ETFs and Uranium (URA).
URA is seeing plenty of action right now given the new Executive Order of a national energy emergency. Nuclear power has already been seeing interest for powering AI, but now it could be seeing more interest as an alternative to fossil fuels. There is also discussion of mini reactors as well.
Tomorrow is Reader Request Day so get those symbols in! There are lots of choices out there right now given the broad market is participating right now. I'm curious what is on your watch lists.
Good Luck & Good Trading,
Erin
Today's "Diamonds in the Rough": URA, WCLD and WTAI.
Runner-ups: ARKK, CIBR, QGRW, SPBC, ONEQ, TSPA, WEBL and ARKW.

Diamond Mine Trading Room:
RECORDING & DOWNLOAD LINK (1/17/2025):
Topic: DecisionPoint Diamond Mine (1/17/2025) LIVE Trading Room
Download & Recording Link
Passcode: January#17
REGISTRATION for 1/24/2025:
When: January 24, 2025 09:00 AM Pacific Time (US and Canada)
Topic: DecisionPoint Diamond Mine LIVE Trading Room
Register in advance for this webinar HERE
After registering, you will receive a confirmation email containing information about joining the webinar.

Below is the latest free DecisionPoint Trading Room recording from 1/6 (No recording 1/13 or 1/27). You'll find these recordings posted on Mondays to our DP YouTube Channel. Be sure and subscribe HERE.
Welcome to DecisionPoint Diamonds, wherein I highlight ten "Diamonds in the Rough" per week. These are selected from the results of my DecisionPoint Scans which search for stocks that could benefit from the trend and condition of the market. Remember, these are not recommendations to buy or sell, but are the most interesting of the stocks that surfaced in my scans. My objective is to save you the work of the initial, tedious culling process, but you need to apply your own analysis to see if these stocks pique your interest as well. There are no guaranteed winners here!
"Predefined Scans Triggered" are taken from StockCharts.com using the "Symbol Summary" option instead of a "SharpChart" on the workbench.
Stop levels are all rounded down.
Global X Uranium ETF (URA)
EARNINGS: N/A
URA tracks a market-cap-weighted index of companies involved in uranium mining and the production of nuclear components. Click HERE for more information.
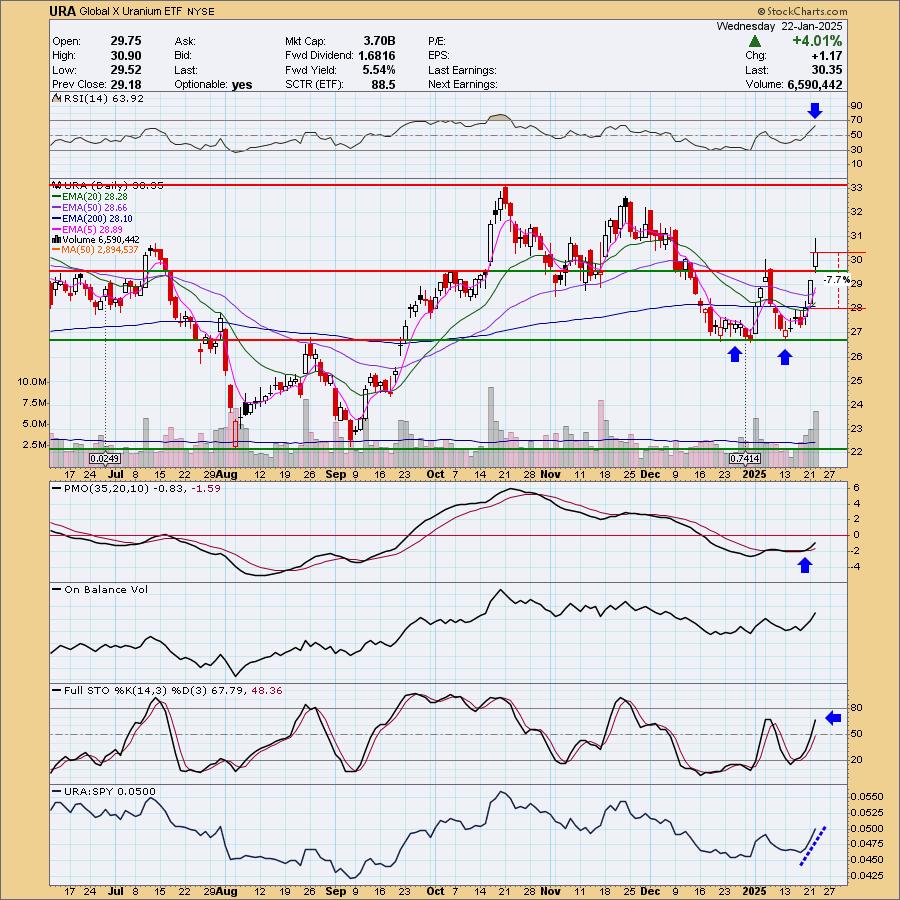
Predefined Scans Triggered: Stocks in a New Uptrend (Aroon), Moved Above Upper Price Channel, Parabolic SAR Buy Signals and Moved Above Upper Keltner Channel.
URA is up +0.19% in after hours trading. We have a confirmed double bottom pattern as price broke out above the confirmation line. The last two days of rally are impressive and in my mind suggests we have even more upside available. The RSI is positive and not yet overbought despite the strong rally. The PMO is rising strongly toward the zero line. This looks like new strength not diminishing weakness. Stochastics are moving vertically higher toward 80. This ETF is obviously outperforming right now. The stop is set beneath the 200-day EMA at 7.7% or $28.01.
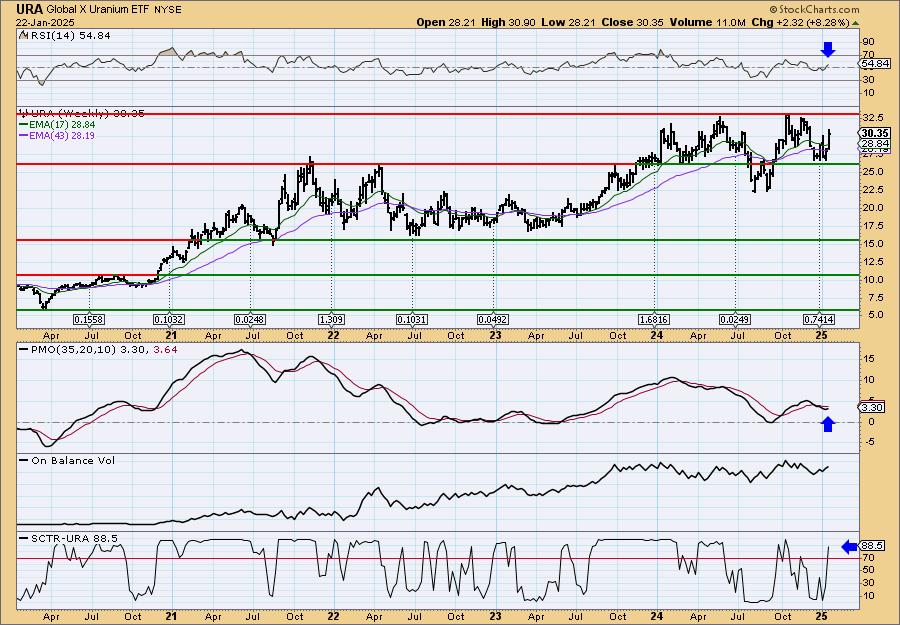
The weekly chart price action isn't that great as it has been bouncing around sideways all year. However, indicators do look encouraging. The weekly RSI is positive and far from overbought. The weekly PMO is turning back up. The StockCharts Technical Rank (SCTR) is in the hot zone*. Consider a 17% upside target to about $35.51.
*If a stock is in the "hot zone" above 70, it implies that it is stronger than 70% of its universe (large-, mid-, small-caps and ETFs) primarily in the intermediate to long terms.
WisdomTree Cloud Computing Fund (WCLD)
EARNINGS: N/A
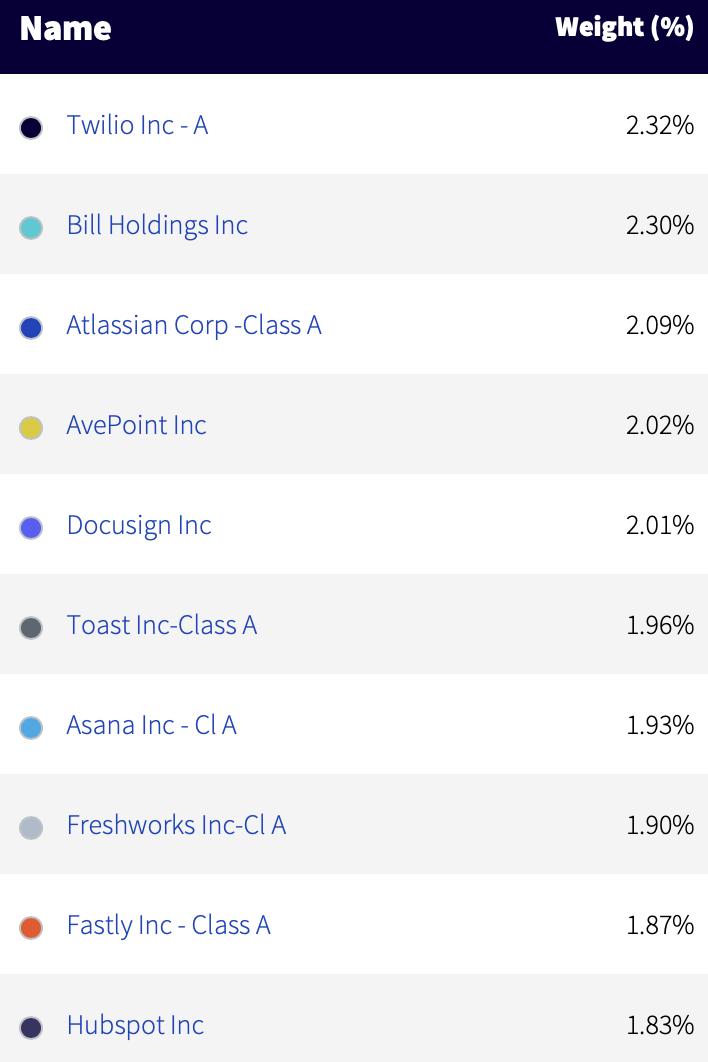
WCLD tracks and index of US companies primarily focused on cloud software and services. Stocks are equal weighted in the index. Click HERE for more information.
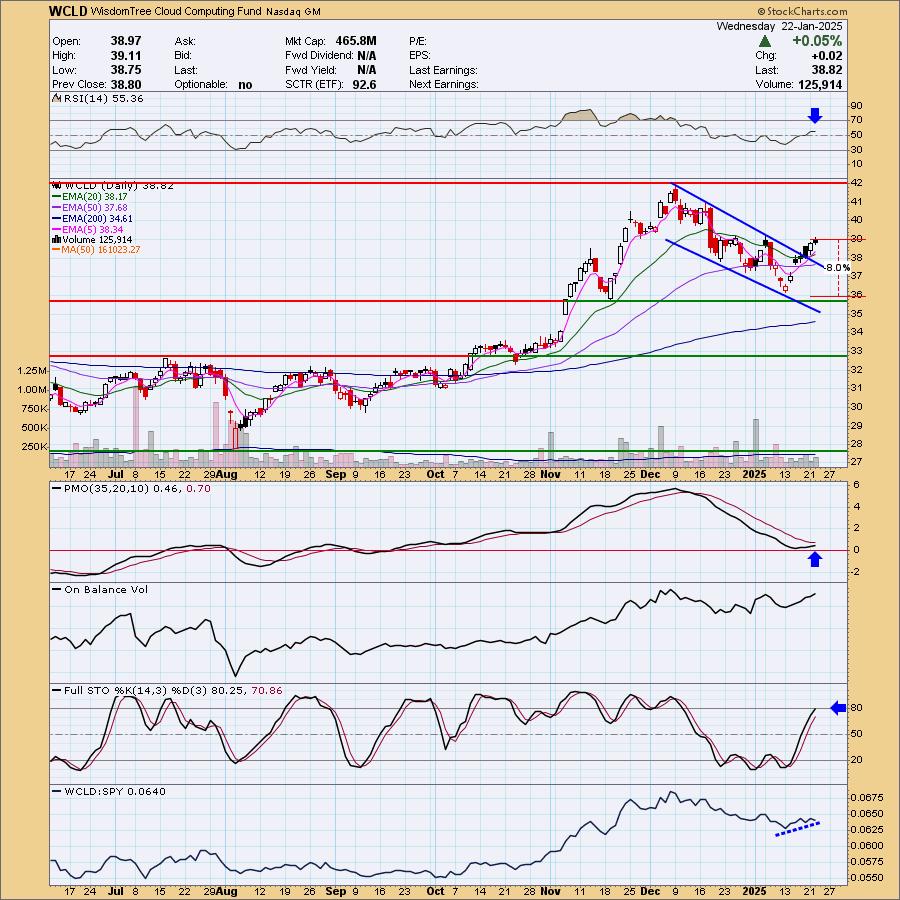
Predefined Scans Triggered: Filled Black Candles.
WCLD is unchanged in after hours trading. We have a breakout from a bullish falling wedge. I don't like today's filled black candlestick, but we can see many of them made up the current rally so I'll forgive it. The RSI is positive and not overbought. The PMO is rising toward a Crossover BUY Signal and Stochastics look very strong as they near 80. We also see a little bit of outperformance by this ETF against the SPY. I've set the stop below support at 8% or $35.71.
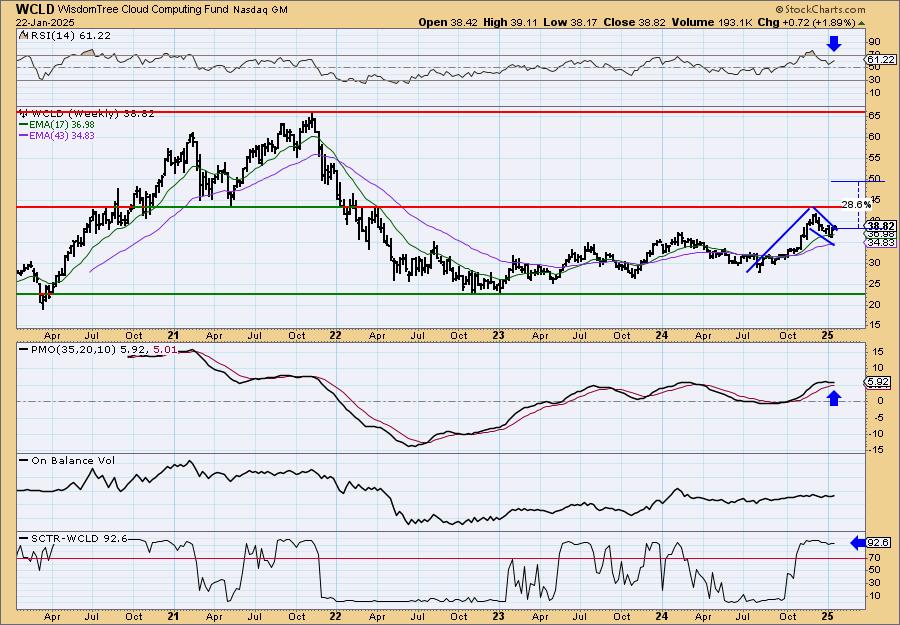
I really like the bull flag formation on the weekly chart that suggests far more upside to go if it works toward its minimum upside target. The rally should be the height of the flagpole if we get a good breakout here. The weekly RSI is positive. The weekly PMO is rather flat, but it does appear that it wants to turn up already. The SCTR is well within the hot zone above 70.
WisdomTree Artificial Intelligence and Innovation Fund (WTAI)
EARNINGS: N/A
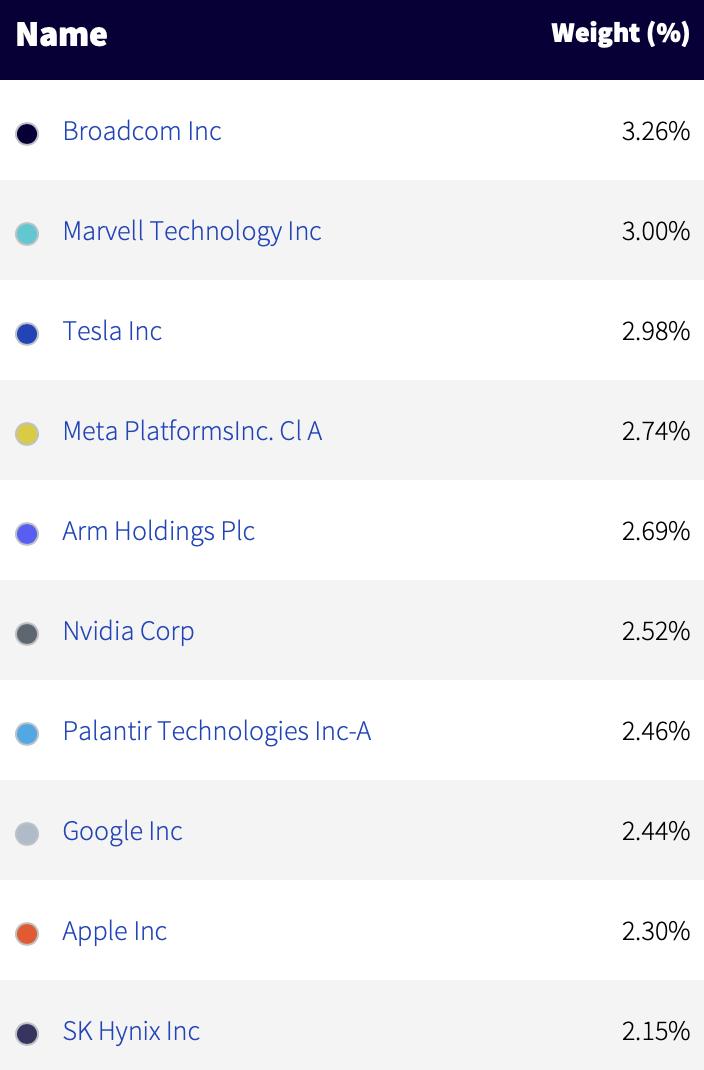
WTAI tracks an equally-weighted index of globally-listed stocks whose businesses are derived from artificial intelligence and innovation. Selection and weighting are overseen by a committee. Click HERE for more information.
Predefined Scans Triggered: Moved Above Upper Keltner Channel, New 52-week Highs and P&F Double Top Breakout.
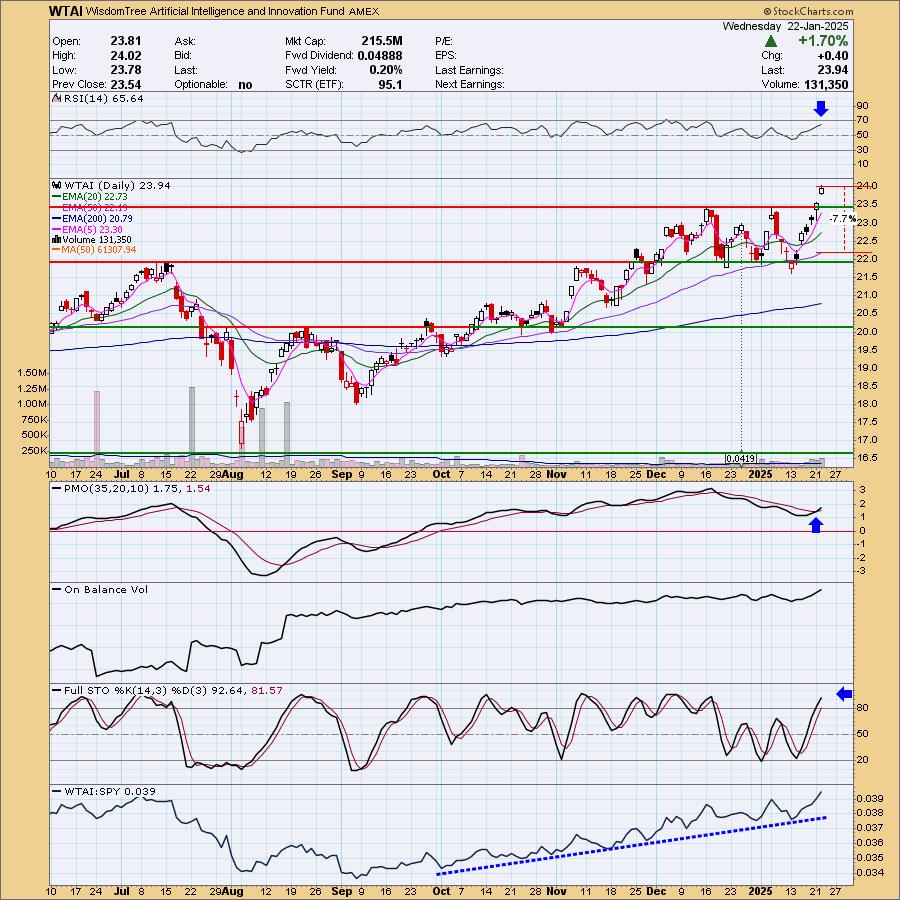
WTAI is up +0.08% in after hours trading. Yesterday's announcement of Stargate AI by the president has brought even more interest into the AI space. This group is back on the rise after time spent consolidating the prior rally. I like this followthrough breakout. The RSI is not overbought despite a lengthy rally. The PMO is on a relatively new BUY signal. Stochastics are rising above 80. This ETF has been outperforming for some time and could continue to. The stop is set around the 50-day EMA at 7.7% or $22.09.
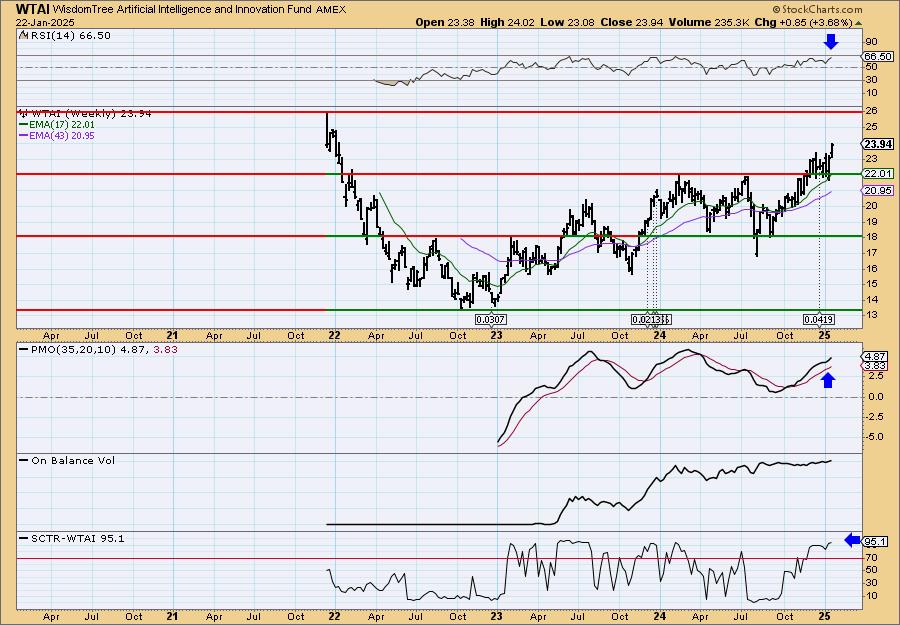
We have a nice breakout from a trading range on the weekly chart. It looks like it is headed to its all-time highs. The weekly RSI is staying positive and is not overbought. There is a weekly PMO surge above the signal line. The SCTR is in the hot zone. Consider a 17% upside target to about $28.01.
Don't forget, on Thursdays I look at reader-requested symbols, click HERE to send me an email. I read every email I receive and try to answer them all!
Current Market Outlook:
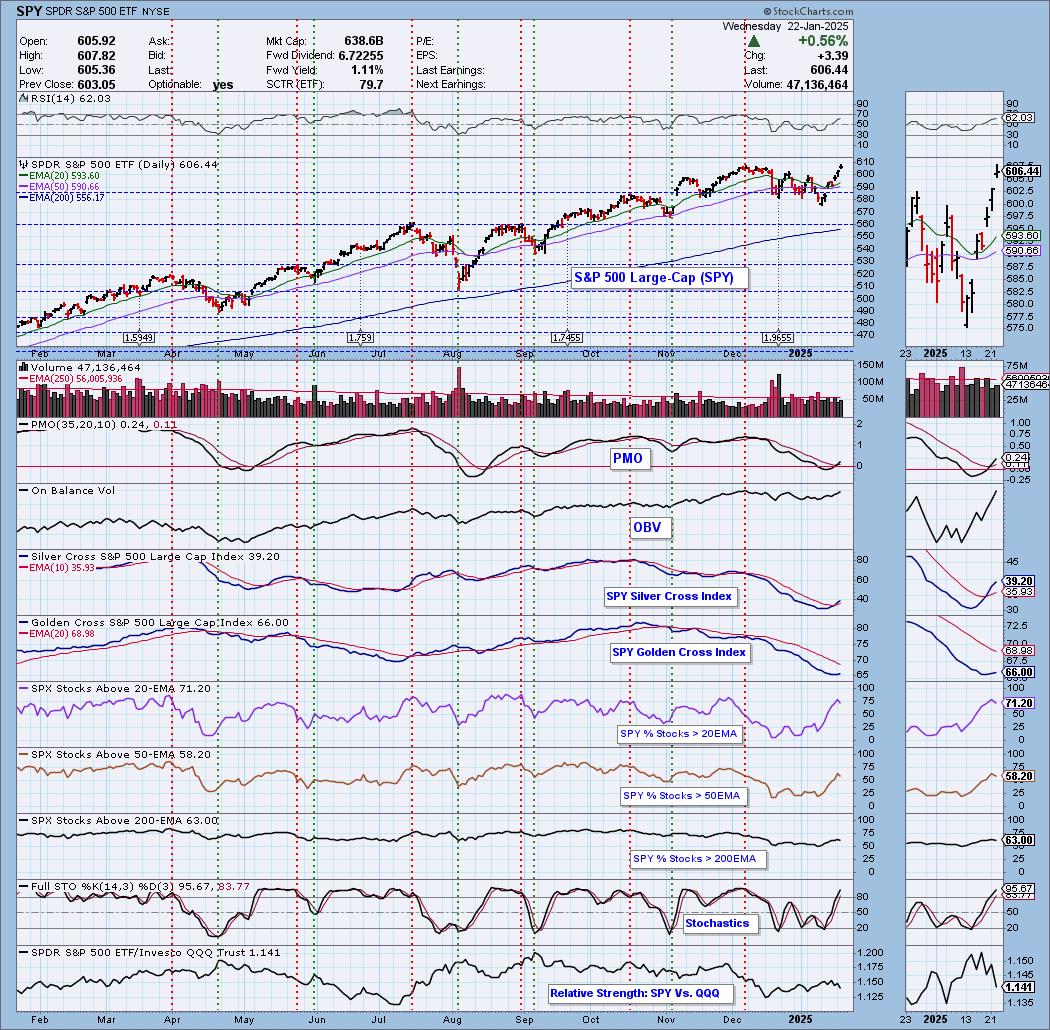
Market Environment: It is important to consider the odds for success by assessing the market tides. The following chart uses different methodologies for objectively showing the depth and trend of participation for intermediate- and long-term time frames.
- The Silver Cross Index (SCI) shows the percentage of SPX stocks on IT Trend Model BUY signals (20-EMA > 50-EMA)
- The Golden Cross Index (GCI) shows the percentage of SPX stocks on LT Trend Model BUY signals (50-EMA > 200-EMA)
Don't forget that as a "Diamonds" member, you have access to our "Under the Hood" curated ChartList on DecisionPoint.com. You'll find it under "Members Only" links on the left side on the Blogs and Links Page.
Here is the current chart:
Full Disclosure: I am 55% long, 0% short.
I'm required to disclose if I currently own a stock I mention and/or may buy/short it within the next 72 hours.
"Technical Analysis is a windsock, not a crystal ball." - Carl Swenlin
(c) Copyright 2025 DecisionPoint.com
Watch the latest episode of DecisionPoint Trading Room with Carl & Erin Swenlin Mondays on the DecisionPoint YouTube channel here!
NOTE: The stocks reported herein are from mechanical trading model scans that are based upon moving average relationships, momentum and volume. DecisionPoint analysis is then applied to get five selections from the scans. The selections given should prompt readers to do a chart review using their own analysis process. This letter is not a call for a specific action to buy, sell or short any of the stocks provided. There are NO sure things or guaranteed returns on the daily selection of "Diamonds in the Rough."
Regarding BUY/SELL Signals: The signal status reported herein is based upon mechanical trading model signals and crossovers. They define the implied bias of the price index/stock based upon moving average relationships and momentum, but they do not necessarily call for a specific action. They are information flags that should prompt chart review. Further, they do not call for continuous buying or selling during the life of the signal. For example, a BUY signal will probably (but not necessarily) return the best results if action is taken soon after the signal is generated. Additional opportunities for buying may be found as price zigzags higher, but the trader must look for optimum entry points. Conversely, exit points to preserve gains (or minimize losses) may be evident before the model mechanically closes the signal.
Helpful DecisionPoint Links:
Price Momentum Oscillator (PMO)
Swenlin Trading Oscillators (STO-B and STO-V)
For more links, go to DecisionPoint.com