
My scans basically came up empty on the long side, with the exception of a Bond Fund. Most Bonds look favorable, but upside potential is generally limited. The one I chose today has decent upside potential and doesn't travel quite as slow as many of the other Bond ETFs.
The other two are shorts that I found doing a visual scan of our ETF Tracker. You can scan our ETF Tracker too now on our website. The third subscriber ChartList is now our selection of ETFs that cover most areas of the market. I had to go on the short side as there really isn't much out there as the market begins to turn over.
I don't like what the market is up to right now so be very careful with exposure levels and stay true to your stops!
Good Luck & Good Trading,
Erin
Today's "Diamonds in the Rough": KRE (Short), XHB (Short) and ZROZ.
** JULY VACATION **
I will be in Europe 7/14 - 7/27 so there will not be any Diamonds reports or trading rooms during that time. All subscribers with active subscriptions on 7/27 will be compensated with two weeks added to their renewal date.

RECORDING LINK (5/26/2023):
Topic: DecisionPoint Diamond Mine (5/26/2023) LIVE Trading Room
Recording Link
Passcode: May#26th
REGISTRATION for 6/2/2023:
When: Jun 2, 2023 09:00 AM Pacific Time (US and Canada)
Topic: DecisionPoint Diamond Mine (6/2/2023) LIVE Trading Room
Register in advance for this webinar HERE
After registering, you will receive a confirmation email containing information about joining the webinar.

Here is the last recording (5/22):
Welcome to DecisionPoint Diamonds, wherein I highlight ten "Diamonds in the Rough" per week. These are selected from the results of my DecisionPoint Scans which search for stocks that could benefit from the trend and condition of the market. Remember, these are not recommendations to buy or sell, but are the most interesting of the stocks that surfaced in my scans. My objective is to save you the work of the initial, tedious culling process, but you need to apply your own analysis to see if these stocks pique your interest as well. There are no guaranteed winners here!
"Predefined Scans Triggered" are taken from StockCharts.com using the "Symbol Summary" option instead of a "SharpChart" on the workbench.
Stop levels are all rounded down.
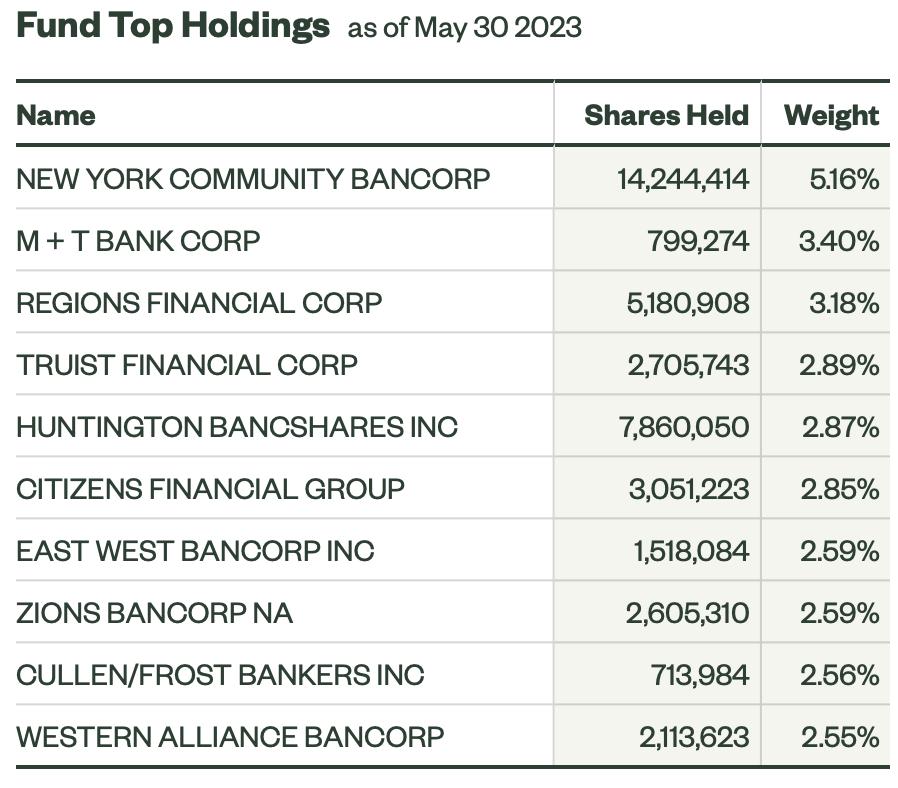
SPDR S&P Regional Banking ETF (KRE)
EARNINGS: N/A
KRE tracks an equal-weighted index of US regional banking stocks. Click HERE for more information.
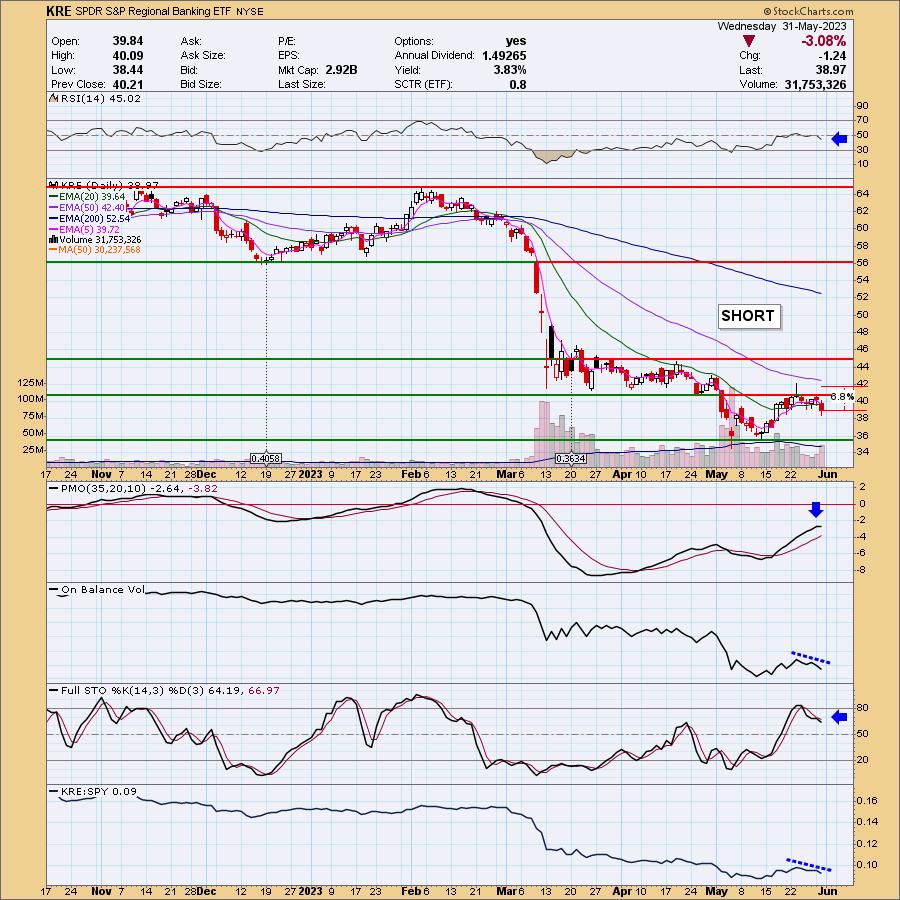
Predefined Scans Triggered: Elder Bar Turned Red, Parabolic SAR Sell Signals and P&F High Pole.
KRE is down -0.31% in after hours trading. KRE made an attempt at a comeback, but it hit overhead resistance and was turned away. The chart has definitely gone south since. The RSI is now negative and the PMO has topped well below the zero line which is especially bearish. The OBV is confirming the downtrend and Stochastics are dropping. Even relative strength has been poor. This looks good for a short with a 6.8% upside stop around $41.62.
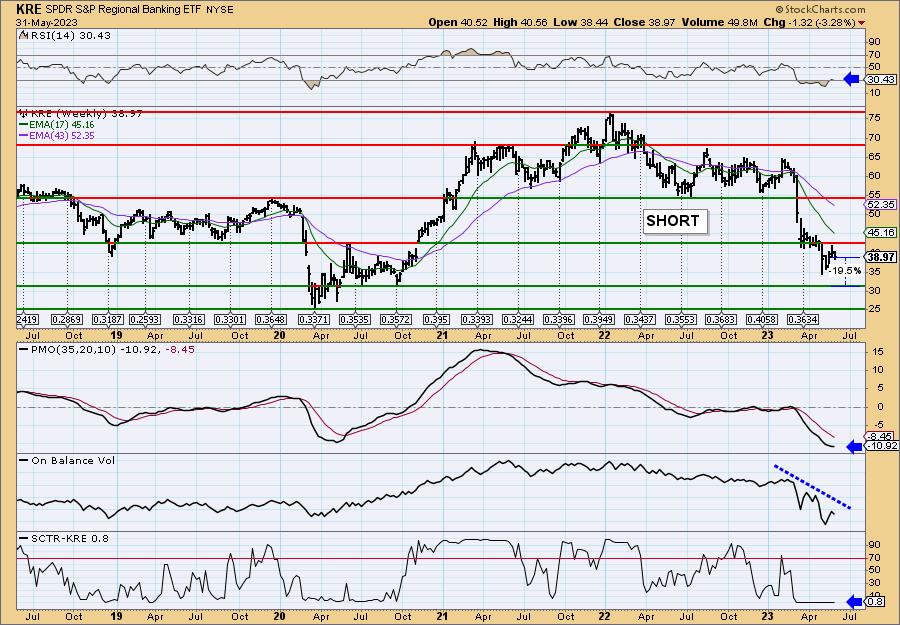
The weekly chart wants to improve, but there are too many negatives here. The RSI is in negative territory and the weekly PMO is still declining. The OBV is definitely confirming the downtrend. The StockCharts Technical Rank (SCTR) is in the basement, far from the "hot zone" above 70*. Downside potential on this short is about 19.5%.
*If a stock is in the "hot zone" above 70, it implies that it is stronger than 70% of its universe (large-, mid-, small-caps and ETFs) primarily in the intermediate to long terms.
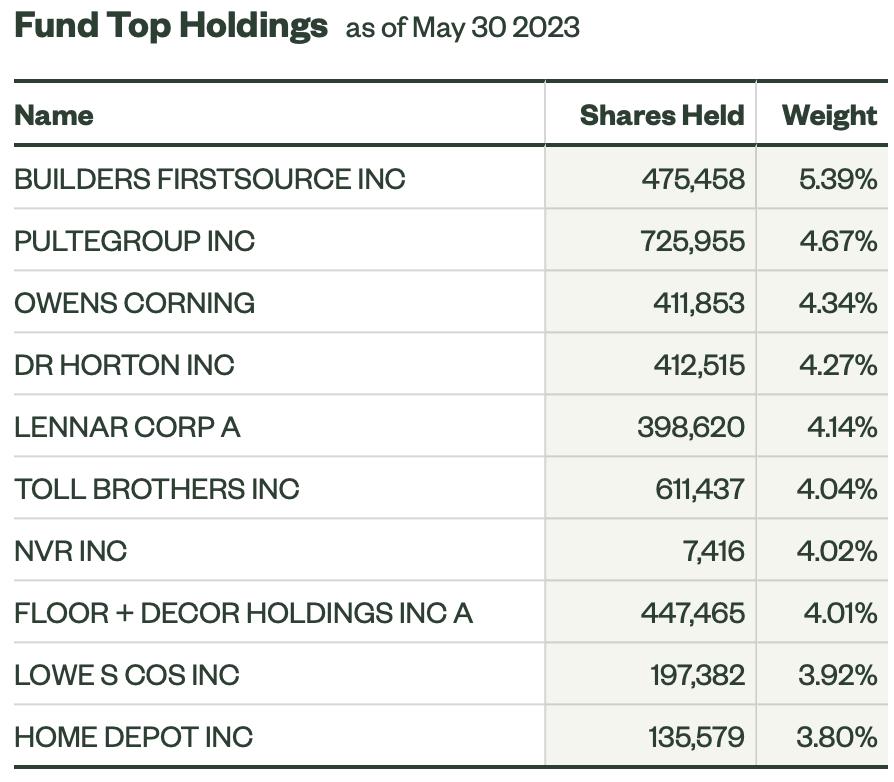
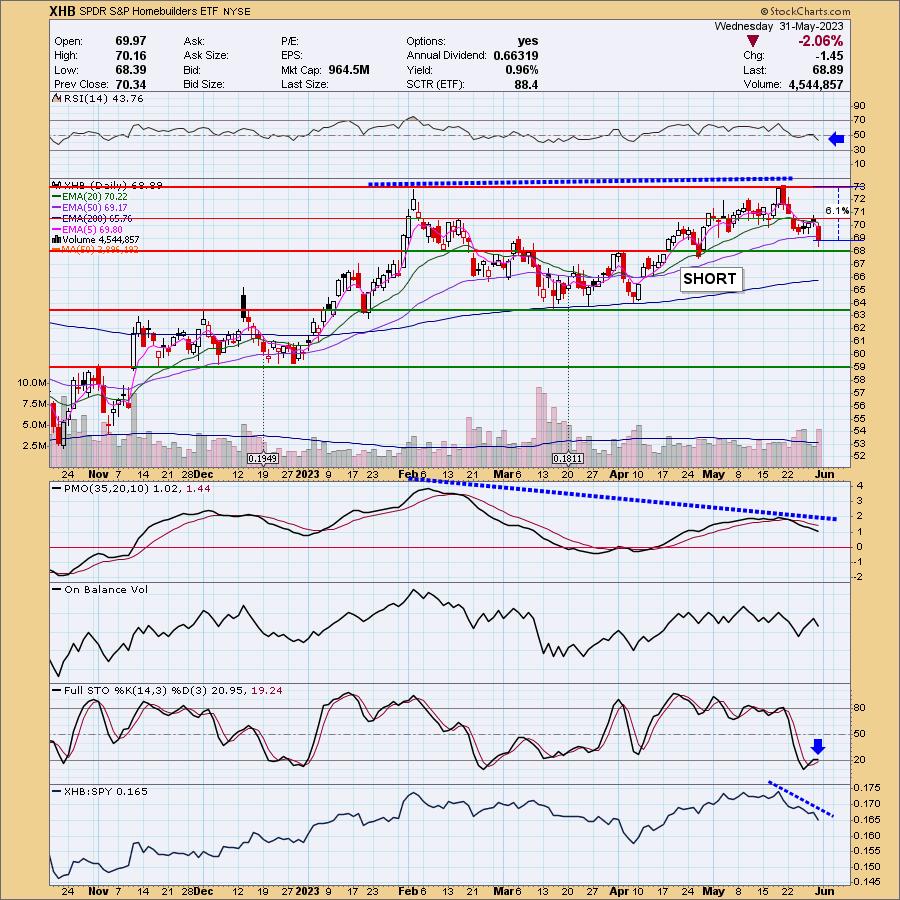
SPDR S&P Homebuilders ETF (XHB)
EARNINGS: N/A
XHB tracks a broad-based, equal-weighted index of US companies involved in the homebuilding industry. Click HERE for more information.
Predefined Scans Triggered: Moved Below Lower Bollinger Band, Moved Below Lower Price Channel, New CCI Sell Signals and Elder Bar Turned Red.
XHB is up +0.16% in after hours trading. Today XHB saw a perilous breakdown. It hasn't quite dropped below strong support yet, but the chart is configured in a way that I do expect it to breakdown in a big way. The RSI is negative and falling. The PMO is on a SELL Signal and has formed a negative divergence with price. Stochastics topped in deeply negative territory. This ETF has been underperforming the SPY. The upside stop is set at about 6.1% or at $73.09.
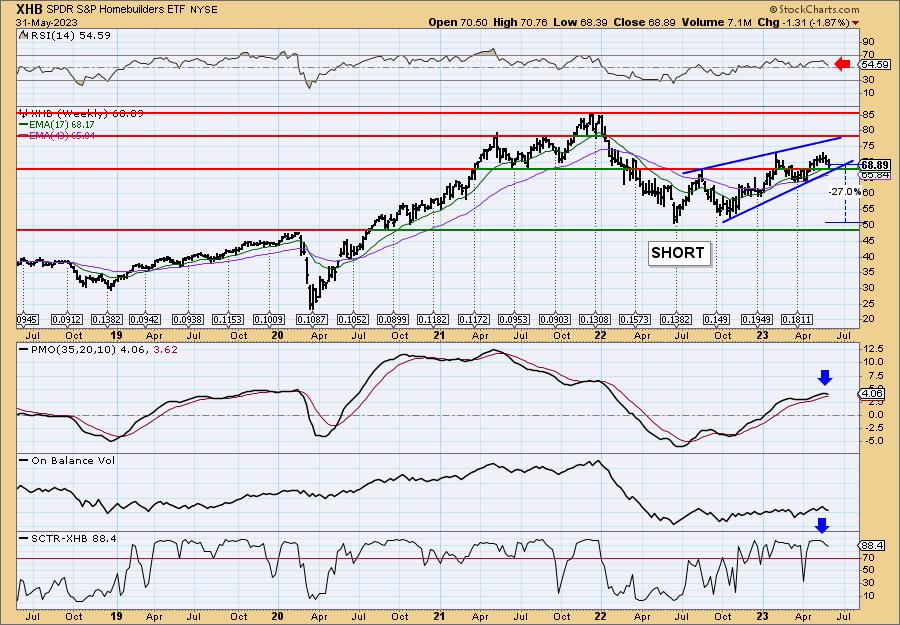
I've annotated a bearish rising wedge on the weekly chart. Notice that price was unable to test the top of the pattern before turning down. This is what we usually see right before the rising wedge is confirmed with a breakdown. The weekly RSI is in positive territory, but is falling. The weekly PMO has topped. The SCTR is still in the hot zone, but it is falling. I've listed a downside target at the 2022 low.
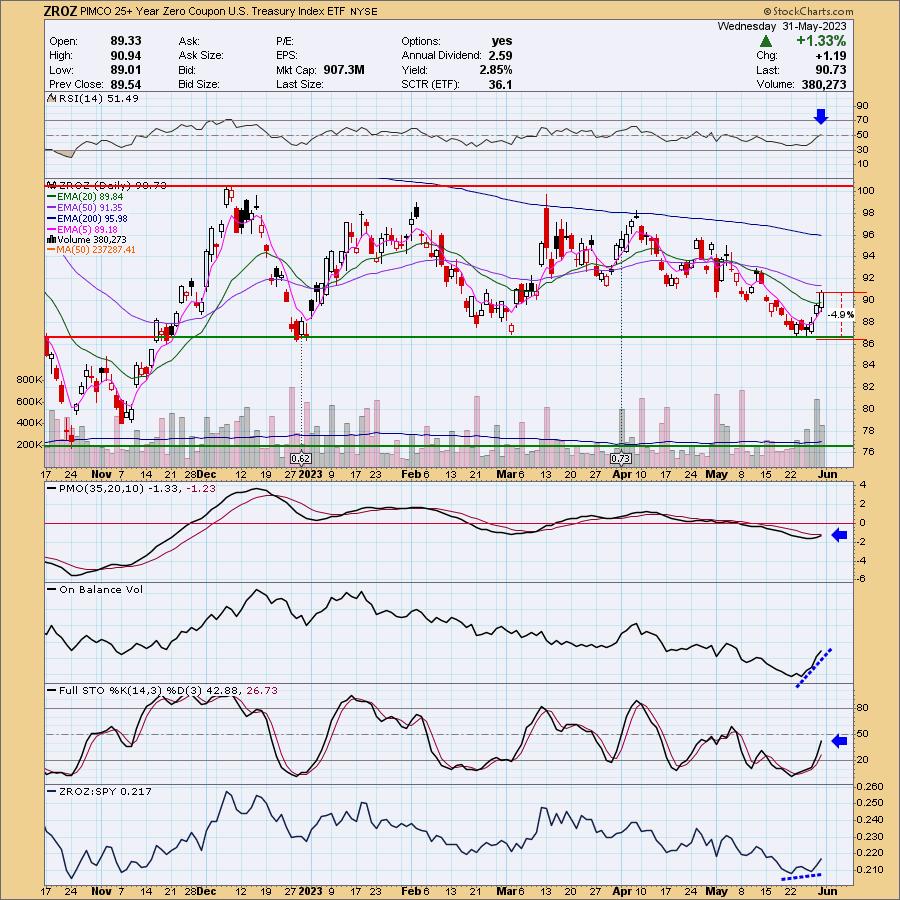
PIMCO 25+ Year Zero Coupon U.S. Treasury Index ETF (ZROZ)
EARNINGS: N/A
ZROZ tracks a market-weighted index comprising separate trading of registered interest and principal of Securities (STRIPs), with a remaining maturity of 25 years+. Click HERE for more information.
Predefined Scans Triggered: Bullish MACD Crossovers and Parabolic SAR Buy Signals.
ZROZ is up +0.23% in after hours trading. Bonds are finding favor as the market begins to turn over. It has been said that the debt ceiling deal would spur Bonds funds higher and so far that is correct. This is a great fund to take advantage as it does tend to move more actively than other funds. The RSI just moved into positive territory. The PMO is nearing a Crossover BUY Signal (it's already had a MACD crossover based on the predefined scan that triggered today). The OBV shows incredible volume coming in on this current rally. Stochastics are rising strongly. It is beginning to outperform the SPY. The stop can be set thinly at 4.9% or $86.28.
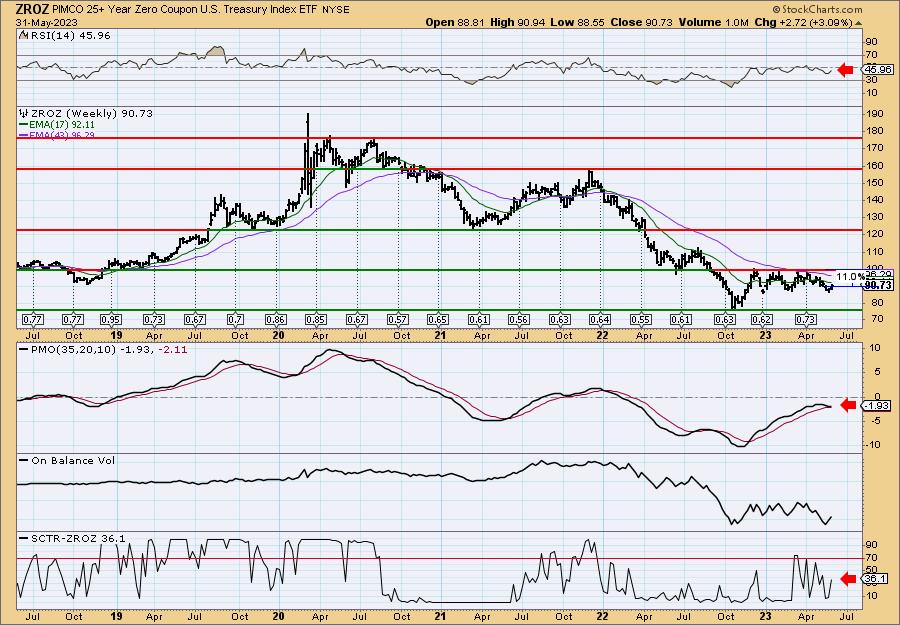
You'll notice immediately that I've set a very low upside target. I believe we will finally see a breakout here, but I also want to temper expectations. I always set my targets at least twice the stop level so even though it is limited, it fits my investing style. The weekly RSI is negative but it is rising again. The PMO is nearing a Crossover SELL Signal, but at the same time it appears it will bottom above the signal line which would be especially bullish. The SCTR is not at all in the hot zone, but it is rising strongly.
Don't forget, on Thursdays I look at reader-requested symbols, click HERE to send me an email. I read every email I receive and try to answer them all!
Current Market Outlook:
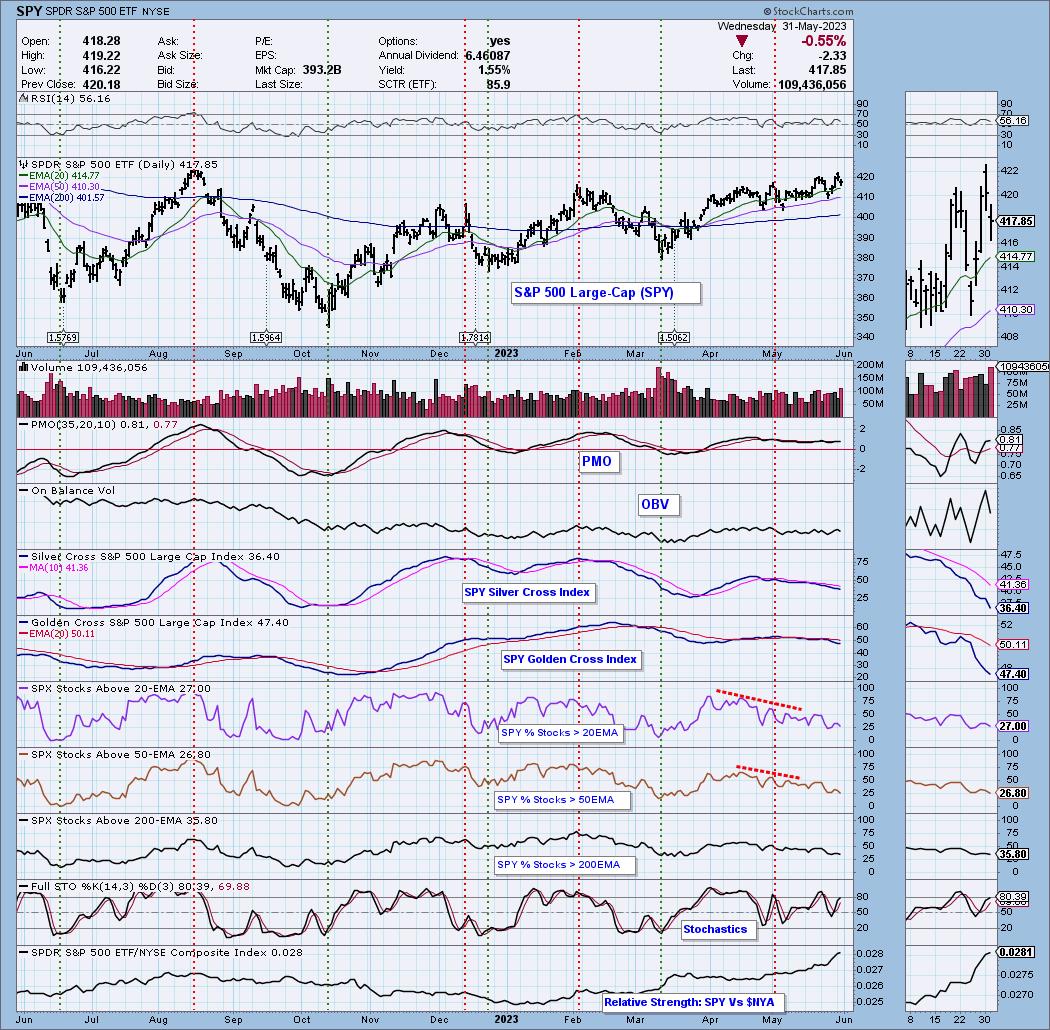
Market Environment: It is important to consider the odds for success by assessing the market tides. The following chart uses different methodologies for objectively showing the depth and trend of participation for intermediate- and long-term time frames.
- The Silver Cross Index (SCI) shows the percentage of SPX stocks on IT Trend Model BUY signals (20-EMA > 50-EMA)
- The Golden Cross Index (GCI) shows the percentage of SPX stocks on LT Trend Model BUY signals (50-EMA > 200-EMA)
Don't forget that as a "Diamonds" member, you have access to our GCI/SCI curated ChartList on DecisionPoint.com. You'll find it under "Members Only" links on the left side on the Blogs and Links Page.
Here is the current chart:
Full Disclosure: I am 10% long, 7% short. Opting to limit exposure for now.
I'm required to disclose if I currently own a stock I mention and/or may buy/short it within the next 72 hours.
"Technical Analysis is a windsock, not a crystal ball." - Carl Swenlin
(c) Copyright 2023 DecisionPoint.com
Watch the latest episode of DecisionPoint Trading Room with Carl & Erin Swenlin on Mondays 7:00p EST or on the DecisionPoint playlist on the StockCharts TV YouTube channel here!
NOTE: The stocks reported herein are from mechanical trading model scans that are based upon moving average relationships, momentum and volume. DecisionPoint analysis is then applied to get five selections from the scans. The selections given should prompt readers to do a chart review using their own analysis process. This letter is not a call for a specific action to buy, sell or short any of the stocks provided. There are NO sure things or guaranteed returns on the daily selection of "Diamonds in the Rough."
Regarding BUY/SELL Signals: The signal status reported herein is based upon mechanical trading model signals and crossovers. They define the implied bias of the price index/stock based upon moving average relationships and momentum, but they do not necessarily call for a specific action. They are information flags that should prompt chart review. Further, they do not call for continuous buying or selling during the life of the signal. For example, a BUY signal will probably (but not necessarily) return the best results if action is taken soon after the signal is generated. Additional opportunities for buying may be found as price zigzags higher, but the trader must look for optimum entry points. Conversely, exit points to preserve gains (or minimize losses) may be evident before the model mechanically closes the signal.
Helpful DecisionPoint Links:
DecisionPoint Shared ChartList and DecisionPoint Chart Gallery
Price Momentum Oscillator (PMO)
Swenlin Trading Oscillators (STO-B and STO-V)
For more links, go to DecisionPoint.comf