
Considering the rally of the past few trading days, I would've expected to see more scan results than I did. I believe it is just one more piece of evidence that the market rally is pointed toward mega-caps.
I read an interesting article that suggested the debt ceiling deal will entice investors out of mega-caps and back into treasuries. If liquidity tightens up, the market will struggle deeply as the mega-caps settle back down. There are no areas of the market showing real leadership.
I decided to include the results from the Surge Scan today so you can see the type of stocks it is coming up with. Two of today's selections came from those results. It's now my favorite scan and seems to pull some great "winners that will keep on winning" type of stocks and stocks that are done with pullbacks. Love it!
Continue to monitor your investments closely and set stops. Carl and I are still quite bearish on the market. It's only a matter of time before we see real devastation. Don't get caught on the wrong side. Personally, my choice is to pare down exposure rather than being invested. It's been a real challenge to do Diamonds as I generally wouldn't be seeking out stocks to invest in during a time like this. Be careful.
Thank you for your understanding in skipping last week's Recap. I'm still healing and quite uncomfortable, but the show must go on!
Good Luck & Good Trading,
Erin
Today's "Diamonds in the Rough": GRMN, SAIA and SAM.
Surge Scan results: ARLO, BCC, CRMT, GRMN, RCL and SAM.
** JULY VACATION **
I will be in Europe 7/14 - 7/27 so there will not be any Diamonds reports or trading rooms during that time. All subscribers with active subscriptions on 7/27 will be compensated with two weeks added to their renewal date.

RECORDING LINK (5/26/2023):
Topic: DecisionPoint Diamond Mine (5/26/2023) LIVE Trading Room
Recording Link
Passcode: May#26th
REGISTRATION for 6/2/2023:
When: Jun 2, 2023 09:00 AM Pacific Time (US and Canada)
Topic: DecisionPoint Diamond Mine (6/2/2023) LIVE Trading Room
Register in advance for this webinar HERE
After registering, you will receive a confirmation email containing information about joining the webinar.

Here is the last recording (5/22):
Welcome to DecisionPoint Diamonds, wherein I highlight ten "Diamonds in the Rough" per week. These are selected from the results of my DecisionPoint Scans which search for stocks that could benefit from the trend and condition of the market. Remember, these are not recommendations to buy or sell, but are the most interesting of the stocks that surfaced in my scans. My objective is to save you the work of the initial, tedious culling process, but you need to apply your own analysis to see if these stocks pique your interest as well. There are no guaranteed winners here!
"Predefined Scans Triggered" are taken from StockCharts.com using the "Symbol Summary" option instead of a "SharpChart" on the workbench.
Stop levels are all rounded down.
Garmin Ltd. (GRMN)
EARNINGS: 08/02/2023 (BMO)
Garmin Ltd. is a holding company, which engages in the provision of navigation, communications and information devices, most of which are enabled by Global Positioning System (GPS) technology. It operates through the following segments: Marine, Outdoor, Fitness, Auto OEM, Consumer Auto, and Aviation. The Marine segment manufactures and offers recreational marine electronics such as cartography, Sounders, Radar, Autopilot Systems and Sailing. The Outdoor segment offers products designed for use in outdoor activities such as Outdoor Handhelds, Adventure Watches, Golf Devices, Dog Tracking & Training Device, Garmin Connect & Garmin Connect Mobile, and Connect IQ. The Fitness segment refers to the products designed for use in fitness and activity tracking such as Running & Multi-Sport Watches, Cycling Computers, Power Meters, Safety & Awareness, and Activity Tracking Devices. The Auto OEM and Consumer Auto segments offer products designed for use in the auto market such as Personal Navigation Devices, Original Equipment Manufacturer (OEM) Solutions, and Cameras. The Aviation segment provides solutions to aircraft manufacturers, existing aircraft owners and operators, as well as government/defense customers. The company was founded in 1989 and is headquartered in Schaffhausen, Switzerland.
Predefined Scans Triggered: Elder Bar Turned Green, New CCI Buy Signals, Parabolic SAR Buy Signals and P&F Double Top Breakout.
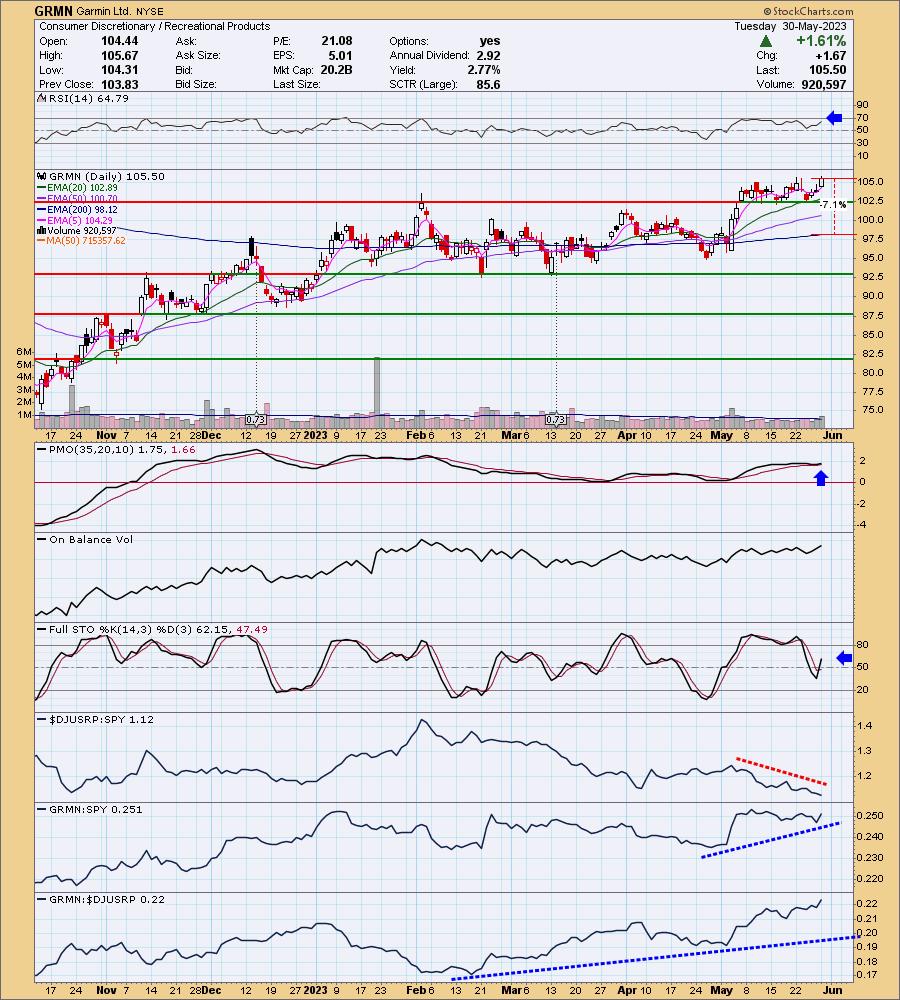
GRMN is unchanged in after hours trading. This Surge Scan stock has a nice breakout today after consolidating a prior strong rally out of a longer-term trading range. This trading range didn't last long which also suggests a bullish bias. The RSI is positive and Stochastics have started rising vertically. The one detractor on the chart is that the Recreational Products industry group is suffering. Garmin, however, is a very strong performer against this ailing group and consequently the SPY. I've set the stop at the 200-day EMA around 7.1% or $98.00.
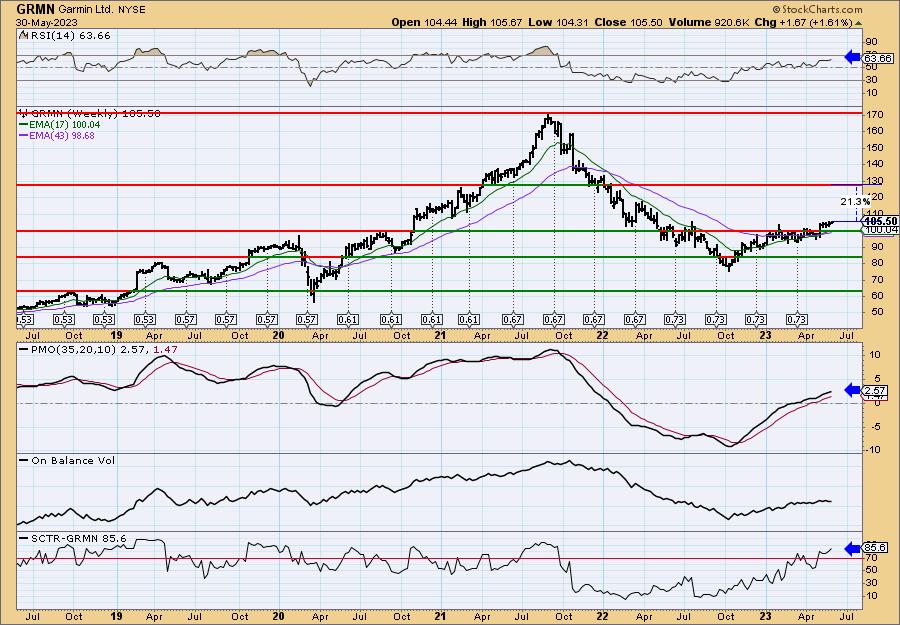
The weekly PMO is rising and is not yet overbought. The weekly RSI has been positive all year long without getting overbought. The SCTR is well within the "hot zone" above 70*. Upside potential is around $130.
*If a stock is in the "hot zone" above 70, it implies that it is stronger than 70% of its universe (large-, mid-, small-caps and ETFs) primarily in the intermediate to long terms.
SAIA Inc. (SAIA)
EARNINGS: 07/27/2023 (BMO)
Saia, Inc. operates as a transportation holding company. The firm through its wholly-owned subsidiaries provides regional and interregional less-than-truckload (LTL) services through a single integrated organization. The firm also offers other value-added services, including non-asset truckload, expedited and logistics services across North America. The company was founded by Louis Saia, Sr. in 1924 and is headquartered in Johns Creek, GA.
Predefined Scans Triggered: P&F Double Top Breakout and P&F Bearish Signal Reversal.
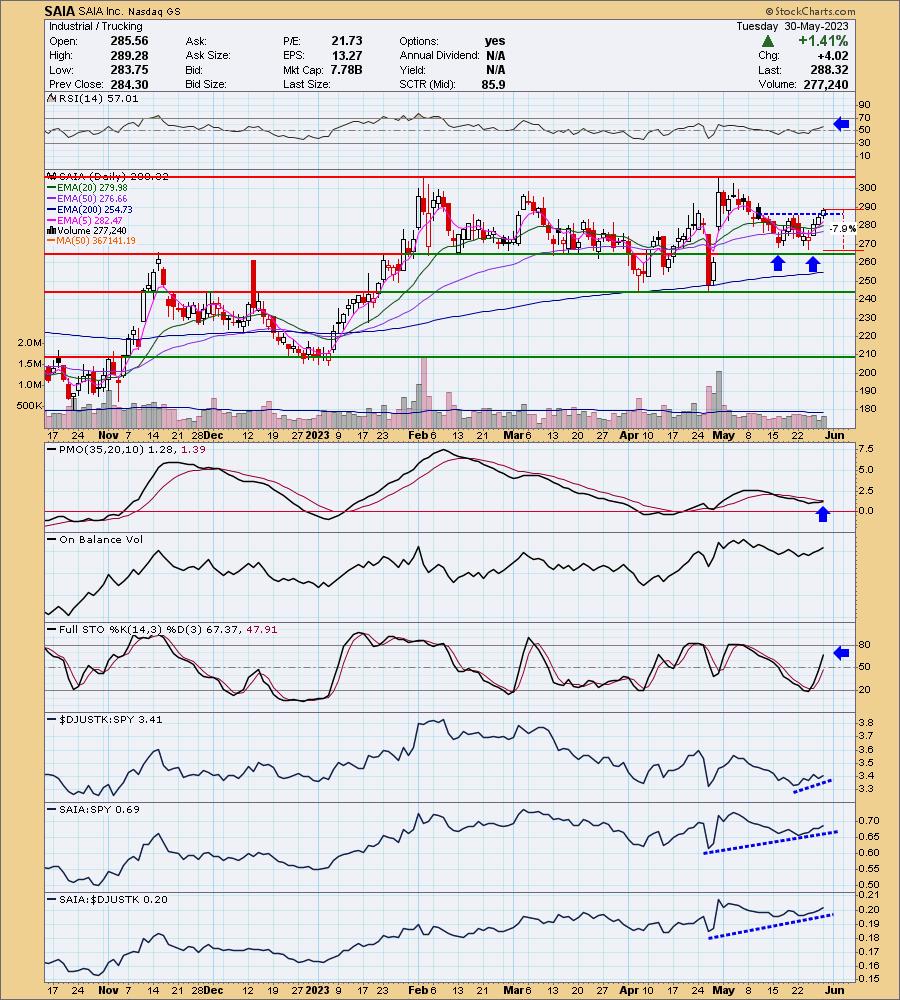
SAIA is unchanged in after hours trading. This has a nice little double-bottom that was confirmed with today's breakout above the confirmation line. It has been range bound for some time, but this is a nice set up with indicators configured bullishly. The RSI is in positive territory and rising. The PMO is nearing a Crossover BUY Signal. Stochastics are rising strongly in positive territory. The group is starting to see some outperformance. This stock appears to be one of the strongest in the group based on its relative strength. While I'm not enamored of the Trucking group, this one should see some upside. The stop is a bit deep but needs to be set below the double-bottom pattern at 7.9% or $265.54.
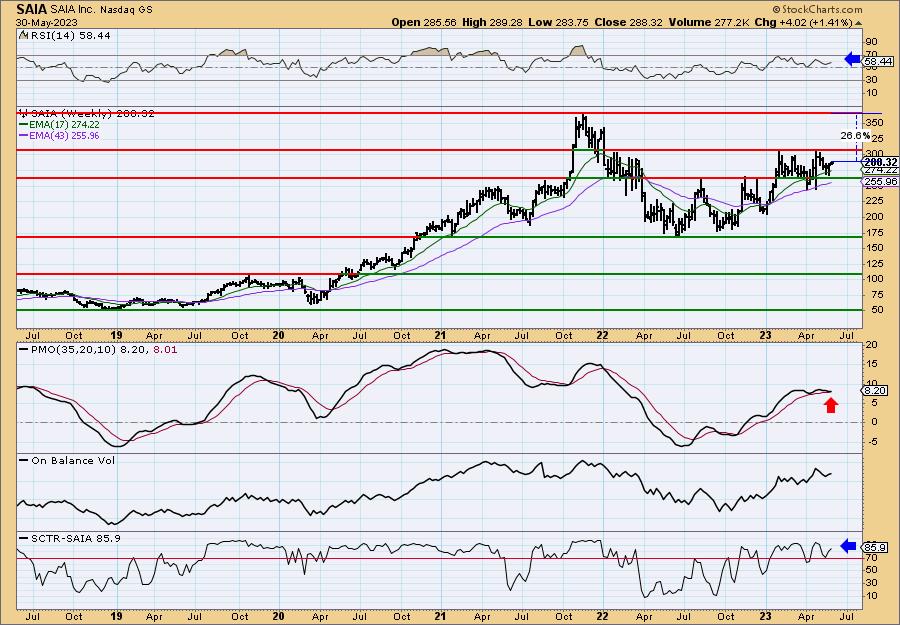
There is a larger double/triple bottom pattern on the weekly chart. If the pattern fulfills the minimum upside target, expect an over 25% gain. The weekly PMO looked like it may be surging but it is technically still falling. It did flatten out greatly. The weekly RSI is very positive and the SCTR is in the hot zone above 70.
Boston Beer Co. Cl A (SAM)
EARNINGS: 07/27/2023 (AMC)
Boston Beer Co., Inc. engages in the production of alcoholic beverages. Its brands include Truly Hard Seltzer, Twisted Tea, Samuel Adams, Angry Orchard, Hard Cider and Dogfish Head Craft Brewery. Boston Beer produces alcohol beverages, including hard seltzer, malt beverages ("beers"), and hard cider at company-owned breweries and its cidery, and under contract arrangements at other brewery locations. The company was founded by C. James Koch in 1984 and is headquartered in Boston, MA.
Predefined Scans Triggered: Elder Bar Turned Green, New CCI Buy Signals, Stocks in a New Uptrend (Aroon), Entered Ichimoku Cloud and P&F Double Top Breakout.
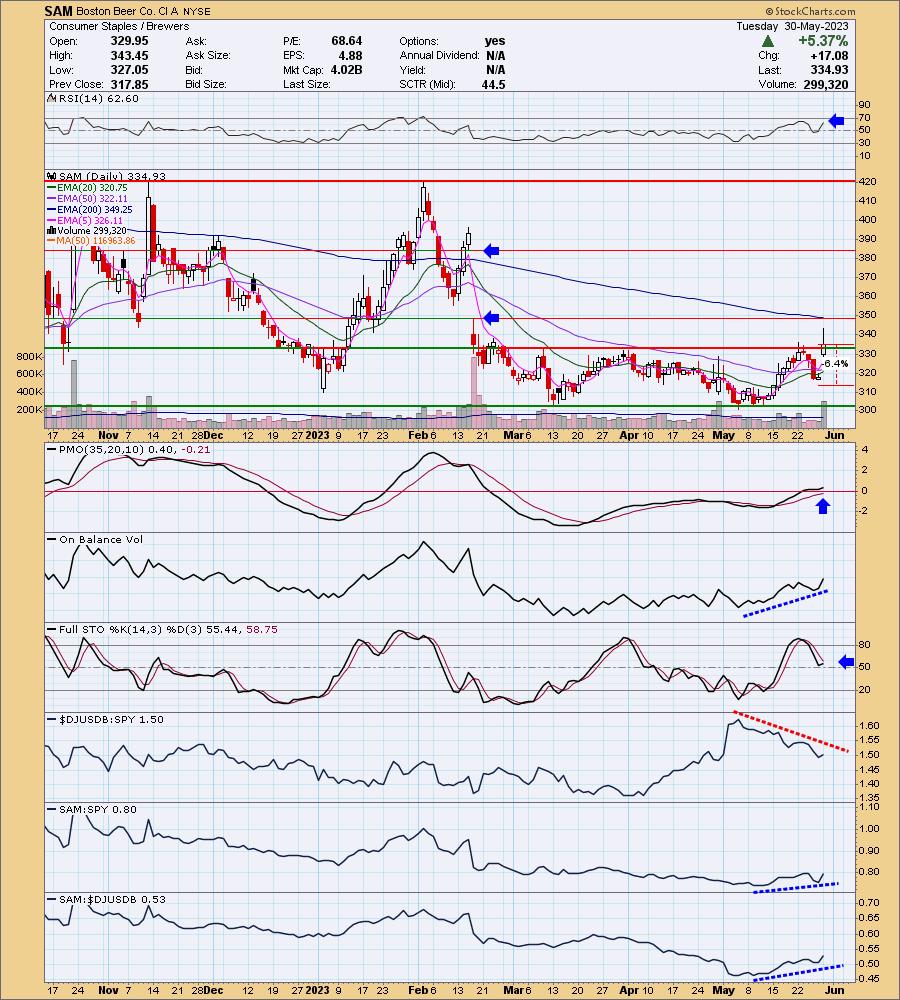
SAM is up +1.22% in after hours trading so we're onto something here. I would expect a bit of a pullback given the strong gap up move, but this also has the earmarks of a breakaway gap. The breakaway came on very high volume and took price out of a longer-term trading range. I've marked where price will come up against gap resistance from the February gap down. That could pose some problems, but this is a very favorable move. The RSI is positive and rising/not overbought. The PMO has surged above its signal line and Stochastics were stopped in their tracks and have ticked up. The industry group is suffering, but some of that is probably attributed to Budweiser which is declining quickly. SAM is a clear leader within the group and consequently it is beginning to outperform the SPY. The stop is set below support at 6.4% or $313.49.
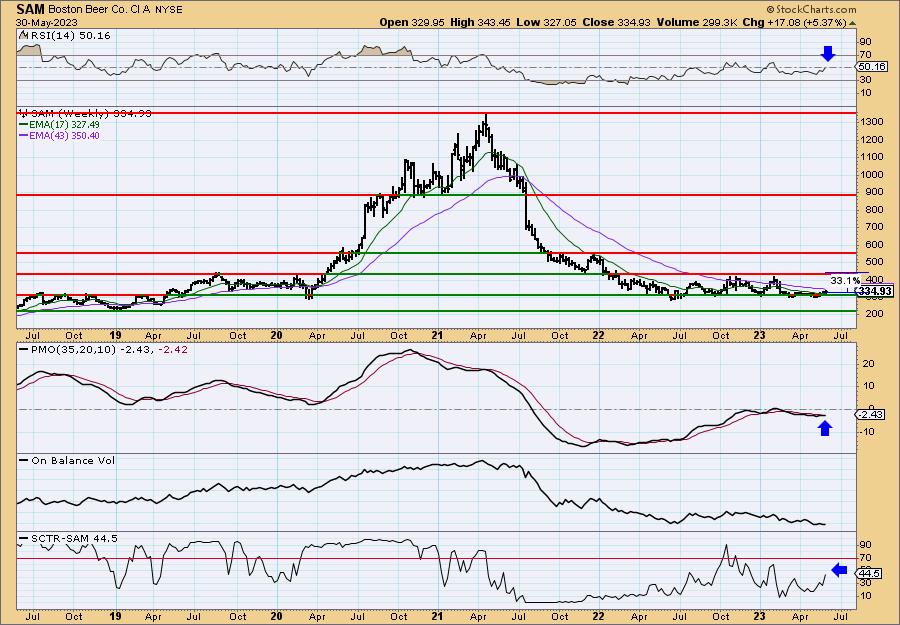
The set up on the weekly chart is enticing. It has been in a long-term trading range since early 2022. Price is currently near the bottom of the range. The weekly RSI just entered positive territory and the weekly PMO is only one one-hundredth away from the signal line so a Crossover BUY Signal is highly likely. The SCTR, while not in the hot zone, is rising strongly. Upside potential to the top of the trading range is over 30%.
Don't forget, on Thursdays I look at reader-requested symbols, click HERE to send me an email. I read every email I receive and try to answer them all!
Current Market Outlook:
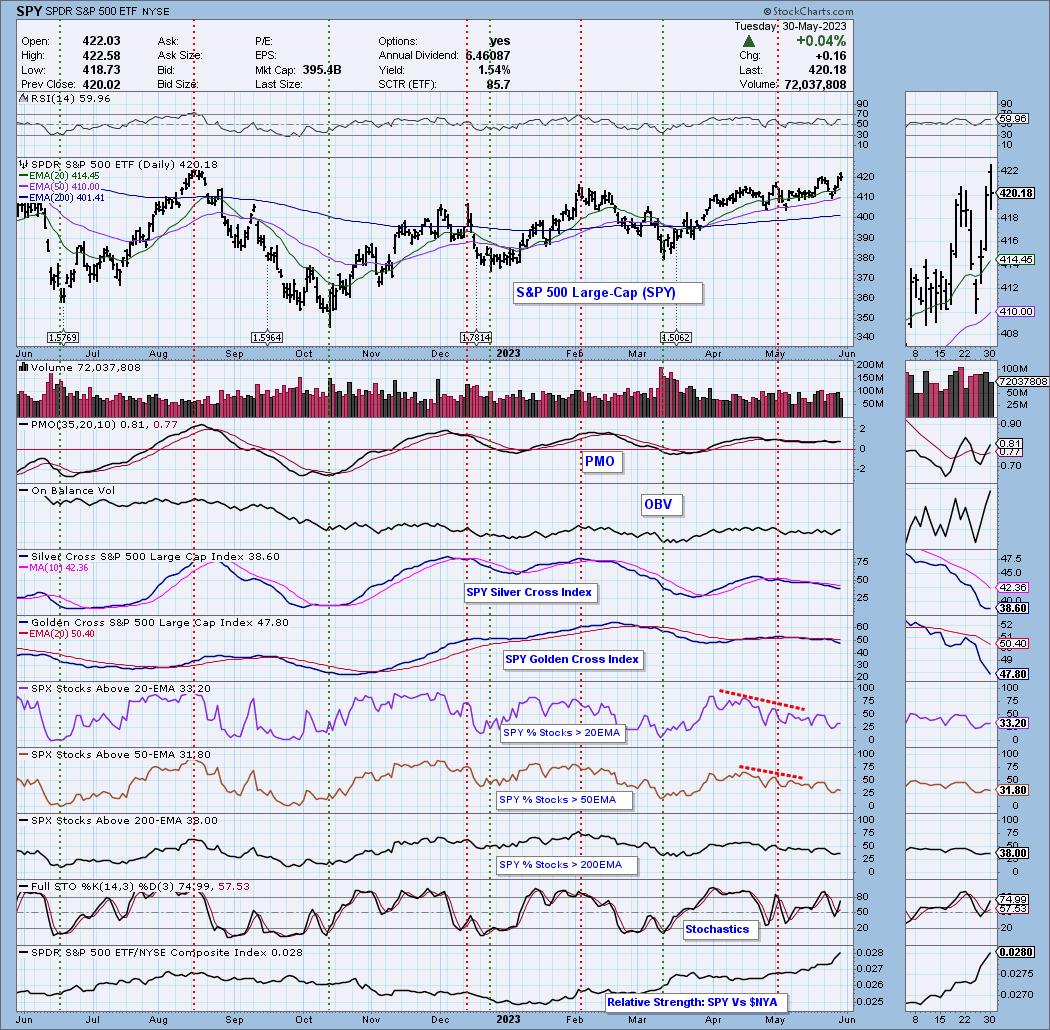
Market Environment: It is important to consider the odds for success by assessing the market tides. The following chart uses different methodologies for objectively showing the depth and trend of participation for intermediate- and long-term time frames.
- The Silver Cross Index (SCI) shows the percentage of SPX stocks on IT Trend Model BUY signals (20-EMA > 50-EMA)
- The Golden Cross Index (GCI) shows the percentage of SPX stocks on LT Trend Model BUY signals (50-EMA > 200-EMA)
Don't forget that as a "Diamonds" member, you have access to our GCI/SCI curated ChartList on DecisionPoint.com. You'll find it under "Members Only" links on the left side on the Blogs and Links Page.
Here is the current chart:
Full Disclosure: I am 14% long, 7% short. I may add one of these shorts.
I'm required to disclose if I currently own a stock I mention and/or may buy/short it within the next 72 hours.
"Technical Analysis is a windsock, not a crystal ball." - Carl Swenlin
(c) Copyright 2023 DecisionPoint.com
Watch the latest episode of DecisionPoint Trading Room with Carl & Erin Swenlin on Mondays 7:00p EST or on the DecisionPoint playlist on the StockCharts TV YouTube channel here!
NOTE: The stocks reported herein are from mechanical trading model scans that are based upon moving average relationships, momentum and volume. DecisionPoint analysis is then applied to get five selections from the scans. The selections given should prompt readers to do a chart review using their own analysis process. This letter is not a call for a specific action to buy, sell or short any of the stocks provided. There are NO sure things or guaranteed returns on the daily selection of "Diamonds in the Rough."
Regarding BUY/SELL Signals: The signal status reported herein is based upon mechanical trading model signals and crossovers. They define the implied bias of the price index/stock based upon moving average relationships and momentum, but they do not necessarily call for a specific action. They are information flags that should prompt chart review. Further, they do not call for continuous buying or selling during the life of the signal. For example, a BUY signal will probably (but not necessarily) return the best results if action is taken soon after the signal is generated. Additional opportunities for buying may be found as price zigzags higher, but the trader must look for optimum entry points. Conversely, exit points to preserve gains (or minimize losses) may be evident before the model mechanically closes the signal.
Helpful DecisionPoint Links:
DecisionPoint Shared ChartList and DecisionPoint Chart Gallery
Price Momentum Oscillator (PMO)
Swenlin Trading Oscillators (STO-B and STO-V)
For more links, go to DecisionPoint.comf