
The market had a stellar day driven by economic data that hints Fed tightening may be loosened. It's likely wishful thinking. The response today for Reader Requests was again very light. For good reason, while the market may be moving higher, it is confined to a small group of stocks based on our participation indicators.
Yesterday's shorts were pounded on today's rally, but I remain in the bear camp at least until participation builds back up. It is wise to limit exposure when the market goes back into roller coaster mode after stagnating for awhile. I have not added shorts, nor have I added longs. This strategy has been frustrating to say the least, but it keeps me off the rollercoaster. I would continue to play defense and if you do add, set stops.
While I am presenting all four readers' choices, I want to add that while listed as "Diamonds in the Rough", I'm not advocating adding at this time. The fact that requests are coming in light and my scans aren't producing tells me there are still problems that have to be worked out. In the meantime, we have an opportunity to learn.
Don't forget to sign up for the Diamond Mine trading room tomorrow! It will likely be an exciting day in the market as we see if we get follow-through.
Good Luck & Good Trading,
Erin
Today's "Diamonds in the Rough": CGAU, ENVX, LSPD and UPST.
** JULY VACATION **
I will be in Europe 7/14 - 7/27 so there will not be any Diamonds reports or trading rooms during that time. All subscribers with active subscriptions on 7/27 will be compensated with two weeks added to their renewal date.

RECORDING LINK (5/26/2023):
Topic: DecisionPoint Diamond Mine (5/26/2023) LIVE Trading Room
Recording Link
Passcode: May#26th
REGISTRATION for 6/2/2023:
When: Jun 2, 2023 09:00 AM Pacific Time (US and Canada)
Topic: DecisionPoint Diamond Mine (6/2/2023) LIVE Trading Room
Register in advance for this webinar HERE
After registering, you will receive a confirmation email containing information about joining the webinar.

Here is the last recording (5/22):
Welcome to DecisionPoint Diamonds, wherein I highlight ten "Diamonds in the Rough" per week. These are selected from the results of my DecisionPoint Scans which search for stocks that could benefit from the trend and condition of the market. Remember, these are not recommendations to buy or sell, but are the most interesting of the stocks that surfaced in my scans. My objective is to save you the work of the initial, tedious culling process, but you need to apply your own analysis to see if these stocks pique your interest as well. There are no guaranteed winners here!
"Predefined Scans Triggered" are taken from StockCharts.com using the "Symbol Summary" option instead of a "SharpChart" on the workbench.
Stop levels are all rounded down.
Centerra Gold Inc. (CGAU)
EARNINGS: N/A
Centerra Gold, Inc. engages in the operation, development, exploration and acquisition of gold and copper properties. It operates through the following segments: Kumtor and Mount Milligan. The company was founded on November 7, 2002 and is headquartered in Toronto, Canada.
Predefined Scans Triggered: P&F High Pole.
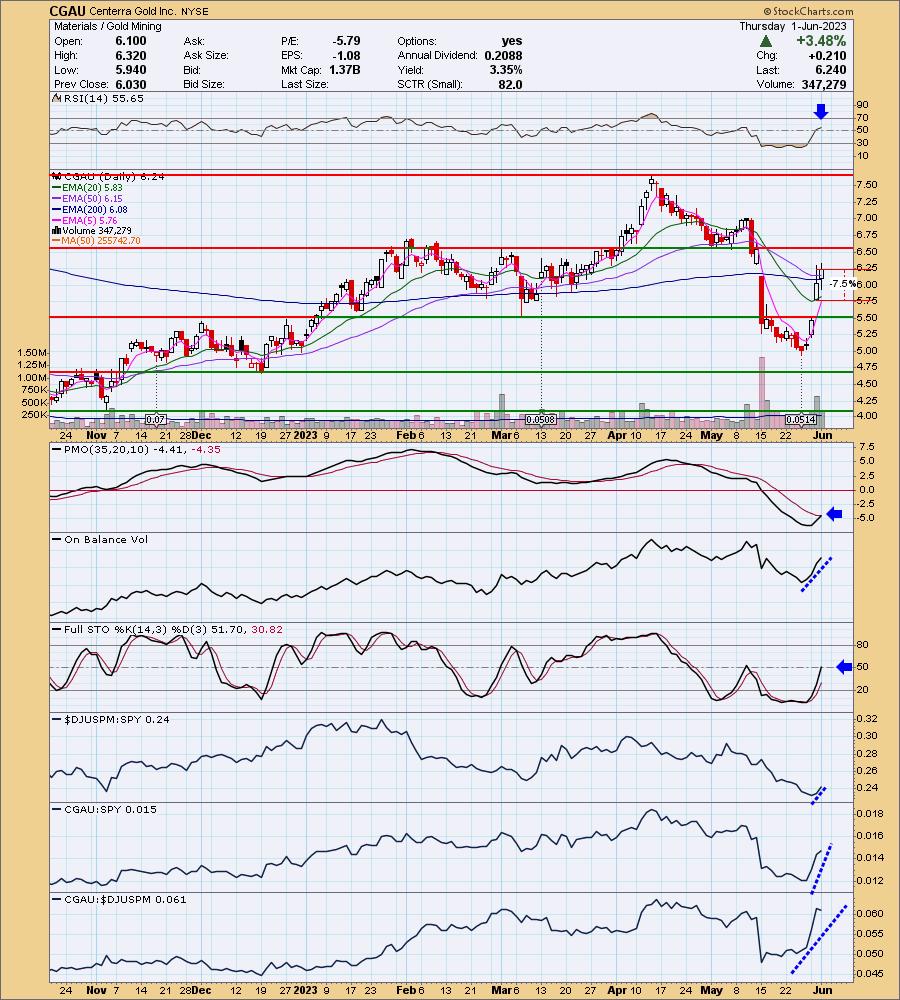
CGAU is unchanged in after hours trading. Gold Miners still look quite weak based on participation of stocks above the 20/50/200-day EMAs. It's a great reversal point, but I'd be very careful. At least this one does appear to be a leader within the group of late. The RSI moved into positive territory this week on this strong rally. Price overcame resistance along all three key moving averages. The gap from mid-May was covered which usually means you'll see some follow-through. The Price Momentum Oscillator (PMO) is about to trigger a Crossover BUY Signal. The OBV is confirming the rally and Stochastics are now rising above 50. Relative strength is trying to get picked up by the group. CGAU's rally put it well into the lead among the group and it now is outperforming the SPY. Due to the large rally, I set the stop deeper than I'd like, but it is set at 7.5% or $5.77 below the 20-day EMA and into the breakaway gap. This is a low-priced stock so position size wisely.
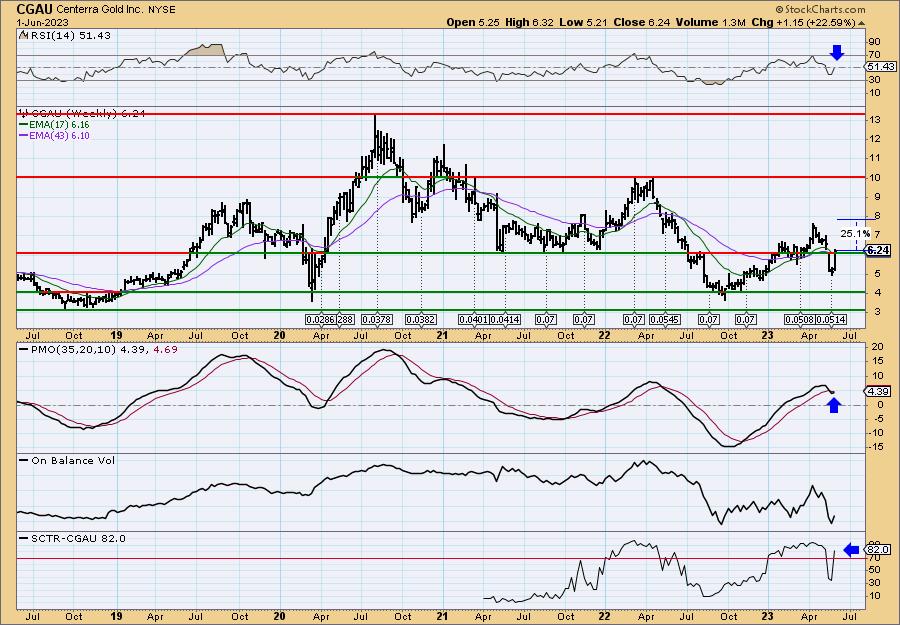
Price is now trying to recapture the prior rising trend, but hasn't quite done so. The weekly RSI is now in positive territory and I like the look of the weekly PMO which has turned back up in anticipation of a Crossover BUY Signal. The StockCharts Technical Rank (SCTR) is comfortably within the "hot zone" above 70*. If it can return to its last high, that would be an over 25% gain.
*If a stock is in the "hot zone" above 70, it implies that it is stronger than 70% of its universe (large-, mid-, small-caps and ETFs) primarily in the intermediate to long terms.
Enovix Corporation (ENVX)
EARNINGS: 07/26/2023 (AMC)
Enovix Corp. engages in the design and development of silicon-anode lithium-ion batteries. The firm's proprietary 3D cell architecture increases energy density and maintains a high cycle life. It is also developing its 3D cell technology and production process for the electric vehicle and energy storage markets to help enable utilization of renewable energy. The company was founded by Mr. Harrold Jones Rust, III, Ashok Lahiri, and Murali Ramasubramanian in November 2006 and is headquartered in Fremont, CA.
Predefined Scans Triggered: Moved Above Upper Keltner Channel, Moved Above Upper Bollinger Band, Stocks in a New Uptrend (Aroon), Moved Above Upper Price Channel and P&F Double Top Breakout.
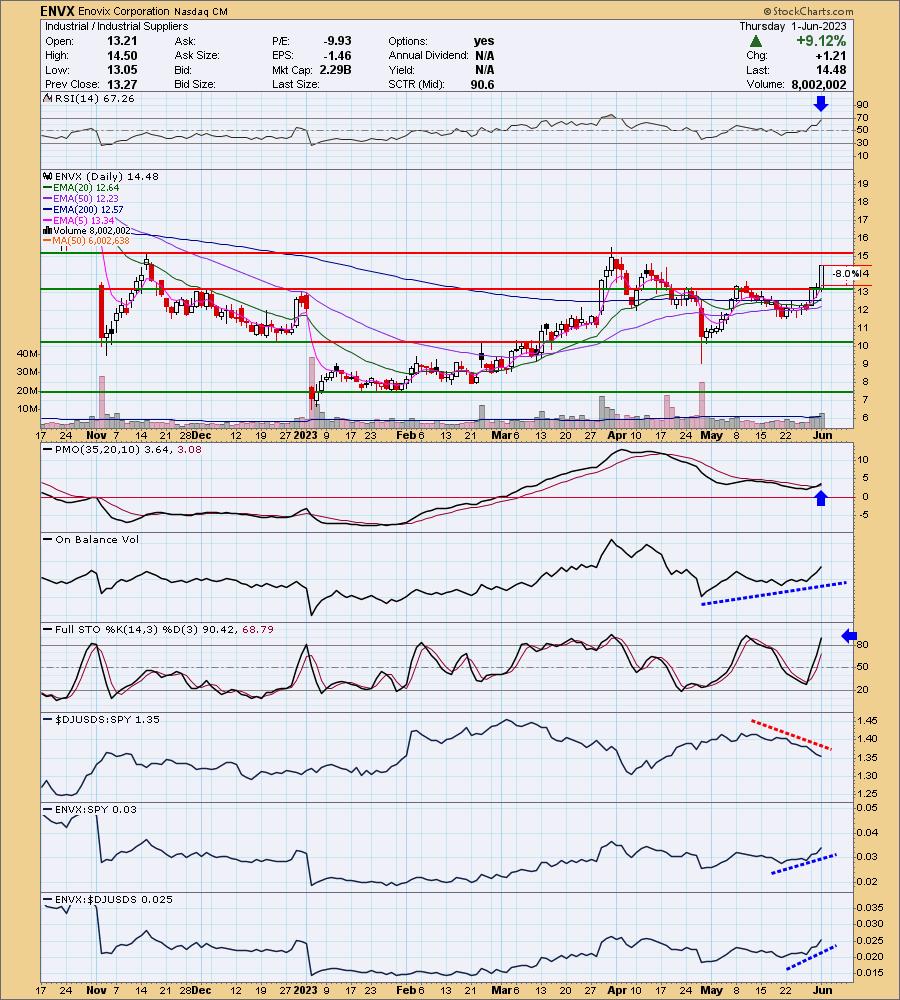
ENVX is down -0.83% in after hours trading. It could be taking some of today's giant rally back. If it does so, it will offer a better entry and stop level. Price is getting close to overhead resistance which could pose a problem or at least a pause. Indicators are healthy with the RSI rising in positive territory and not quite overbought. There is a new PMO Crossover BUY Signal and the OBV is confirming the rising trend. Stochastics are above 80. The group has been underperforming the SPY, but it hasn't stopped ENVIX from outperforming it. The stop is set at 8% or $13.32. It had to be deep, but I'd like to have set it below $13 so if you get in at a lower price, I'd adjust it to $12.98.
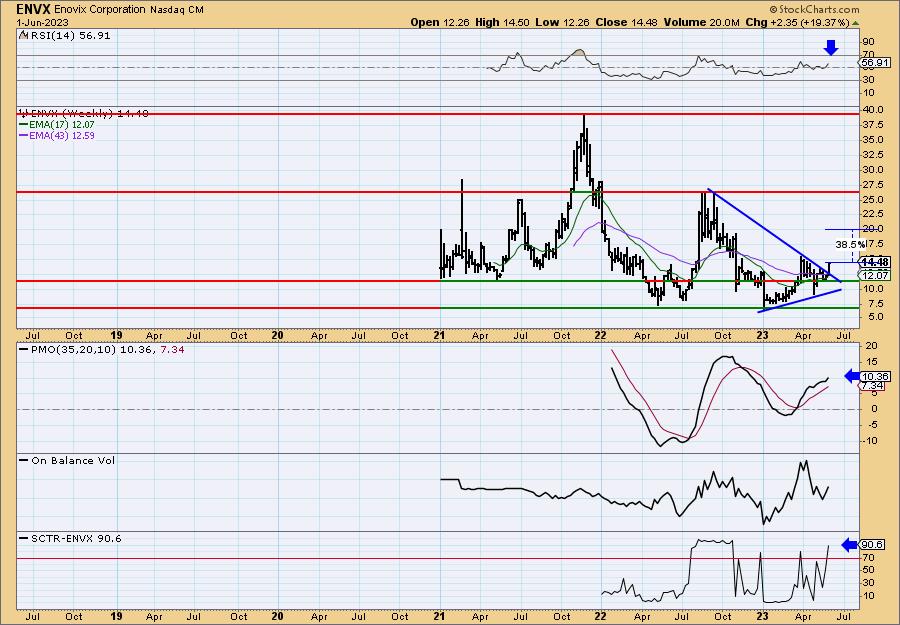
The breakout is quite impressive on the weekly chart, confirming a bullish symmetrical triangle (prior trend in summer 2022 was up). The weekly RSI is positive and rising and the weekly PMO is rising and not overbought. The SCTR is well within the hot zone above 70. I've set the upside target about halfway up toward the next level of overhead resistance. It also matches with the first weekly high of trading.
Lightspeed POS, Inc. (LSPD)
EARNINGS: N/A
Lightspeed Commerce, Inc. provides point-of-sale software for retailers and restaurants. It offers workflow analysis, training, configuration, networking, and business services. The company was founded by Dax Dasilva on March 21, 2005 and is headquartered in Montreal, Canada.
Predefined Scans Triggered: Bullish MACD Crossovers, Parabolic SAR Buy Signals and Entered Ichimoku Cloud.
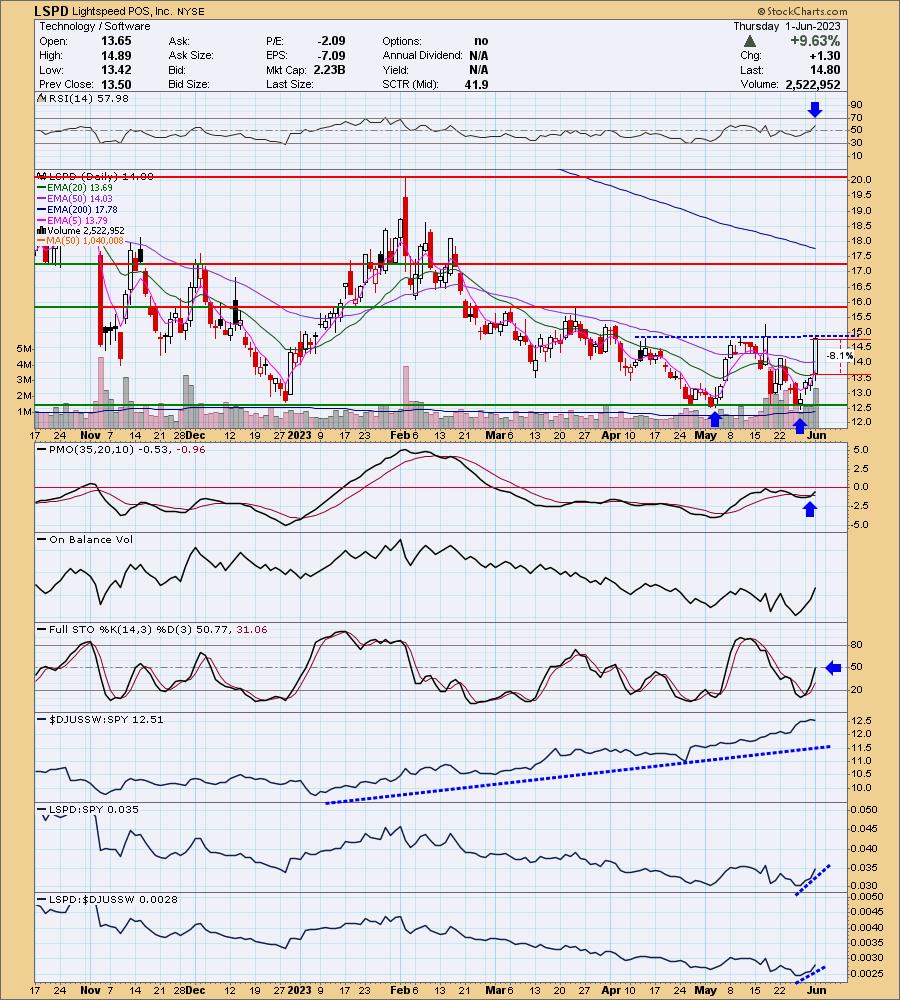
LSPD is down -0.14% in after hours trading. I spotted a bullish double-bottom pattern. Price hasn't confirmed the pattern with a breakout yet, but it looks encouraging. The RSI is positive, rising and not overbought. There is a new PMO Crossover BUY Signal and Stochastics just entered positive territory. Relative strength looks good across the board. I've set the stop deeply again because of the big rally LSPD saw today. It matches up relatively well with the 20-day EMA. If you get in at a lower level, you can push the stop a bit lower. I have it set at 8.1% or $13.60.
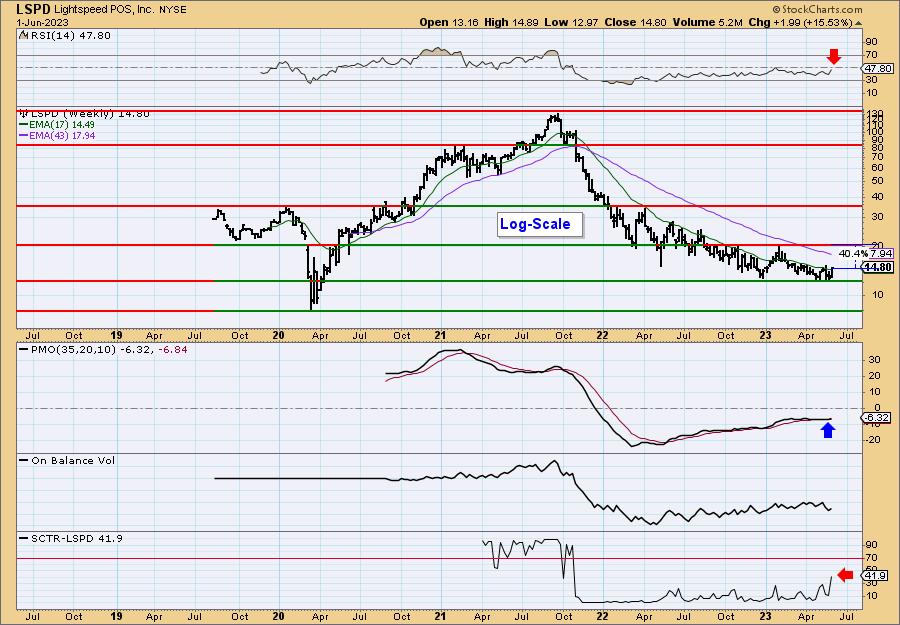
The weekly chart needs work so consider this one a short-term trade. The weekly RSI is negative, although rising. The weekly PMO is on a Crossover BUY Signal which is good. The SCTR is outside the hot zone above 70, but it is rising. If price can reach the 2023 high, it would be an over 40% gain.
Upstart Holdings Inc. (UPST)
EARNINGS: 08/08/2023 (AMC)
Upstart Holdings, Inc. engages in the provision of a cloud-based artificial intelligence lending platform. Its platform aggregates consumer demand for loans and connects it to the company's network of artificial intelligence-enabled bank partners. The company was founded by David Joseph Girouard, Anna Mongayt Counselman and Paul Gu in December 2013 and is headquartered in San Mateo, CA.
Predefined Scans Triggered: Elder Bar turned Green, Moved Above Upper Keltner Channel and P&F Double Top Breakout.
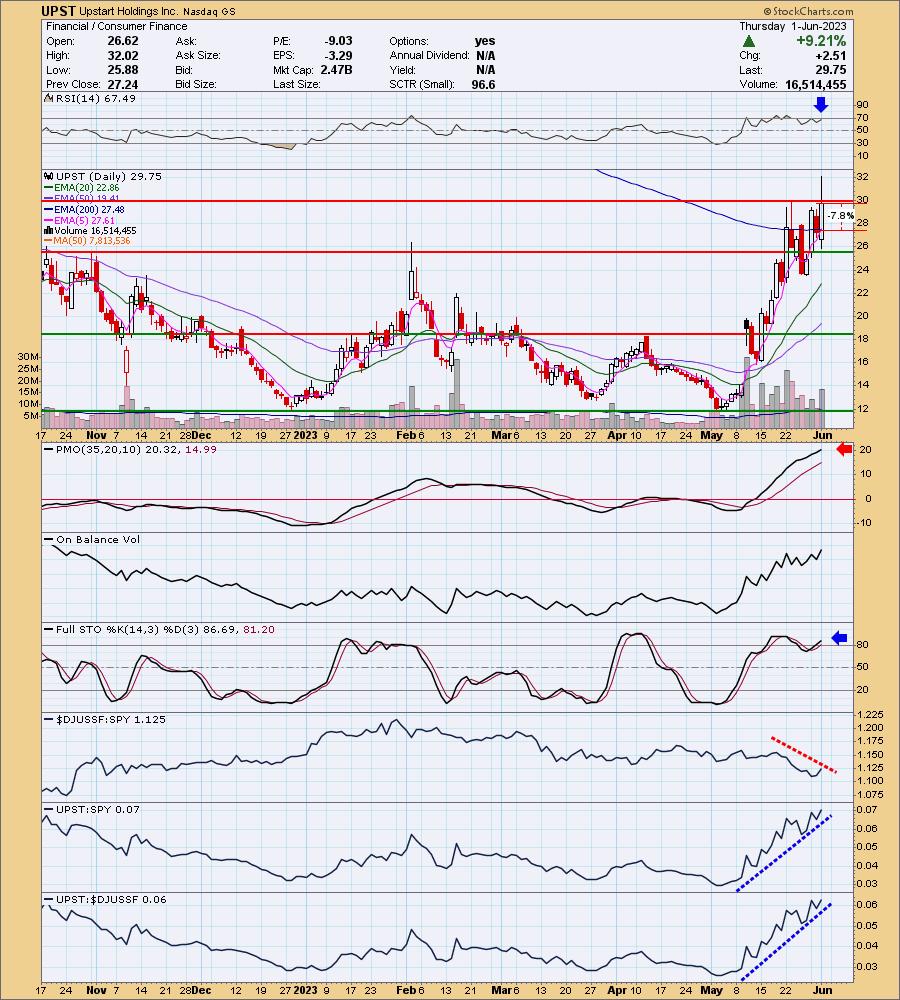
UPST is up +1.48% in after hours trading. This is my favorite chart today with the exception of the very overbought PMO. I'm also not thrilled with such volatile trading on the way up on this rally, but it isn't something that will prevent me from presenting a chart. Today UPST formed a bullish engulfing candlestick suggesting more upside tomorrow. The RSI is positive and not yet overbought. The PMO may be overbought, but it is rising strongly. Stochastics are above 80. The Consumer Finance industry group has been suffering along with other groups in the Financial sector. UPST is having no problems with relative strength, unlike the group. The stop is set beneath the 200-day EMA at 7.8% or $27.42.
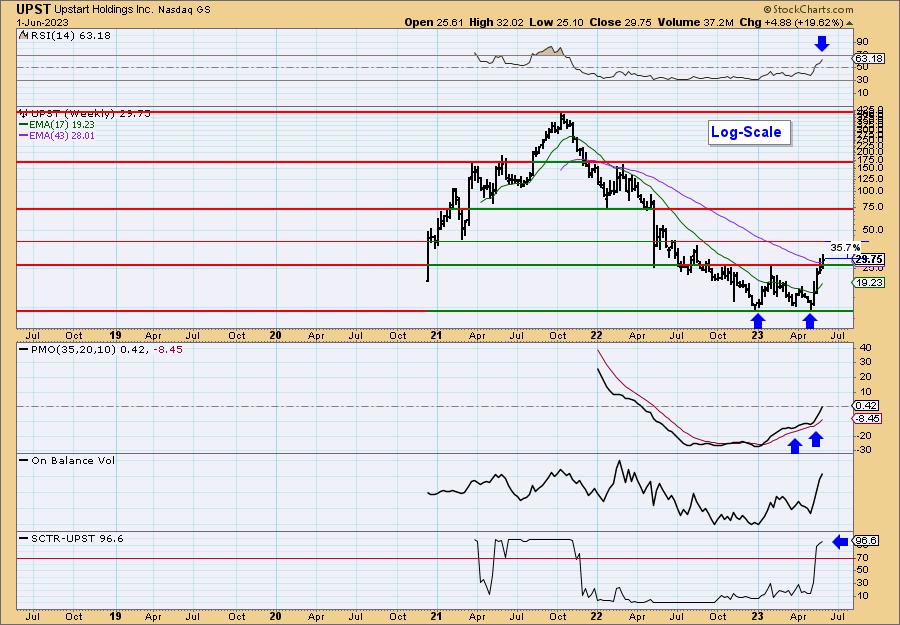
I see a confirmed double-bottom chart pattern that suggests price could push all the way up to $75, but I am setting the upside target at the next level of overhead resistance at early 2021 lows. The weekly RSI is rising strongly and the weekly PMO has surged twice before now reaching above the zero line. The SCTR couldn't be much better.
Don't forget, on Thursdays I look at reader-requested symbols, click HERE to send me an email. I read every email I receive and try to answer them all!
Current Market Outlook:
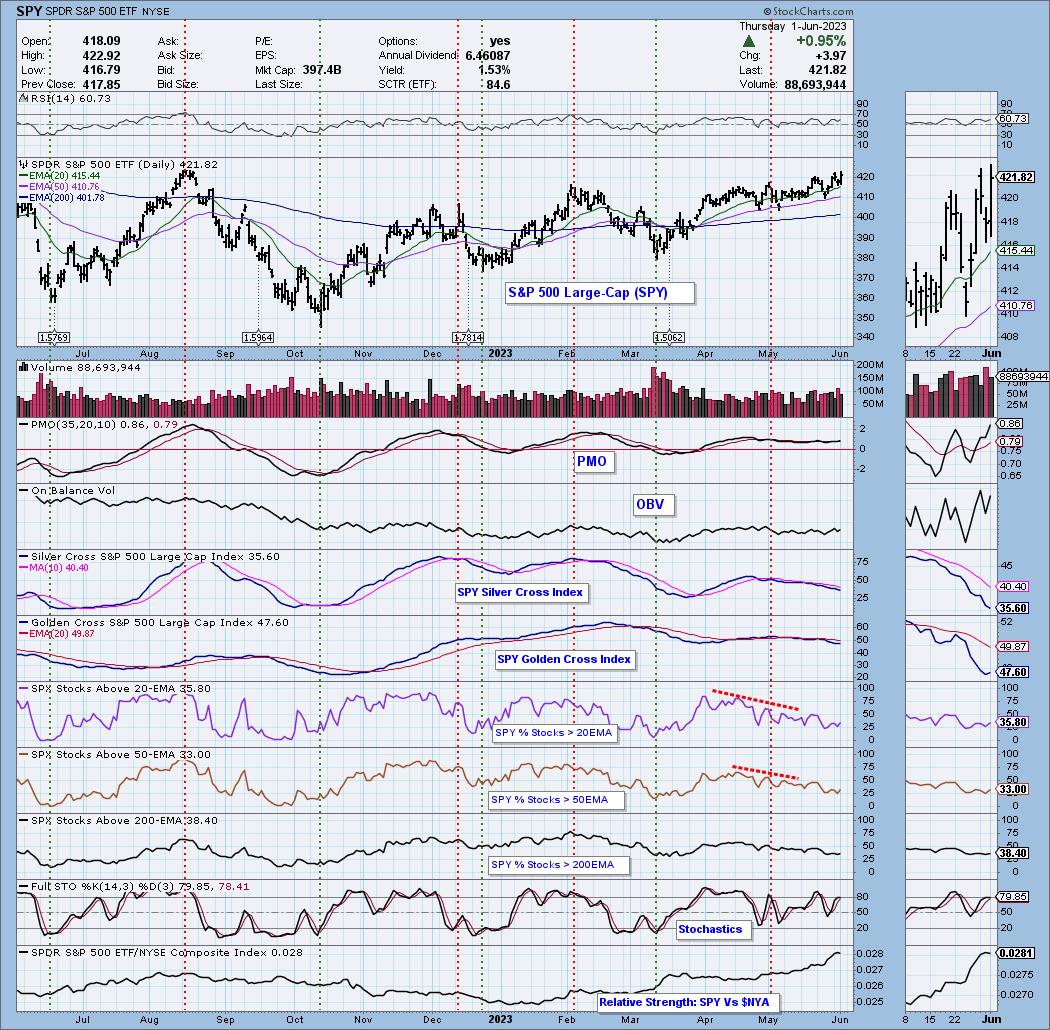
Market Environment: It is important to consider the odds for success by assessing the market tides. The following chart uses different methodologies for objectively showing the depth and trend of participation for intermediate- and long-term time frames.
- The Silver Cross Index (SCI) shows the percentage of SPX stocks on IT Trend Model BUY signals (20-EMA > 50-EMA)
- The Golden Cross Index (GCI) shows the percentage of SPX stocks on LT Trend Model BUY signals (50-EMA > 200-EMA)
Don't forget that as a "Diamonds" member, you have access to our GCI/SCI curated ChartList on DecisionPoint.com. You'll find it under "Members Only" links on the left side on the Blogs and Links Page.
Here is the current chart:
Full Disclosure: I am 10% long, 7% short.
I'm required to disclose if I currently own a stock I mention and/or may buy/short it within the next 72 hours.
"Technical Analysis is a windsock, not a crystal ball." - Carl Swenlin
(c) Copyright 2023 DecisionPoint.com
Watch the latest episode of DecisionPoint Trading Room with Carl & Erin Swenlin on Mondays 7:00p EST or on the DecisionPoint playlist on the StockCharts TV YouTube channel here!
NOTE: The stocks reported herein are from mechanical trading model scans that are based upon moving average relationships, momentum and volume. DecisionPoint analysis is then applied to get five selections from the scans. The selections given should prompt readers to do a chart review using their own analysis process. This letter is not a call for a specific action to buy, sell or short any of the stocks provided. There are NO sure things or guaranteed returns on the daily selection of "Diamonds in the Rough."
Regarding BUY/SELL Signals: The signal status reported herein is based upon mechanical trading model signals and crossovers. They define the implied bias of the price index/stock based upon moving average relationships and momentum, but they do not necessarily call for a specific action. They are information flags that should prompt chart review. Further, they do not call for continuous buying or selling during the life of the signal. For example, a BUY signal will probably (but not necessarily) return the best results if action is taken soon after the signal is generated. Additional opportunities for buying may be found as price zigzags higher, but the trader must look for optimum entry points. Conversely, exit points to preserve gains (or minimize losses) may be evident before the model mechanically closes the signal.
Helpful DecisionPoint Links:
Price Momentum Oscillator (PMO)
Swenlin Trading Oscillators (STO-B and STO-V)
For more links, go to DecisionPoint.com