
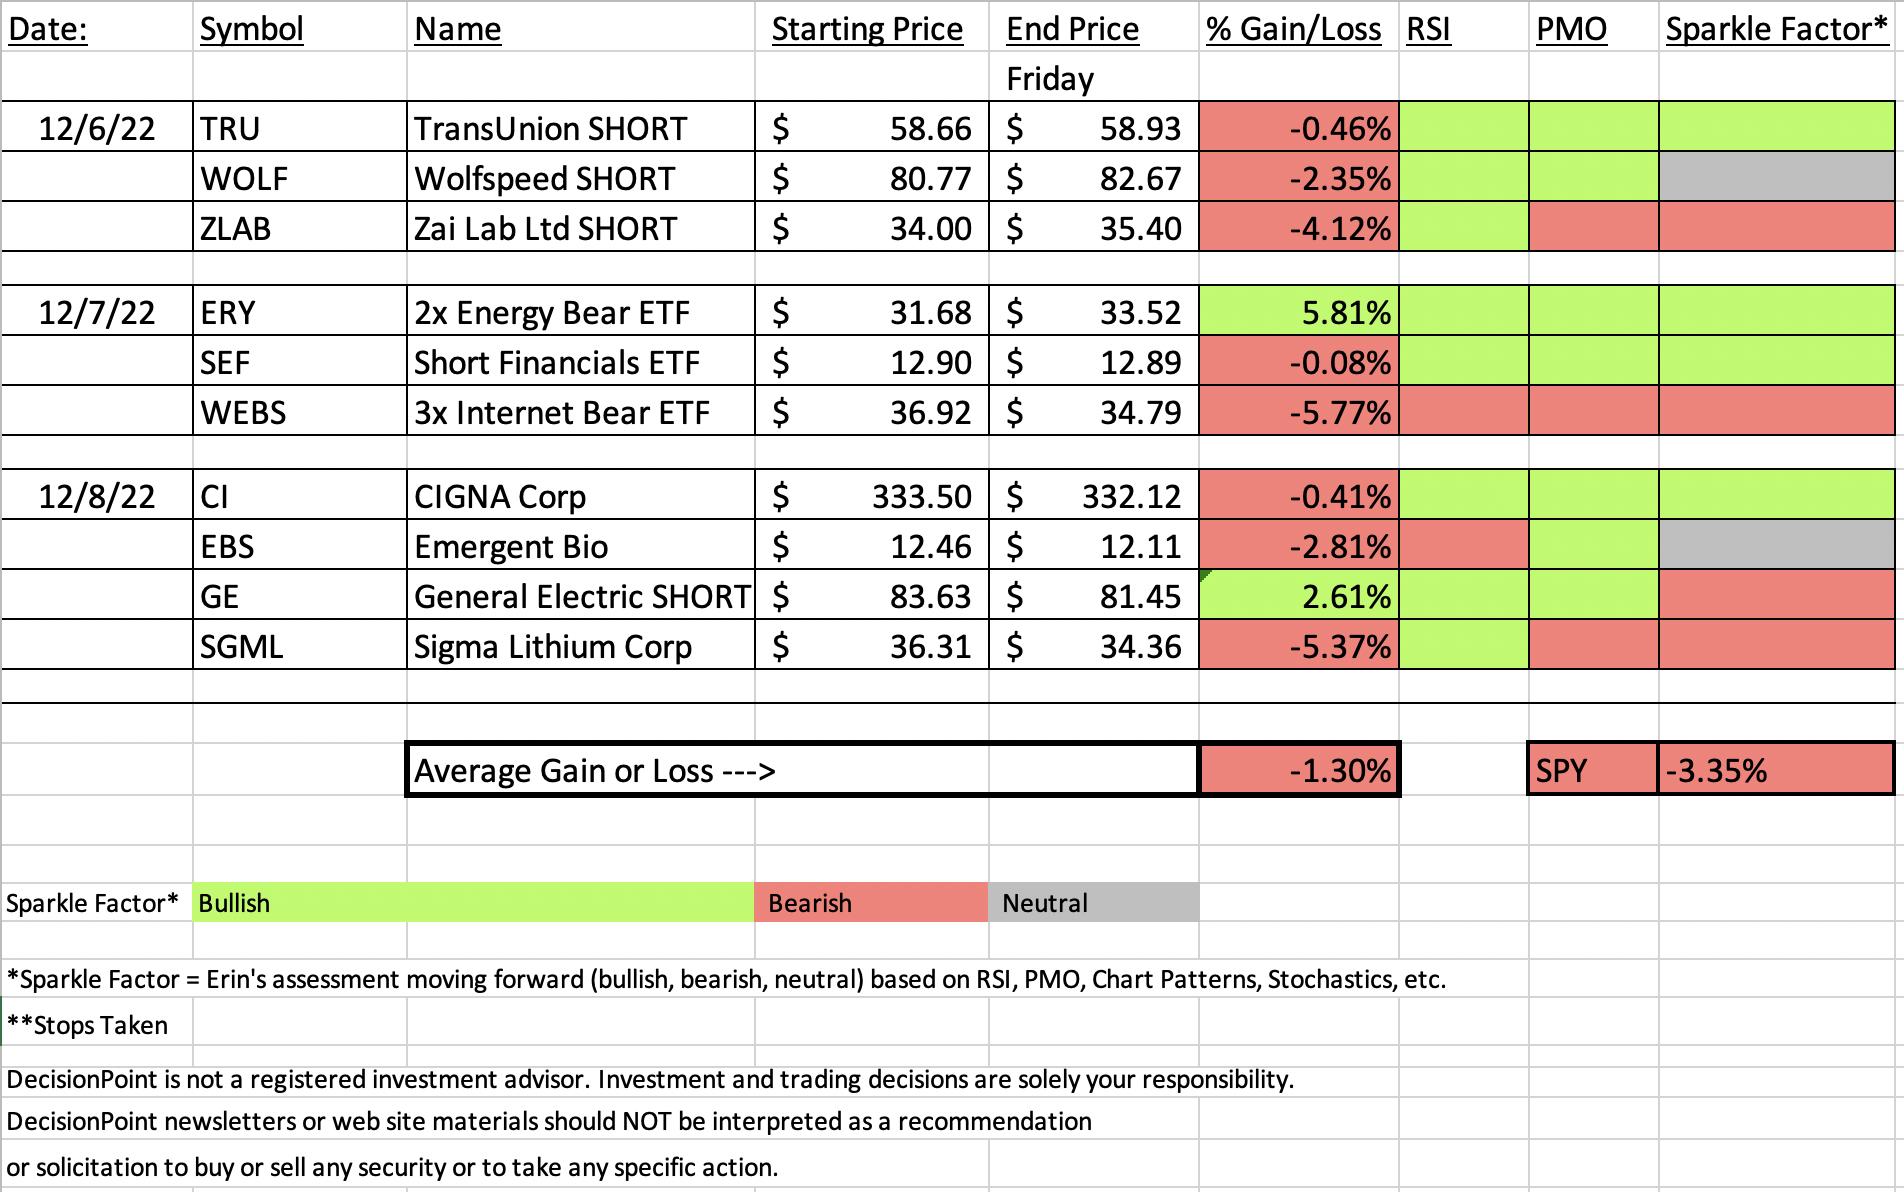
This week we opted to add inverse ETFs and shorts as "Diamonds in the Rough". It was rocky as most of the shorts managed to eke out some upside. Many are iffy at this point, so be sure and check out the Sparkle Factor on the spreadsheet.
This week there really is no "Sector to Watch" on the long side so I opted to pick Energy (XLE) as a sector to watch move lower. Our Darling this week was the 2x bear ETF on Energy. I'd say that is what to watch next week. Someone also pointed out DRIP which is an inverse for Exploration & Production.
As I mentioned over and over this morning, I do NOT trust this market. I've slimmed my portfolio again, but added ERY, the 2x bear ETF we looked at on Wednesday. I'm now pretty much evenly distributed between that hedge and a few longs. The short on General Electric (GE) is tempting me now as well. Mad I didn't get in on it today.
Overall, be very careful moving forward, particularly on longs. If you don't have stops on your long positions, you should. Better safe than sorry they say.
There has been some confusion regarding our price change in January. You will be grandfathered and always keep your low rate. If you do not have the DP Alert and are thinking of adding it, now would be the time so you can lock in the low rate. Notify me if you want to add it and I'll get you switched into a Bundle subscription.
Have a great weekend!
Good Luck & Good Trading,
Erin

RECORDING LINK (12/9/2022):
Topic: DecisionPoint Diamond Mine (12/9/2022) LIVE Trading Room
Start Time: Dec 9, 2022 09:00 AM
Passcode: December@9
REGISTRATION for 12/16/2022:
When: Dec 16, 2022 09:00 AM Pacific Time (US and Canada)
Topic: DecisionPoint Diamond Mine (12/16/2022) LIVE Trading Room
Register in advance for this webinar HERE
After registering, you will receive a confirmation email containing information about joining the webinar.

Our latest DecisionPoint Trading Room recording:
A few items about the spreadsheet: I've put on the spreadsheet whether the RSI is positive (green) or negative (red). The PMO column tells you if it is rising (green) or falling (red). Finally I've added my own "Sparkle Factor" that gives you my assessment going forward, bullish (green), bearish (red) or neutral (gray). The Sparkle Factor is basically my thoughts on whether I expect it to rise or fall. A neutral means it could really go either way so it could be added to a watch list. If you're in a stock I consider "neutral" going forward, the ball is in your court.
Darling:
Direxion Daily Energy Bear 2x Shares (ERY)
EARNINGS: N/A
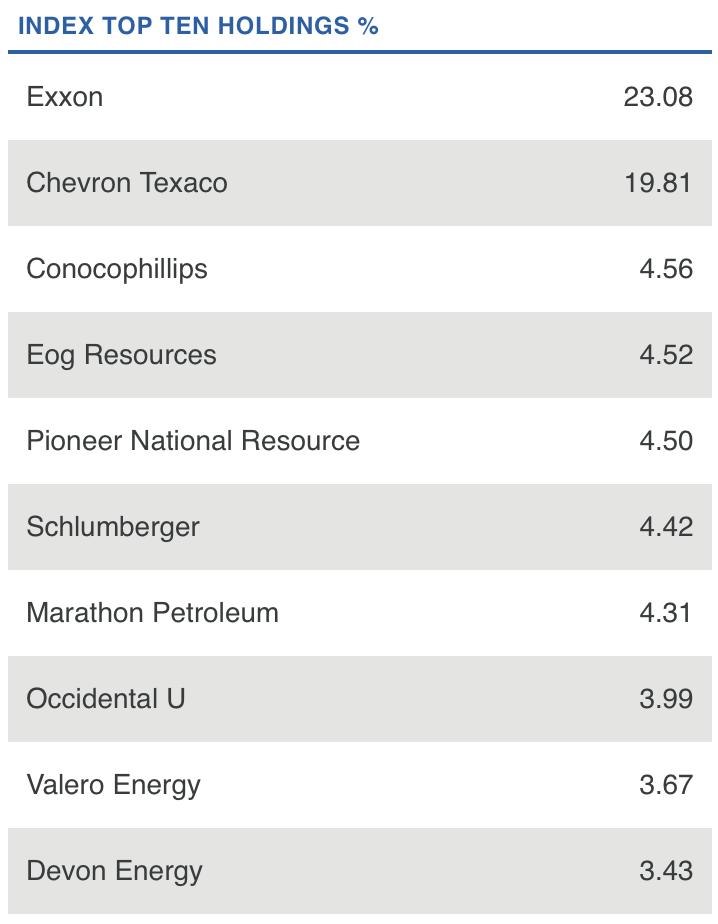
ERY provides 2x inverse exposure to a market-cap-weighted index of US large-cap companies in the energy industry. Click HERE for more information.
Predefined Scans Triggered: P&F Double Top Breakout.
Below are the commentary and chart from Wednesday:
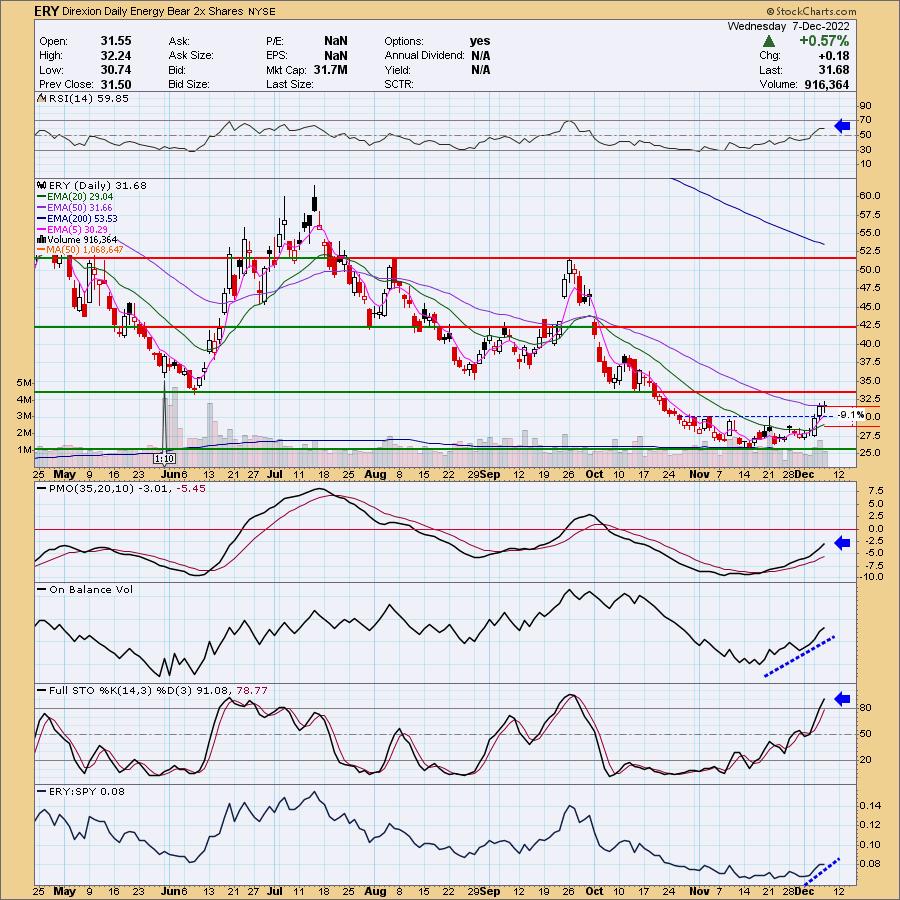
"ERY is down -0.22% in after hours trading. I love this bullish chart. The only issue is new overhead resistance that is nearing. Otherwise, the RSI is comfortably positive. The PMO is rising on an oversold BUY signal. The OBV is definitely confirming the rally as it has rising bottoms. This one is already outperforming the SPY and I bet it will really outperform soon if the market breaks down as I expect. The stops on juiced ETFs are tricky. They are usually very volatile and you can get stopped out easily. They aren't for the faint of heart. And, remember halving your position can alleviate some of that. The stop is therefore 9.1% around $28.79."
Here is today's chart:
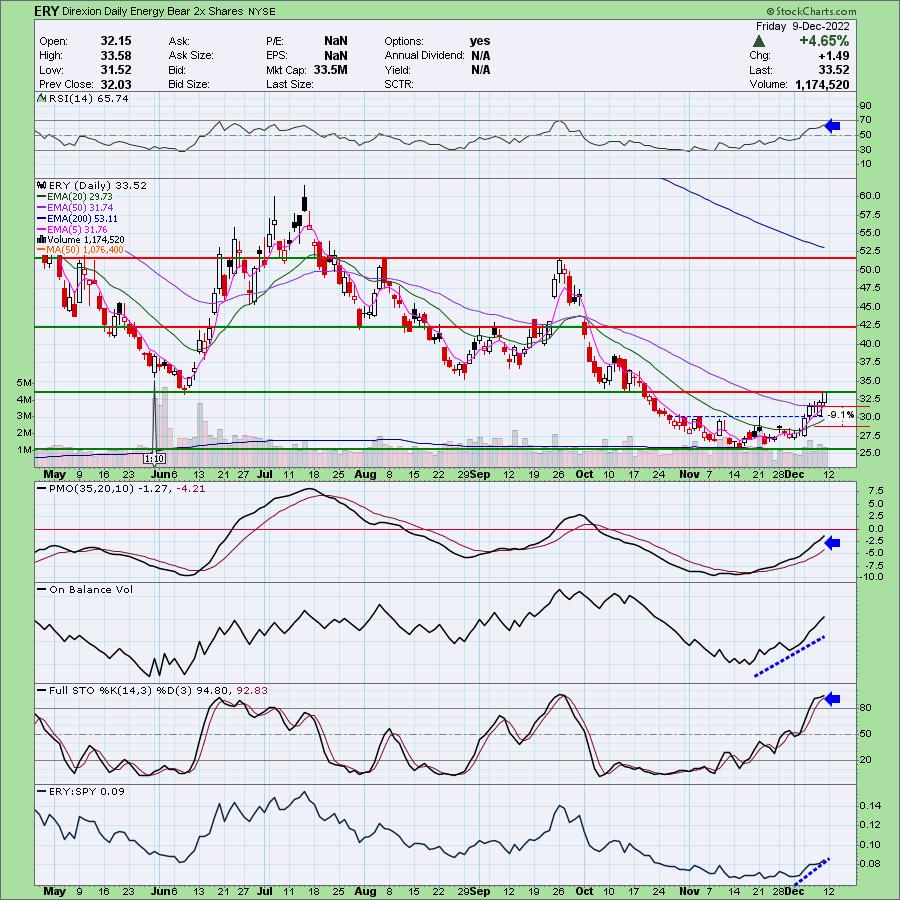
Price is now at overhead resistance. The indicators are very strong. The RSI is positive and not yet overbought. The PMO is rising and should push above the zero line soon. Stochastics are not only above 80, they are still rising too. Volume continues to come in. I like it moving forward and honestly wished I thought about getting in on it sooner. Full disclose: I own ERY.
Don't forget, on Thursdays I look at reader-requested symbols, so shoot me an email at erin@decisionpoint.com. I read every email I receive and try to answer them all!
Dud:
Direxion Daily Dow Jones Internet Bear 3X Shares (WEBS)
EARNINGS: N/A
WEBS provides 3x daily inverse exposure to a market-cap-weighted index of the largest and most liquid U.S. Internet companies. Click HERE for more information.
Predefined Scans Triggered: Bullish MACD Crossovers and Parabolic SAR Buy Signals.
Below are the commentary and chart from Wednesday:
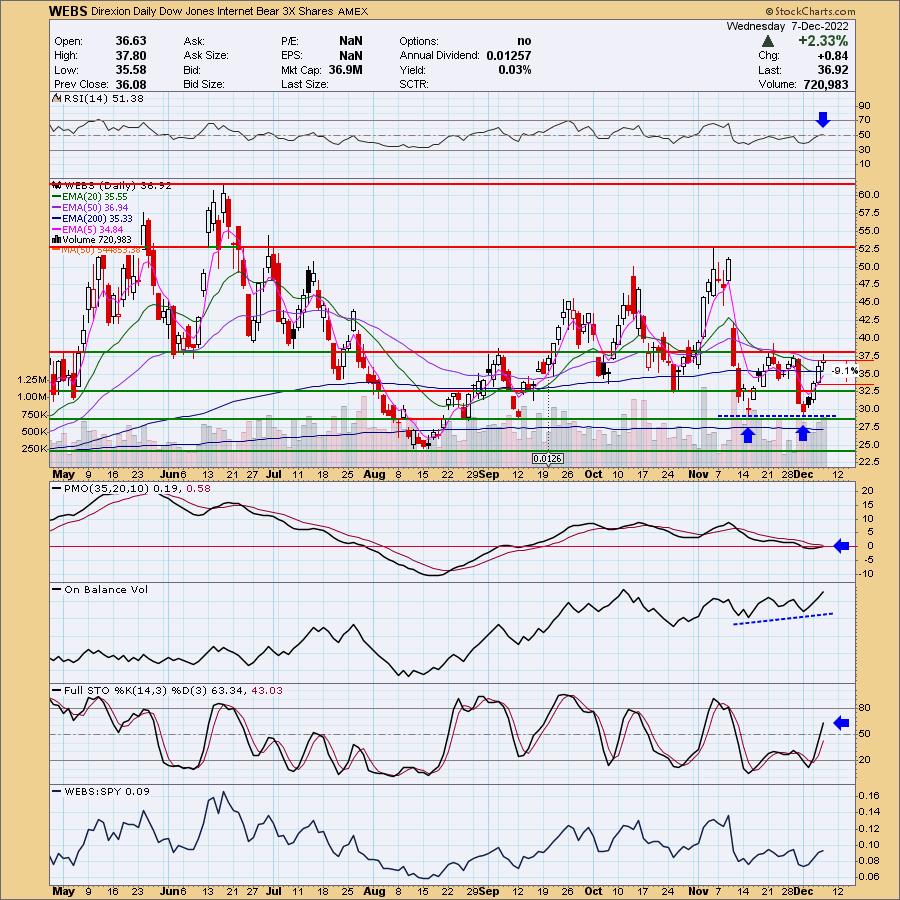
"WEBS is unchanged in after hours trading. Love the chart, just wish we had confirmation with a breakout above the confirmation line of the big double-bottom and a close above the 50-day EMA. I expect to see that soon. Here's why. The RSI just moved into positive territory. The PMO is bottoming almost above the signal line and should give us a crossover BUY signal soon. The OBV has a positive divergence with price. Stochastics are rising strongly in positive territory. The ETF is showing new relative strength. This is a 3x ETF so taking a 1/3rd position is safest, but again with leveraged ETFs the stops will be deeper. In this case I would've moved it below the October low, but that was about a 12% stop. Instead I opted to use a 9.1% stop which puts price around $33.56."
Here is today's chart:
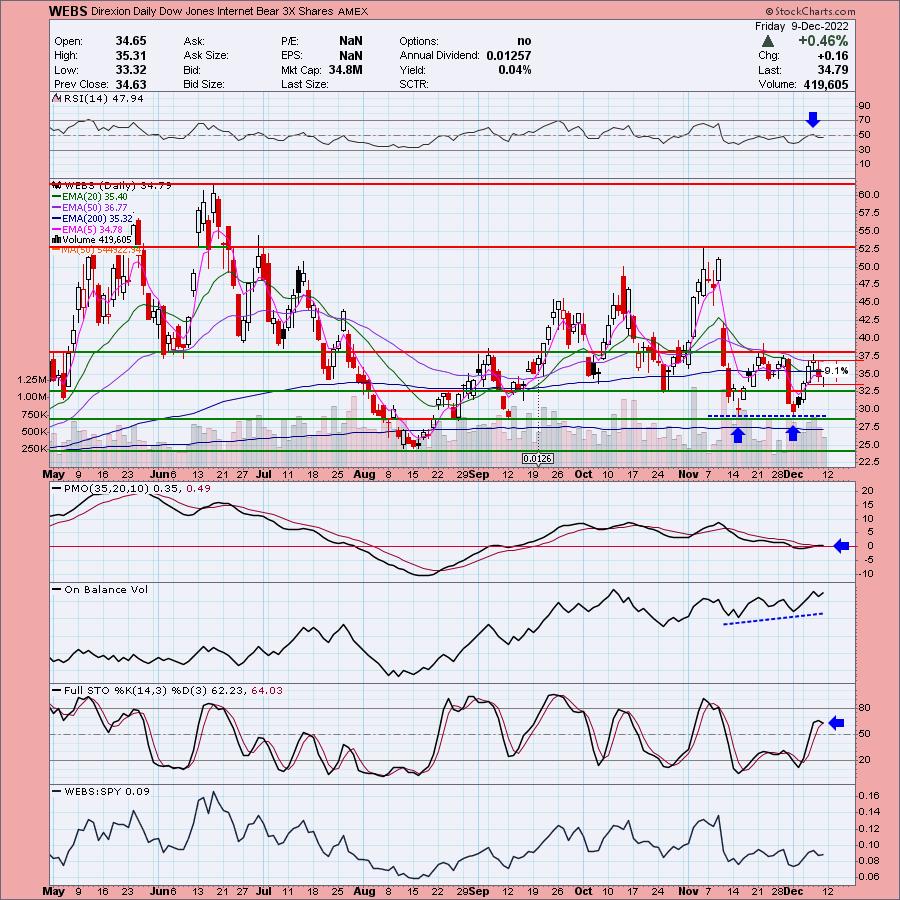
This one went south almost immediately after we picked it. I still think it will be a good selection when the market breaks down, but right now it Internet stocks are trying to make a comeback. I don't like this one moving forward as it appears it will test support before it makes its way back up again.
THIS WEEK's Sector Performance:

DecisionPoint Sector Scoreboard (Mechanical Trend Model Signals):

Click Here to view Carl's annotated Sector ChartList!
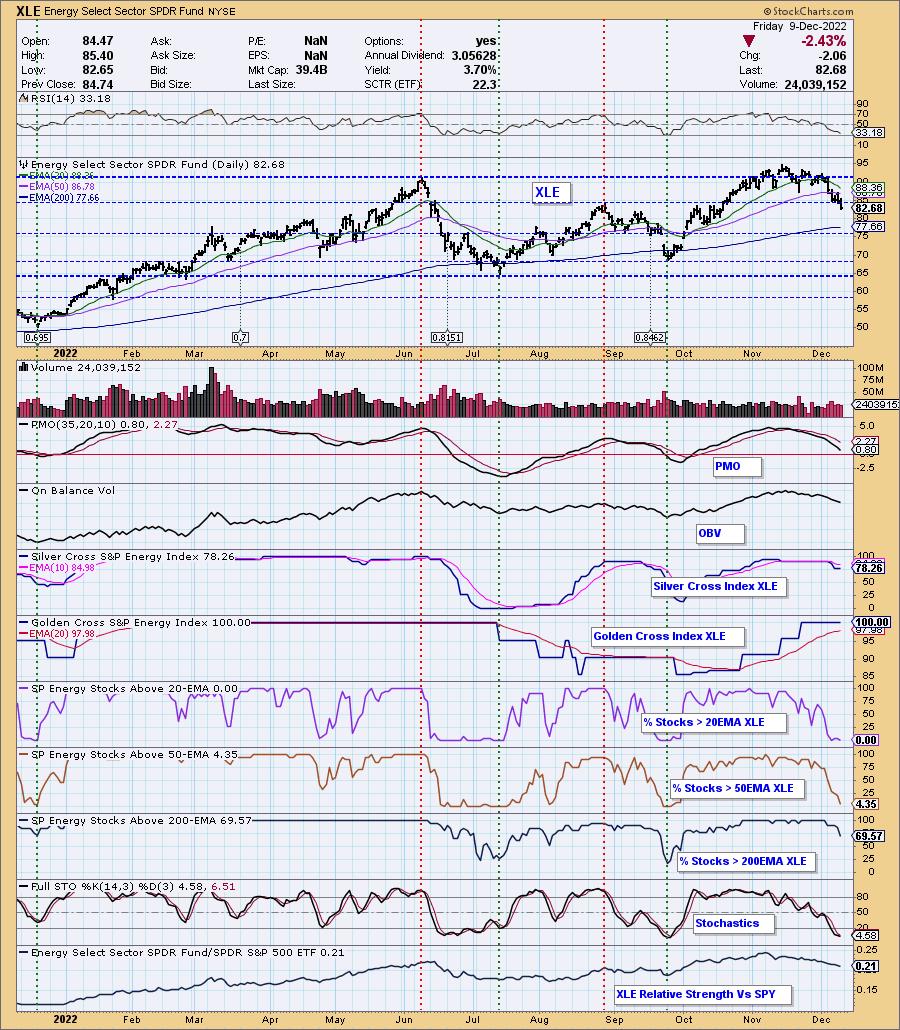
Sector to Watch: Energy (XLE)
As noted in the opening this is a sector to watch for its weakness, not its strength. Bear funds like ERY are a way to take advantage of this very negative setup. The RSI is negative and not yet oversold. The PMO continues to move lower on this very bearish rounded price top. The Silver Cross Index had a negative crossover which is especially bearish, particularly given zero stocks have price above their 20-day EMA and less than 5% have price above the 50-day EMA. The SCI is going to continue to deteriorate as EMAs follow price. If price is below those moving averages, they will move lower and eventually trigger the loss of silver crosses (20-day EMA > 50-day EMA).
Industry Group to Watch: Real Estate Holding & Development ($DJUSEH)
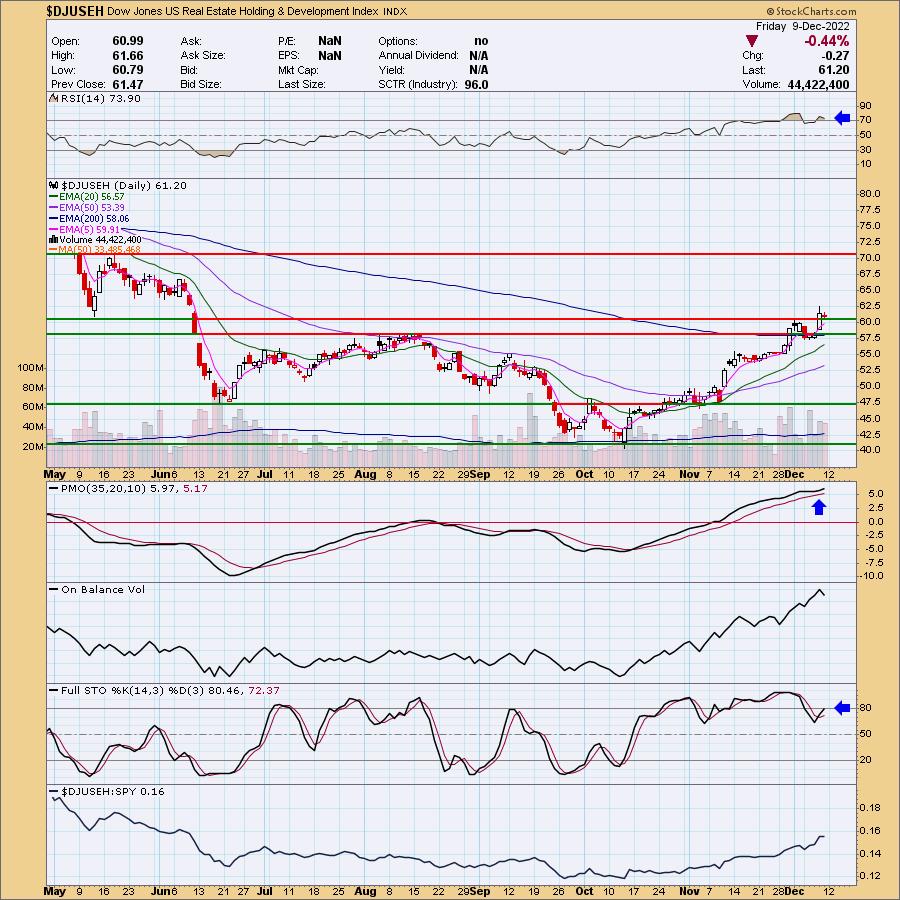
I looked high and low for an ETF that mimicked this industry group but unfortunately came up empty. I don't like the Real Estate sector enough to pick it as a sector to watch. I don't like any sector frankly. However, this industry group is bucking the trend. It broke out above a strong resistance zone and today pulled back as expected. I do wish I could invest in this group. The PMO has bottomed above its signal line and isn't all that overbought when you see that oversold territory has moved down to -10. Stochastics were yanked higher and now reside above 80. We did find a few names to consider within this group going into next week: VICI Properties (VICI), Howard Hughes Corp (HHC) and Forestar Group (FOR).
Go to our Sector ChartList on DecisionPoint.com to get an in-depth view of all the sectors. On StockCharts.com you can find the Industry Summary.
Good Luck & Good Trading!
- Erin
erin@decisionpoint.com
Full Disclosure: I'm 10% exposed with a 5% hedge.
Watch the latest episode of the DecisionPoint Trading Room with Carl & Erin Swenlin on Mondays 3:00p EST!
Technical Analysis is a windsock, not a crystal ball. --Carl Swenlin
NOTE: The stocks reported herein are from mechanical trading model scans that are based upon moving average relationships, momentum and volume. DecisionPoint analysis is then applied to get five selections from the scans. The selections given should prompt readers to do a chart review using their own analysis process. This letter is not a call for a specific action to buy, sell or short any of the stocks provided. There are NO sure things or guaranteed returns on the daily selection of "diamonds in the rough."
Helpful DecisionPoint Links:
DecisionPoint Shared ChartList and DecisionPoint Chart Gallery
Price Momentum Oscillator (PMO)
Swenlin Trading Oscillators (STO-B and STO-V)
(c) Copyright 2022 DecisionPoint.com