
Welcome to a new week of DP Diamonds and welcome new subscribers! I'll be presenting three "Diamonds in the Rough" today, tomorrow is ETF Day (3 ETFs) and Thursday is Reader Request Day so get your symbols in before Thursday at Noon PT. You're welcome to send me a ChartList of requests as well to my StockCharts email address: erinh@stockcharts.com.
Tons of filled black candlesticks covered most of my scan results. These are bearish one-day patterns that suggest a decline ahead for the next day. They form when price closes higher on the day, but closes beneath the open. This makes sense given the upward thrust of the market this morning and its subsequent slow decline. I opted to find stocks that don't have big bearish black candlesticks today.
Good Luck & Good Trading!
Erin
Today's "Diamonds in the Rough": MITK, PLRX and SBH.

RECORDING LINK 12/9/2022:
Topic: DecisionPoint Diamond Mine (12/9/2022) LIVE Trading Room
Start Time: Dec 9, 2022 09:00 AM PT
Passcode: December@9
REGISTRATION for 12/16/2022:
When: Dec 16, 2022 09:00 AM Pacific Time (US and Canada)
Topic: DecisionPoint Diamond Mine (12/16/2022) LIVE Trading Room
Register in advance for this webinar HERE

Here is the last recording:
Welcome to DecisionPoint Diamonds, wherein I highlight ten "Diamonds in the Rough" per week. These are selected from the results of my DecisionPoint Scans which search for stocks that could benefit from the trend and condition of the market. Remember, these are not recommendations to buy or sell, but are the most interesting of the stocks that surfaced in my scans. My objective is to save you the work of the initial, tedious culling process, but you need to apply your own analysis to see if these stocks pique your interest as well. There are no guaranteed winners here!
"Predefined Scans Triggered" are taken from StockCharts.com using the "Symbol Summary" option instead of a "SharpChart" on the workbench.
Mitek Systems, Inc. (MITK) ** Reports Earnings Tomorrow **
EARNINGS: 12/14/2022 (AMC)
Mitek Systems, Inc. engages in the innovation of mobile capture and digital identity verification solutions. Its products include Mobile Deposit, Mobile Verify, Mobile Fill, Mobile Docs, A2iA CheckReader, A2iA XE, A2iA DocumentReader, A2iA TextReader, and ICAR ID_CLOUD. The company was founded in 1986 and is headquartered in San Diego, CA.
Predefined Scans Triggered: Elder Bar Turned Green, Parabolic SAR Buy Signals and Entered Ichimoku Cloud.
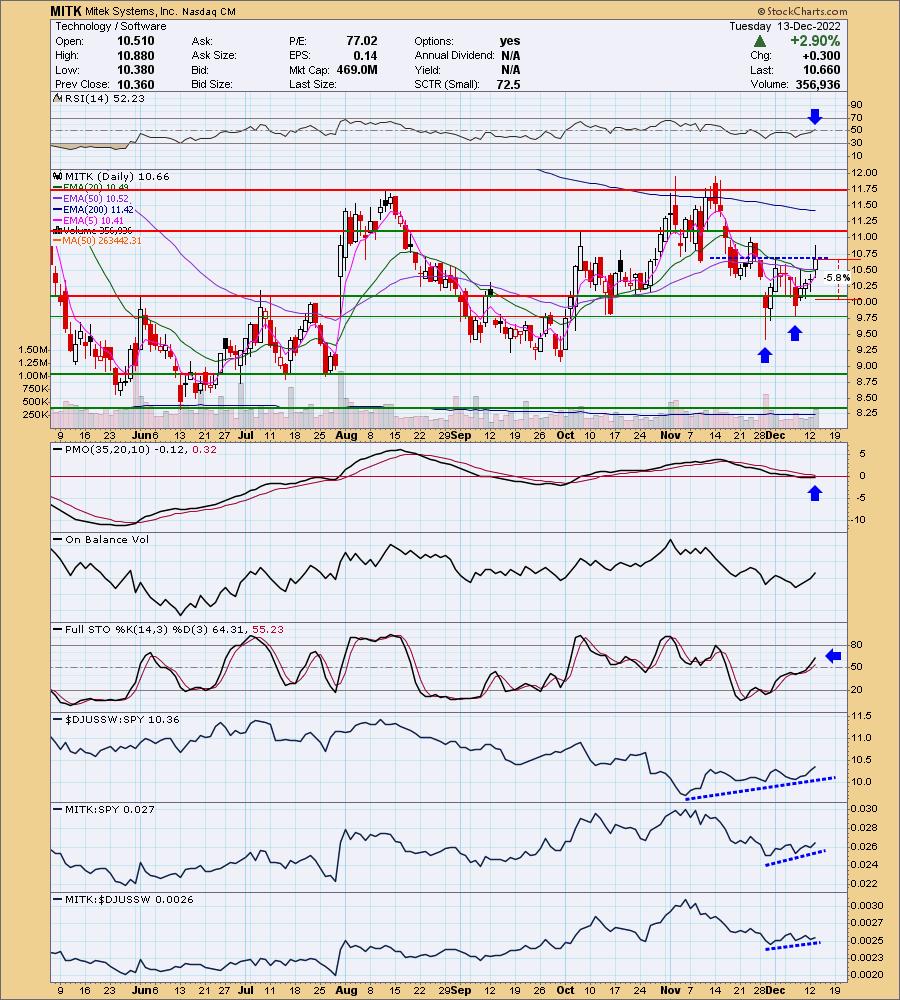
MITK is up +1.78% in after hours trading. I hate picking stocks before earnings so be careful. My apologies, I try to catch this before I write. I still like it though. There is a bullish double-bottom pattern that was almost executed today. Technically it did confirm with today's highs, but I want to see a close above the confirmation line. The RSI is now in positive territory and the PMO is going in for an oversold crossover BUY signal just above its signal line. Stochastics are rising, suggesting more upside to come. Relative strength for the group shows outperformance against the SPY. SBH isn't usually the best performer in the group, but it is showing renewed strength right now. The stop is set at 5.8% below the June/July tops around $10.04.
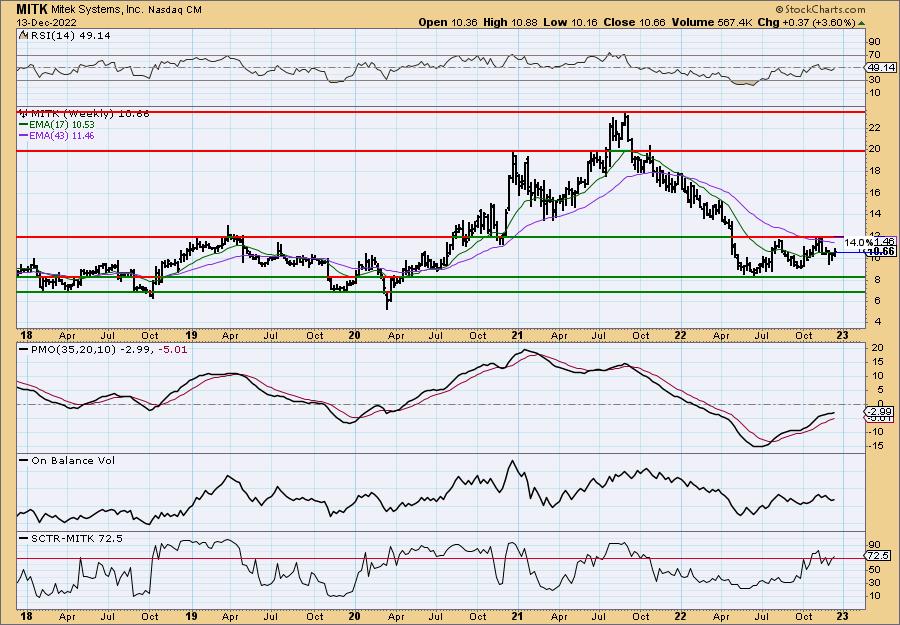
The weekly chart shows upside potential at about 14% which is more than double our stop level. The weekly RSI is about to move into positive territory and the weekly PMO is accelerating higher. The SCTR is in the "hot zone" above 70% meaning that it is in the top third of its universe (ETFs, large, mid and small-caps). 72.5% is respectable.
Pliant Therapeutics Inc. (PLRX)
EARNINGS: 02/27/2023 (AMC)
Pliant Therapeutics, Inc. engages in the business of developing and commercializing novel therapies for fibrotic diseases. It offers product discovery engine. The company is pursuing drug development programs for a range of fibrotic diseases, focusing on tissue-specific integrin modulation and TGF-ß1 signaling inhibition. Pliant Therapeutics was founded by Bradley Backes, Bill De Grado, Hal Chapman, and Dean Sheppard in June 2015 and is headquartered in South San Francisco, CA.
Predefined Scans Triggered: None.
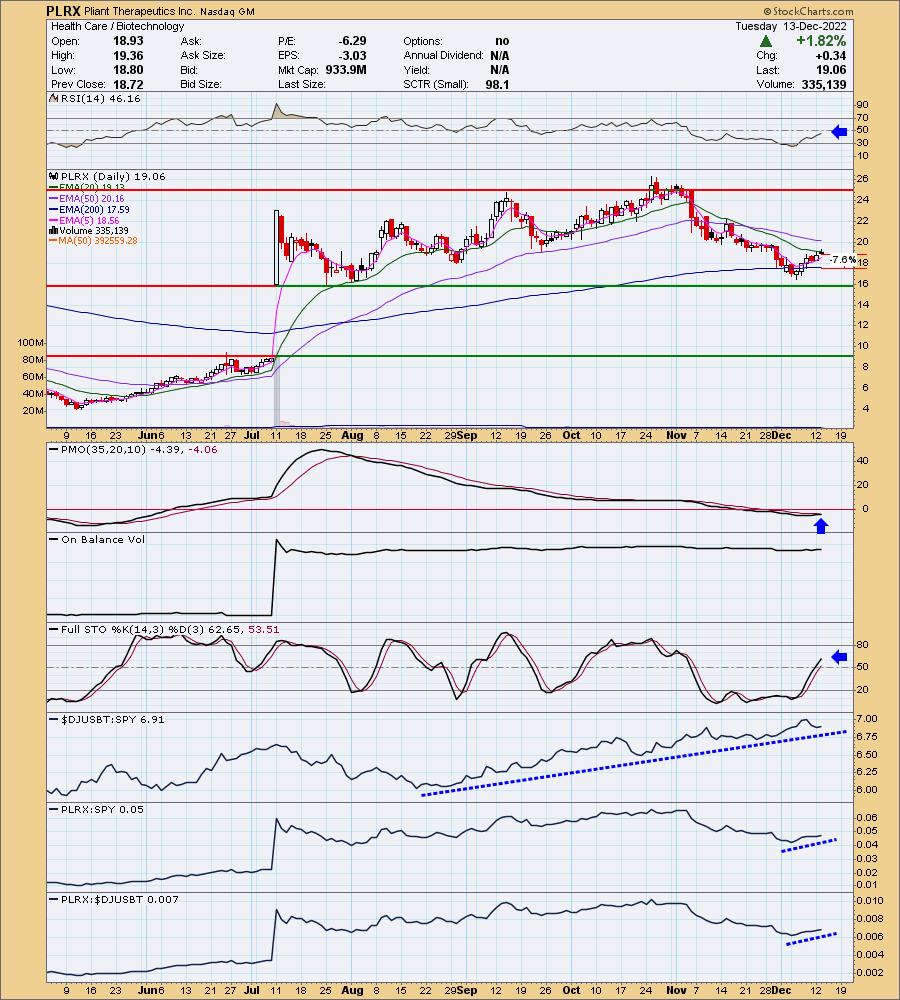
PLRX is up +1.05% in after hours trading. We do have a small filled black candlestick and price didn't quite close above the 20-day EMA. The RSI is negative, but rising. The PMO is nearing a crossover BUY signal. Stochastics are rising nicely and are in positive territory. The group continues to impress, but as you know finding the winners among all of the cats and dogs in this group can be tricky. I think this is a good one. The stop is set below the 200-day EMA around $17.61.
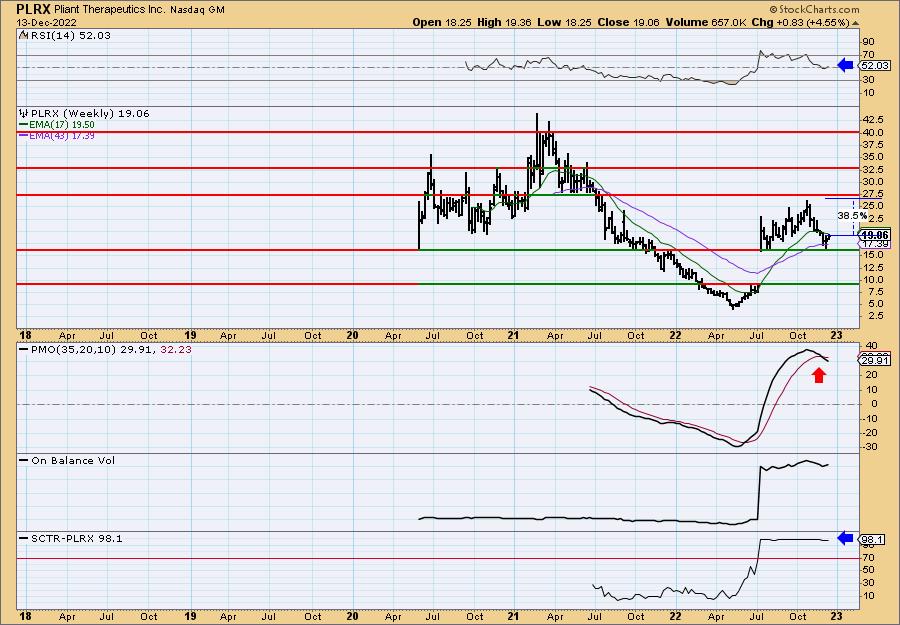
The weekly PMO looks pretty ugly, but that is a function of the big gap up followed by the pullback to support. It is now bouncing off gap support and should at least challenge the October high. Upside potential is over 38%.
Sally Beauty Holdings Inc. (SBH)
EARNINGS: 02/01/2023 (BMO)
Sally Beauty Holdings, Inc. is an international retailer and distributor of professional beauty supplies. It operates through the Sally Beauty Supply (SBS) and Beauty Systems Group (BSG) segments. The SBS segment offers domestic and international chain of retail stores and a consumer-facing e-commerce website that offers professional beauty supplies to both salon professionals and retail customers primarily in North America, Puerto Rico, and parts of Europe and South America. The BSG segment includes franchise-based business Armstrong McCall, a full service distributor of beauty products and supplies that offers professional beauty products directly to salons and salon professionals through its professional-only stores, e-commerce platforms and its own sales force in partially exclusive geographical territories in the United States and Canada. The company was founded in 1964 and is headquartered in Denton, TX.
Predefined Scans Triggered: Parabolic SAR Buy Signals, P&F Double Bottom Breakout and Hanging Man.
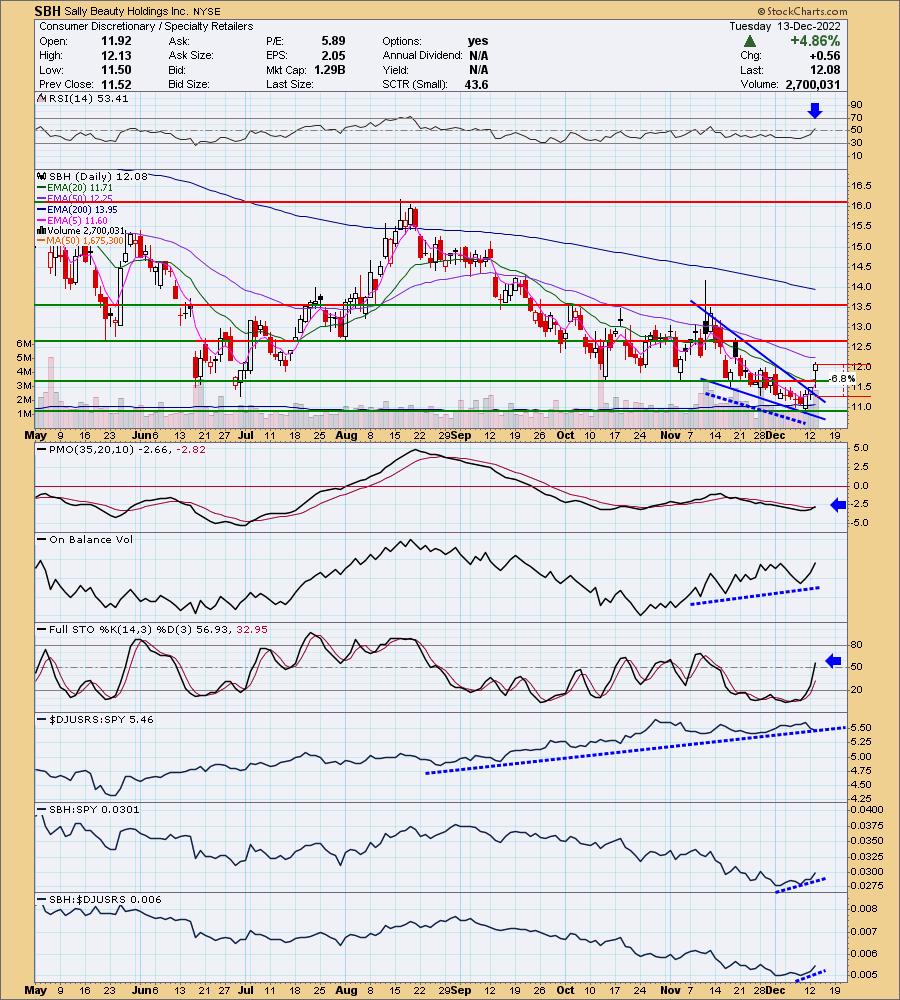
SBH is unchanged in after hours trading. Today was a strong breakout. Unlike many of its brethren, it doesn't have a filled black candlestick. Price has now confirmed a bullish falling wedge and closed well above the 20-day EMA. Next up is the 50-day EMA. The RSI just entered positive territory and the PMO just triggered a crossover BUY signal. There is a strong OBV positive divergence that suggests a prolonged rally ahead. Stochastics are rising toward 80. The group has performed well, but SBH doesn't always participate. Currently it is beginning to outperform the group and the SPY. The stop is set at 6.8% (a little more than halfway down the prior trading range) around $11.26.
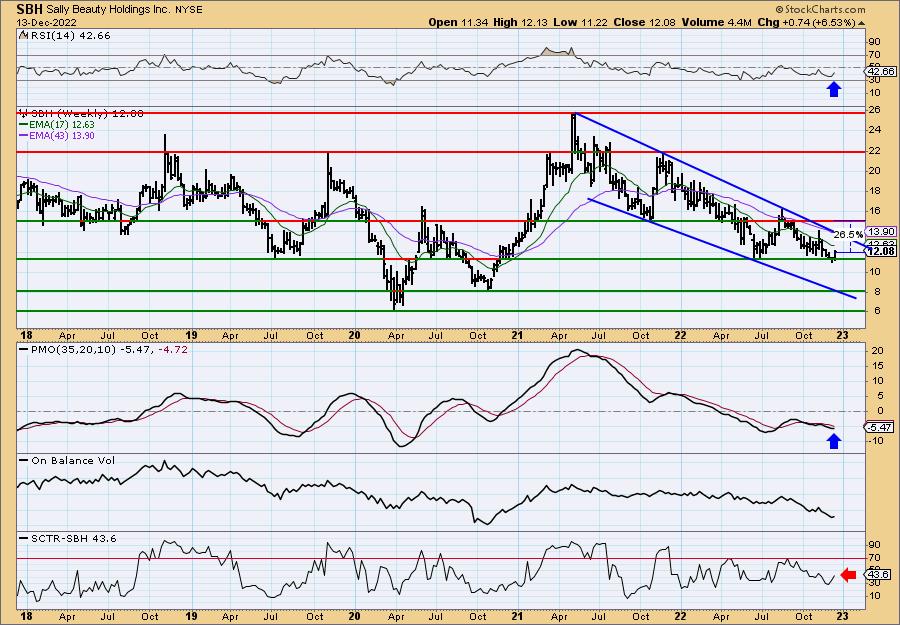
There is also a giant bullish falling wedge on the weekly chart that also suggests a breakout ahead. The weekly PMO is still falling but it is decelerating. The SCTR isn't great and needs improvement. The weekly RSI is negative but is rising. I've put upside potential at the 2021 low at around 26.5%.
Don't forget, on Thursdays I look at reader-requested symbols, click HERE to send me an email. I read every email I receive and try to answer them all!
Current Market Outlook:
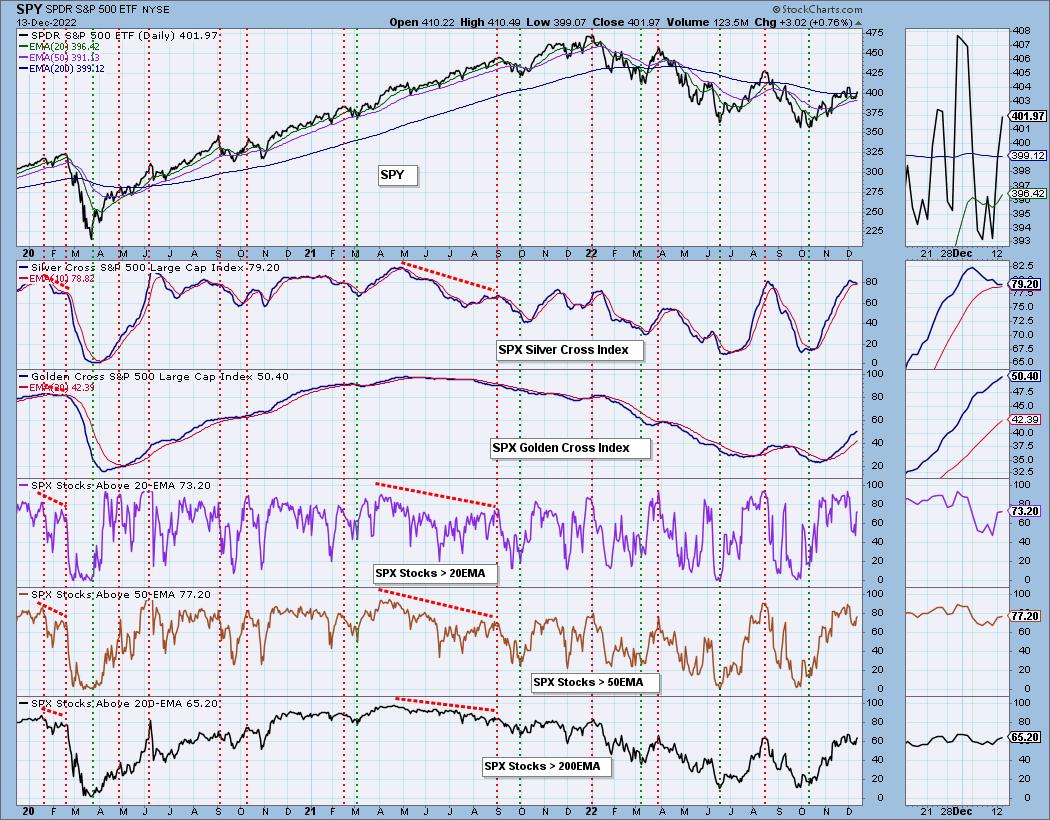
Market Environment: It is important to consider the odds for success by assessing the market tides. The following chart uses different methodologies for objectively showing the depth and trend of participation for intermediate- and long-term time frames.
- The Silver Cross Index (SCI) shows the percentage of SPX stocks on IT Trend Model BUY signals (20-EMA > 50-EMA)
- The Golden Cross Index (GCI) shows the percentage of SPX stocks on LT Trend Model BUY signals (50-EMA > 200-EMA)
Don't forget that as a "Diamonds" member, you have access to our GCI/SCI curated ChartList on DecisionPoint.com. You'll find it under "Members Only" links on the left side on the Blogs and Links Page.
Here is the current chart:
Full Disclosure: I am 10% exposed with a 5% hedge.
I'm required to disclose if I currently own a stock I mention and/or may buy/short it within the next 72 hours.
"Technical Analysis is a windsock, not a crystal ball." - Carl Swenlin
(c) Copyright 2022 DecisionPoint.com
Watch the latest episode of DecisionPoint with Carl & Erin Swenlin on Mondays 7:00p EST or on the DecisionPoint playlist on the StockCharts TV YouTube channel here!
NOTE: The stocks reported herein are from mechanical trading model scans that are based upon moving average relationships, momentum and volume. DecisionPoint analysis is then applied to get five selections from the scans. The selections given should prompt readers to do a chart review using their own analysis process. This letter is not a call for a specific action to buy, sell or short any of the stocks provided. There are NO sure things or guaranteed returns on the daily selection of "Diamonds in the Rough."
Regarding BUY/SELL Signals: The signal status reported herein is based upon mechanical trading model signals and crossovers. They define the implied bias of the price index/stock based upon moving average relationships and momentum, but they do not necessarily call for a specific action. They are information flags that should prompt chart review. Further, they do not call for continuous buying or selling during the life of the signal. For example, a BUY signal will probably (but not necessarily) return the best results if action is taken soon after the signal is generated. Additional opportunities for buying may be found as price zigzags higher, but the trader must look for optimum entry points. Conversely, exit points to preserve gains (or minimize losses) may be evident before the model mechanically closes the signal.
Helpful DecisionPoint Links:
DecisionPoint Shared ChartList and DecisionPoint Chart Gallery
Price Momentum Oscillator (PMO)
Swenlin Trading Oscillators (STO-B and STO-V)
For more links, go to DecisionPoint.com