
It's Reader Request Day! I had a handful of longs requested, but also a shorting opportunity which looks good if this bear market rally is on its last legs. We think so, but always refer to our indicators (see the DP Alert).
Finding longs has been difficult with so few scan results. I was curious to see what you all would present to me. Definitely some interesting selections with potential even on the long side. I would just be extra careful about expanding your portfolio. I remain at 10% and if anything I plan on adding a hedge rather than a long (although one of today's "Diamonds in the Rough" is very enticing).
I'll see you tomorrow in the Diamond Mine trading room! The registration information is below the Diamonds logo.
Good Luck & Good Trading!
Erin
Today's "Diamonds in the Rough": CI, EBS, GE (short) and SGML.
Other Requests: CASY, NRIX, OSW, VRTX, YUM (short), GPS, SIG, SGML, RGA, REGN, MCK, CLDX and CALX.

RECORDING LINK (11/29/2022 - No Diamond Mine on 12/2):
Topic: DecisionPoint Diamond Mine (11/29/2022) LIVE Trading Room
Start Time: Nov 29, 2022 09:00 AM
Passcode: Nov#25th
REGISTRATION for 12/9/2022:
When: Dec 9, 2022 09:00 AM Pacific Time (US and Canada)
Topic: DecisionPoint Diamond Mine (12/9/2022) LIVE Trading Room
Register in advance for this webinar HERE

Here is the last recording:
Welcome to DecisionPoint Diamonds, wherein I highlight ten "Diamonds in the Rough" per week. These are selected from the results of my DecisionPoint Scans which search for stocks that could benefit from the trend and condition of the market. Remember, these are not recommendations to buy or sell, but are the most interesting of the stocks that surfaced in my scans. My objective is to save you the work of the initial, tedious culling process, but you need to apply your own analysis to see if these stocks pique your interest as well. There are no guaranteed winners here!
"Predefined Scans Triggered" are taken from StockCharts.com using the "Symbol Summary" option instead of a "SharpChart" on the workbench.
CIGNA Corp. (CI)
EARNINGS: 02/02/2023 (BMO)
Cigna Corp. is engaged in the provision of global health services. It operates through the following segments: Evernorth, U.S. Medical, International Markets, and Group Disability and Other. The Evernorth segment includes a broad range of coordinated and point solution health services, including pharmacy solutions, benefits management solutions, care solutions and intelligence solutions. The U.S. Medical segment includes Cigna's U.S. Commercial and U.S. Government businesses that provide comprehensive medical and coordinated solutions to clients and customers. The International Markets segment includes supplemental health, life and accident insurance products and health care coverage in international markets, as well as health care benefits to globally mobile employees of multinational organizations. The Group Disability and Other segment represents group disability and life, corporate-owned life insurance, and run-off business consisting of reinsurance, settlement authority, and individual life insurance and annuity and retirement benefits business. The company was founded in 1792 and is headquartered in Bloomfield, CT.
Predefined Scans Triggered: New 52-week Highs, P&F Ascending Triple Top Breakouts and P&F Double Top Breakout.
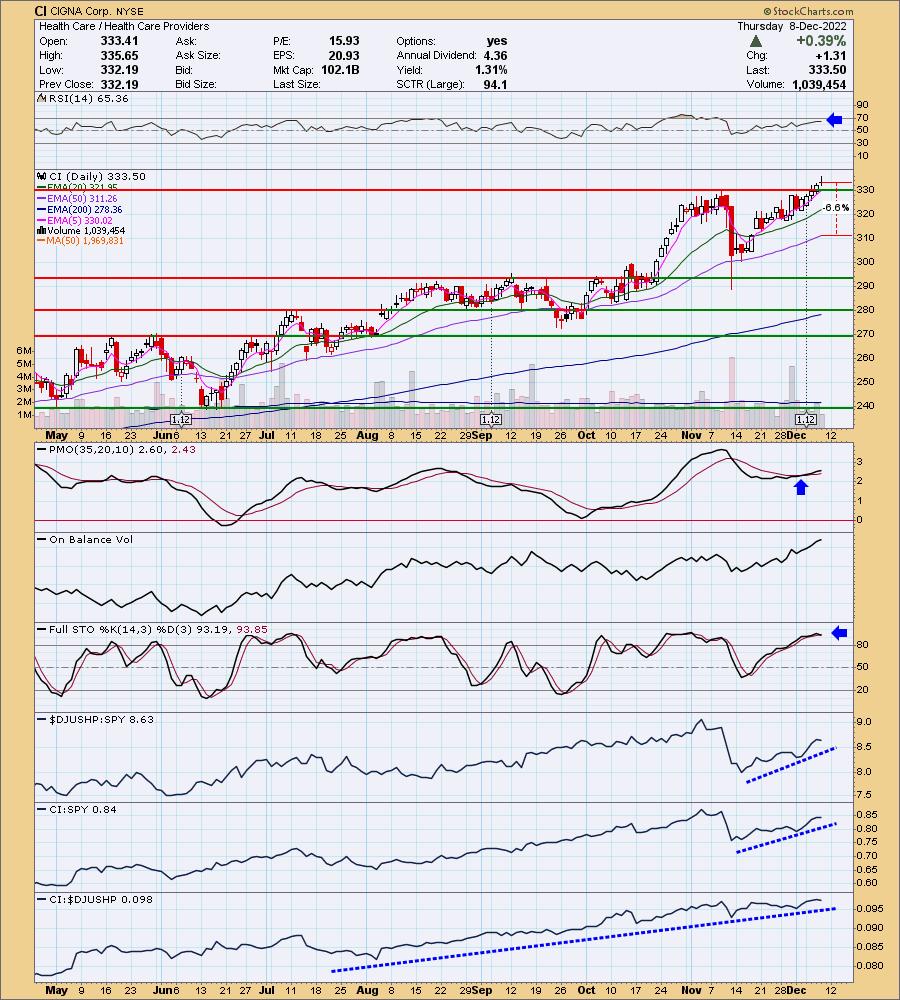
CI is up +0.19% in after hours trading. It broke out above the November top yesterday and today saw follow-through. The RSI is positive and the PMO is on a crossover BUY signal. Stochastics are oscillating above 80 and relative strength is positive across the board. I like the Healthcare sector and this particular industry group is looking good. The stop can be set below the 50-day EMA around 6.6% or $311.49.
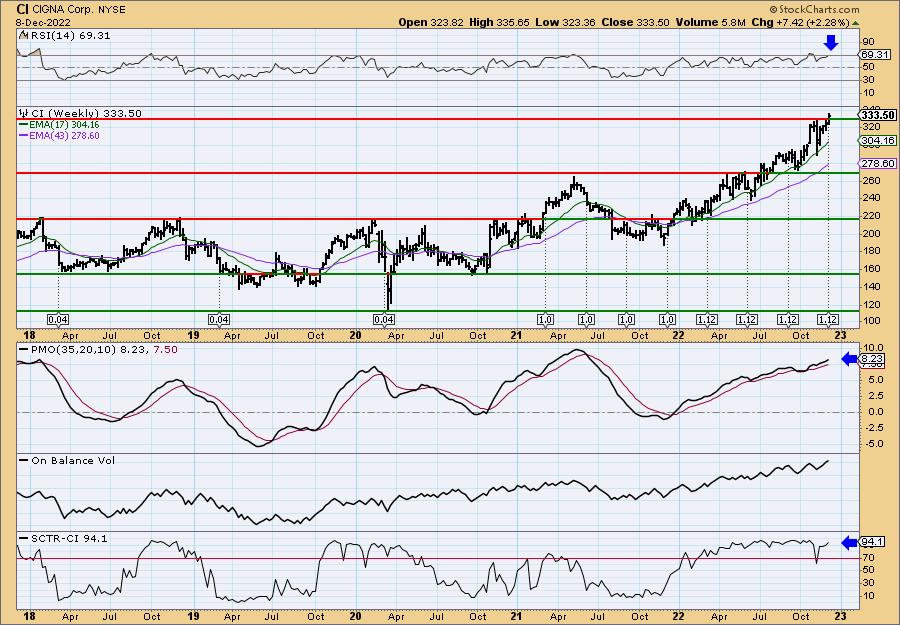
The breakout is clear on the weekly chart. The weekly RSI is positive, although getting overbought which could mean a pullback ahead. The weekly PMO is rising but getting overbought. The SCTR is an impressive 94.1%. This one is overbought, but I would file it under "winners keep on winning"... until they don't. Don't forget to put in your stop.
Emergent BioSolutions Inc. (EBS)
EARNINGS: 02/23/2023 (AMC)
Emergent BioSolutions Inc. engages in the development, manufacture, and commercialization of medical countermeasures. It offers products for civilian and military populations that address accidental, intentional, and naturally occurring public health threats. The firm's products include ACAM2000, BioThrax, Raxibacuma, Vaxchora, and VIGIV. Its business units include Vaccines and Anti-Infectives, Antibody Therapeutics, Devices, and Contract Development and Manufacturing. The company was founded by Fuad El-Hibri on September 5, 1998 and is headquartered in Gaithersburg, MD.
Predefined Scans Triggered: P&F Descending Triple Bottom Breakdown, Filled Black Candles and P&F Double Bottom Breakout.
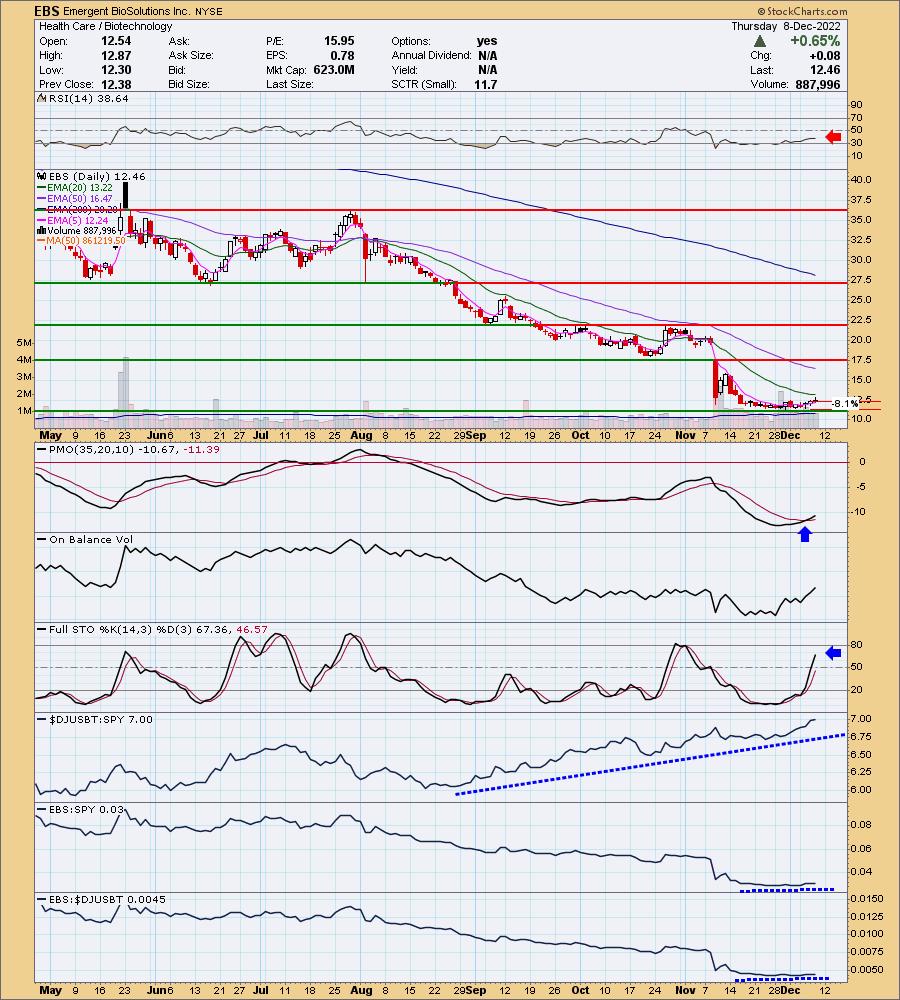
EBS is up +4.17% in after hours trading. This is one tasty looking chart, but remember it is likely to be a bumpy ride as Biotechs tend to be very volatile, particularly small-cap stocks. The rounded price bottom looks great (although we could see a "handle" pullback to make it a cup with handle pattern). The 20-day EMA is arriving as resistance, but this one has an oversold PMO BUY signal and Stochastics are nearing 80. The RSI is a problem, but this one dropped swiftly last month which is messing with the 2-week price range the RSI uses. This looks like a risky investment with tons of upside potential. Consider an 8.1% stop around $11.45.
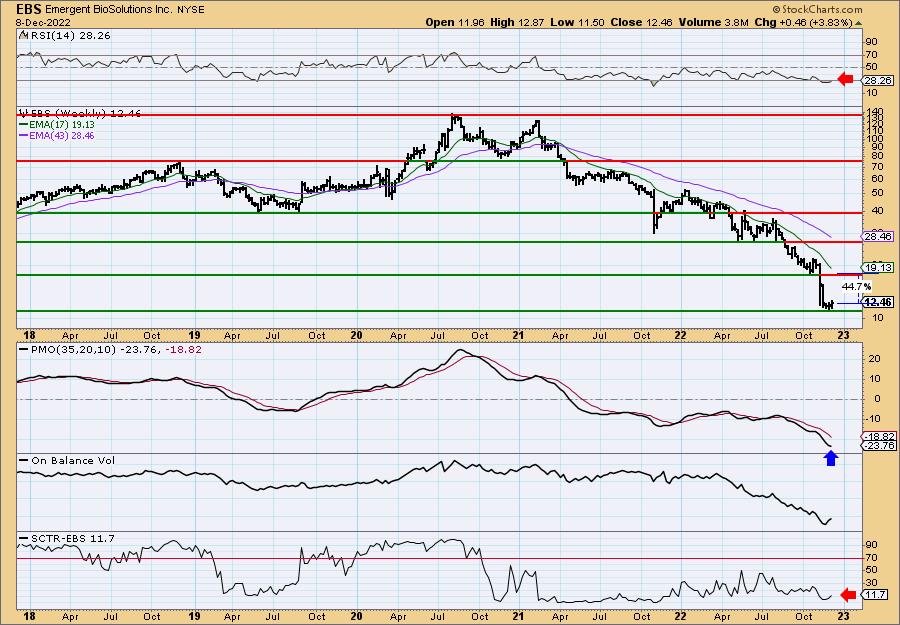
The weekly chart is trying to improve, but the weekly RSI and SCTR have a long way to move upward. The weekly PMO is decelerating on this week's rally, but ultimately is still pointed lower.
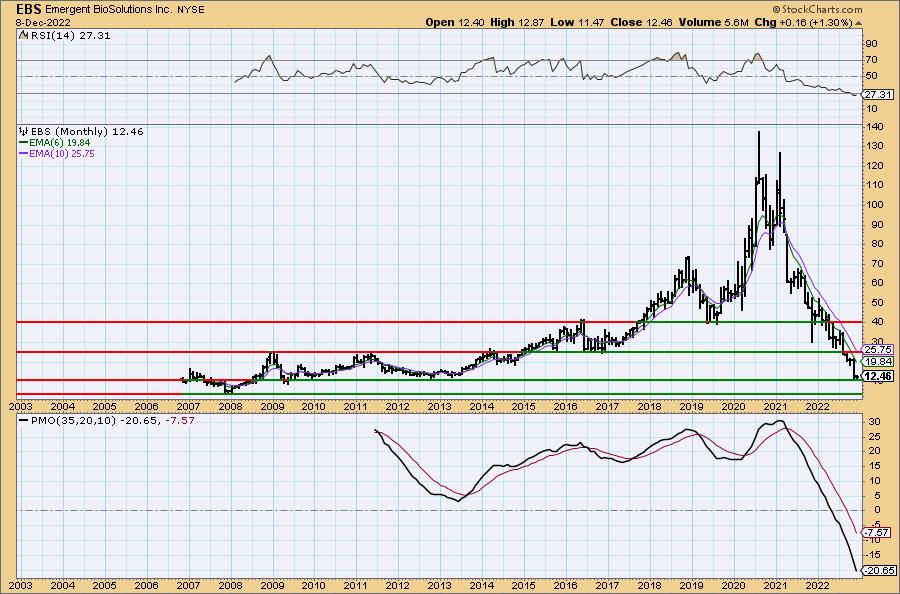
We can't see important support levels, so I decided to add the monthly chart. Price is sitting on very strong long-term support so this conceivably could be a great place for price to reverse higher.
General Electric Co. (GE) - SHORT
EARNINGS: 01/24/2023 (BMO)
General Electric Co. is a high-tech industrial company. the firm operates through the following segments: Aviation, Healthcare, Renewable Energy, and Power. The Aviation segment designs and produces commercial and military aircraft engines, integrated engine components, electric power and mechanical aircraft systems. It also provides aftermarket services to support its products. The Healthcare segment provides essential healthcare technologies to developed and emerging markets and has expertise in medical imaging, digital solutions, patient monitoring and diagnostics, drug discovery and performance improvement solutions. Its products and services are sold worldwide primarily to hospitals and medical facilities. The Renewable Energy segments portfolio of business units includes onshore and offshore wind, blade manufacturing, grid solutions, hydro, storage, hybrid renewables and digital services offerings. The Power segment serves power generation, industrial, government and other customers worldwide with products and services related to energy production. Its products and technologies harness resources such as oil, gas, fossil, diesel and nuclear to produce electric power and include gas and steam turbines, full balance of plant, upgrade and service solutions, as well as data-leveraging software. The company was founded by Thomas Alva Edison in 1878 and is headquartered in Boston, MA.
Predefined Scans Triggered: Moved Below Lower Bollinger Band, New CCI Sell Signals, P&F Triple Bottom Breakdown, P&F Double Bottom Breakout and Bullish 50/200-day MA Crossovers.
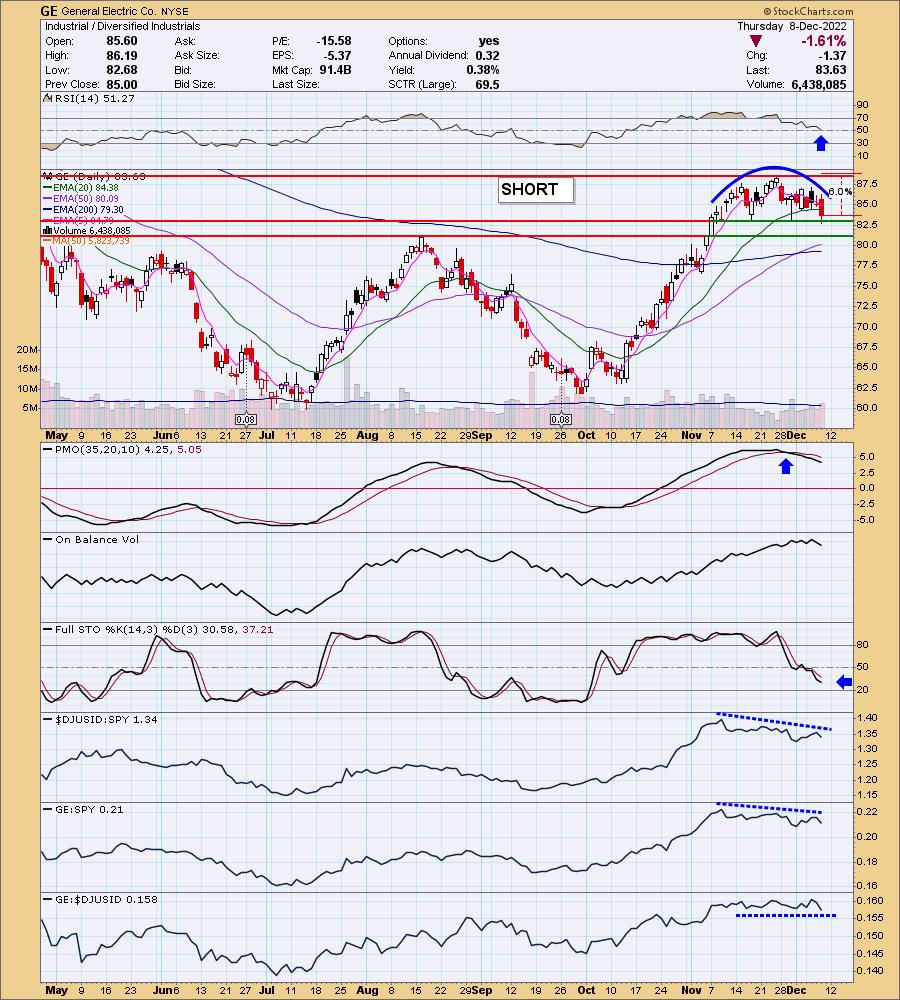
GE is up +0.22% in after hours trading. I like this one on the short side for sure. We have a large rounded top and the PMO is moving lower on an overbought crossover SELL signal. The RSI is nearing negative territory and Stochastics are tanking. Relative strength for the group is terrible so given GE travels inline with the group, it is consequently underperforming the SPY. It would be great to get some confirmation with a breakdown , but today it did close beneath the 20-day EMA. The bad thing is that price is sitting on a strong support zone that could hold up with sideways consolidation. The stop would trigger on an upside breakout. That leaves us some leeway for it to continue its sideways consolidation without triggering the stop at 6% or around $88.64.
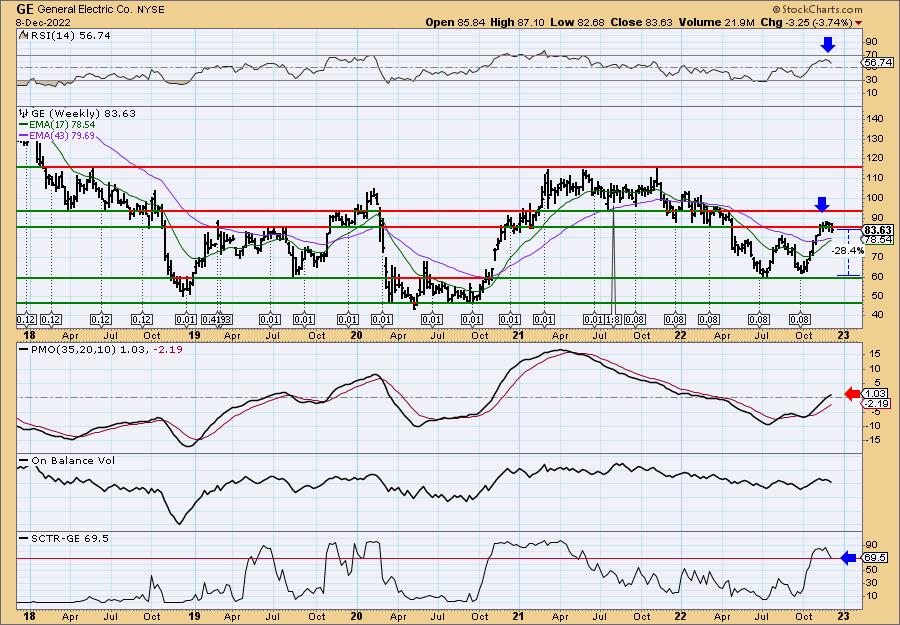
The weekly chart isn't that bad given the weekly PMO just made it above the zero line and the RSI is sitting in positive territory. However, there are cracks in the foundation. The SCTR is leaving the "hot zone" above 70 and price is rounding off before testing overhead resistance at the mid-2021 lows. Additionally we can see the failed breakout above the early 2022 lows and mid-2019 highs.
Sigma Lithium Corp. (SGML)
EARNINGS: N/A
Sigma Lithium Corp. engages in the production a lithium property. It focuses its project in Minas Gerais. The firm also plans to build a world-class commercial-scale lithium concentration plant. The company was founded on June 8, 2011 and is headquartered in Sao Paulo, Brazil.
Predefined Scans Triggered: New CCI Buy Signals and P&F Low Pole.
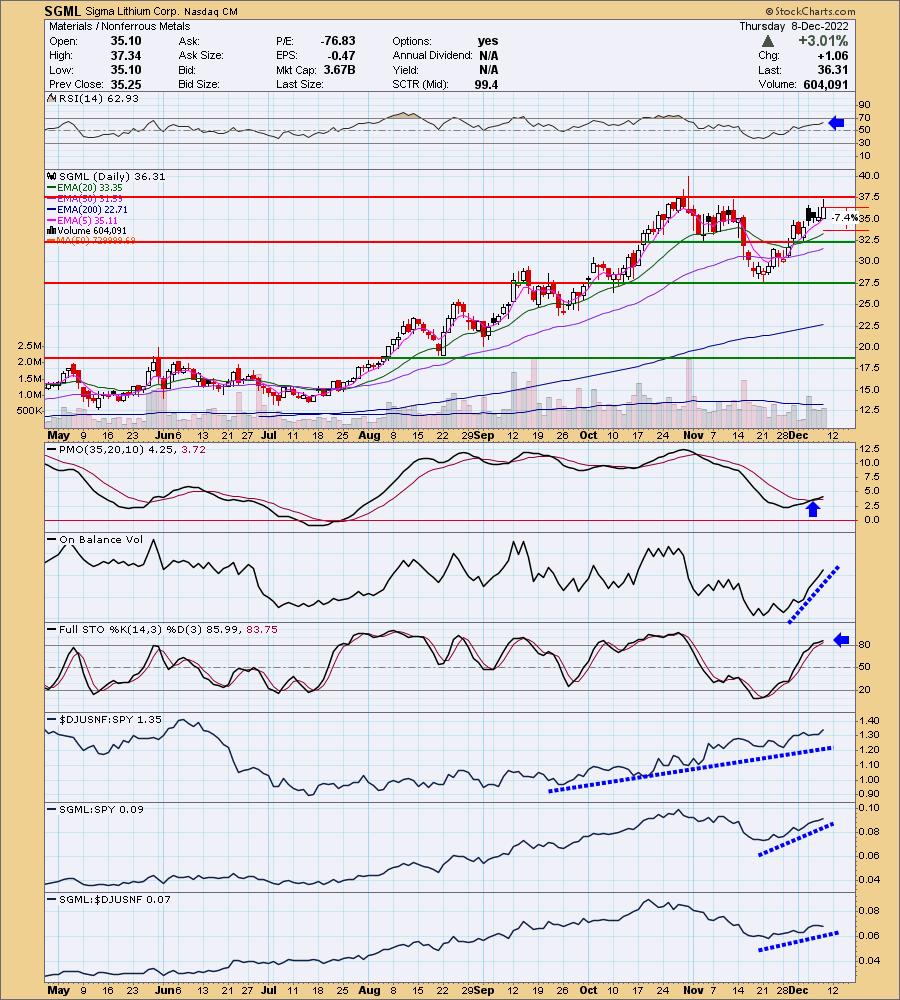
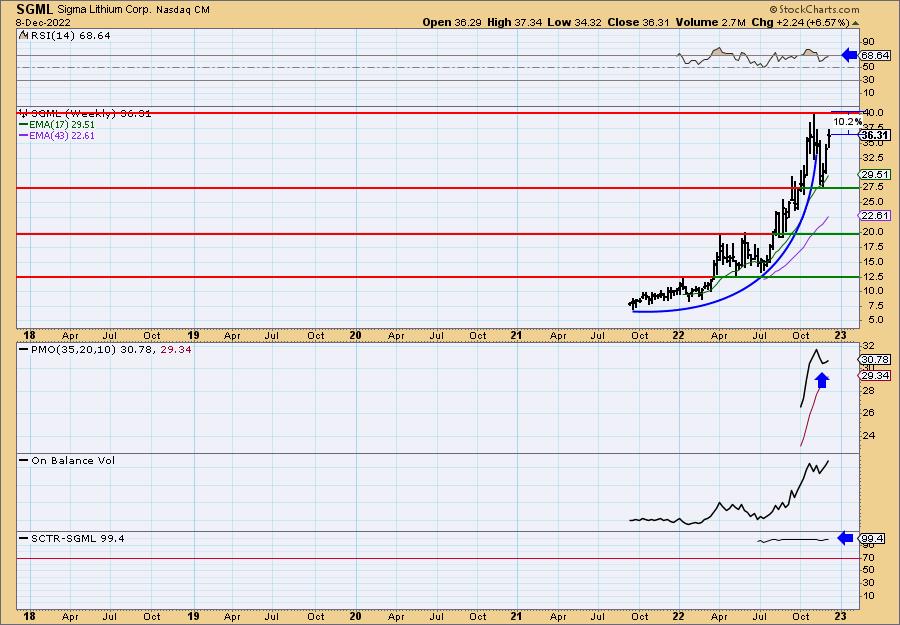
SGML is up +1.21% in after hours trading. Price is up against overhead resistance right now, but given the nice look of the indicators, I'm fairly confident it will breakout. The RSI is positive and Stochastics are above 80. The PMO bottomed right above the zero line and has generated a crossover BUY signal. It is not at all overbought and can accommodate lots more upside. With new chip plants coming online in the US, I would expect these lithium stocks will do well over the long haul. The stop is set around the 20-day EMA at 7.4% or $33.62.
This is what a parabolic breakdown looks like. Those breakdowns typically take price to the last basing pattern which in this case would've been $20. Instead it rebounded earlier and is about to log new all-time highs. The weekly RSI is positive and we have a nice weekly PMO bottom above the signal line. Upside potential is more than 10.2%. It is 10.2% away from those all-time highs. Consider an upside target of 15% at $41.76.
Don't forget, on Thursdays I look at reader-requested symbols, click HERE to send me an email. I read every email I receive and try to answer them all!
Current Market Outlook:
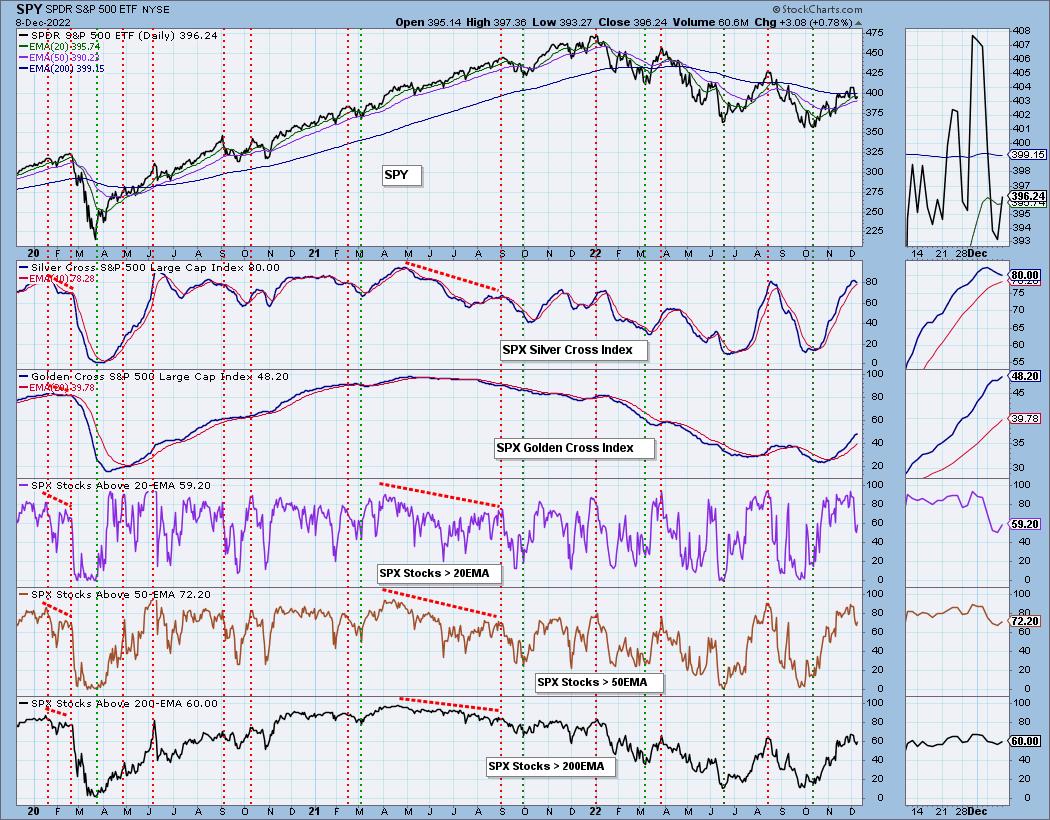
Market Environment: It is important to consider the odds for success by assessing the market tides. The following chart uses different methodologies for objectively showing the depth and trend of participation for intermediate- and long-term time frames.
- The Silver Cross Index (SCI) shows the percentage of SPX stocks on IT Trend Model BUY signals (20-EMA > 50-EMA)
- The Golden Cross Index (GCI) shows the percentage of SPX stocks on LT Trend Model BUY signals (50-EMA > 200-EMA)
Don't forget that as a "Diamonds" member, you have access to our GCI/SCI curated ChartList on DecisionPoint.com. You'll find it under "Members Only" links on the left side on the Blogs and Links Page.
Here is the current chart:
Full Disclosure: I am 10% exposed. Considering SGML, but hate to add to my long exposure. Probably put on ERY as a hedge.
I'm required to disclose if I currently own a stock I mention and/or may buy/short it within the next 72 hours.
"Technical Analysis is a windsock, not a crystal ball." - Carl Swenlin
(c) Copyright 2022 DecisionPoint.com
Watch the latest episode of DecisionPoint with Carl & Erin Swenlin on Mondays 7:00p EST or on the DecisionPoint playlist on the StockCharts TV YouTube channel here!
NOTE: The stocks reported herein are from mechanical trading model scans that are based upon moving average relationships, momentum and volume. DecisionPoint analysis is then applied to get five selections from the scans. The selections given should prompt readers to do a chart review using their own analysis process. This letter is not a call for a specific action to buy, sell or short any of the stocks provided. There are NO sure things or guaranteed returns on the daily selection of "Diamonds in the Rough."
Regarding BUY/SELL Signals: The signal status reported herein is based upon mechanical trading model signals and crossovers. They define the implied bias of the price index/stock based upon moving average relationships and momentum, but they do not necessarily call for a specific action. They are information flags that should prompt chart review. Further, they do not call for continuous buying or selling during the life of the signal. For example, a BUY signal will probably (but not necessarily) return the best results if action is taken soon after the signal is generated. Additional opportunities for buying may be found as price zigzags higher, but the trader must look for optimum entry points. Conversely, exit points to preserve gains (or minimize losses) may be evident before the model mechanically closes the signal.
Helpful DecisionPoint Links:
DecisionPoint Shared ChartList and DecisionPoint Chart Gallery
Price Momentum Oscillator (PMO)
Swenlin Trading Oscillators (STO-B and STO-V)
For more links, go to DecisionPoint.com