
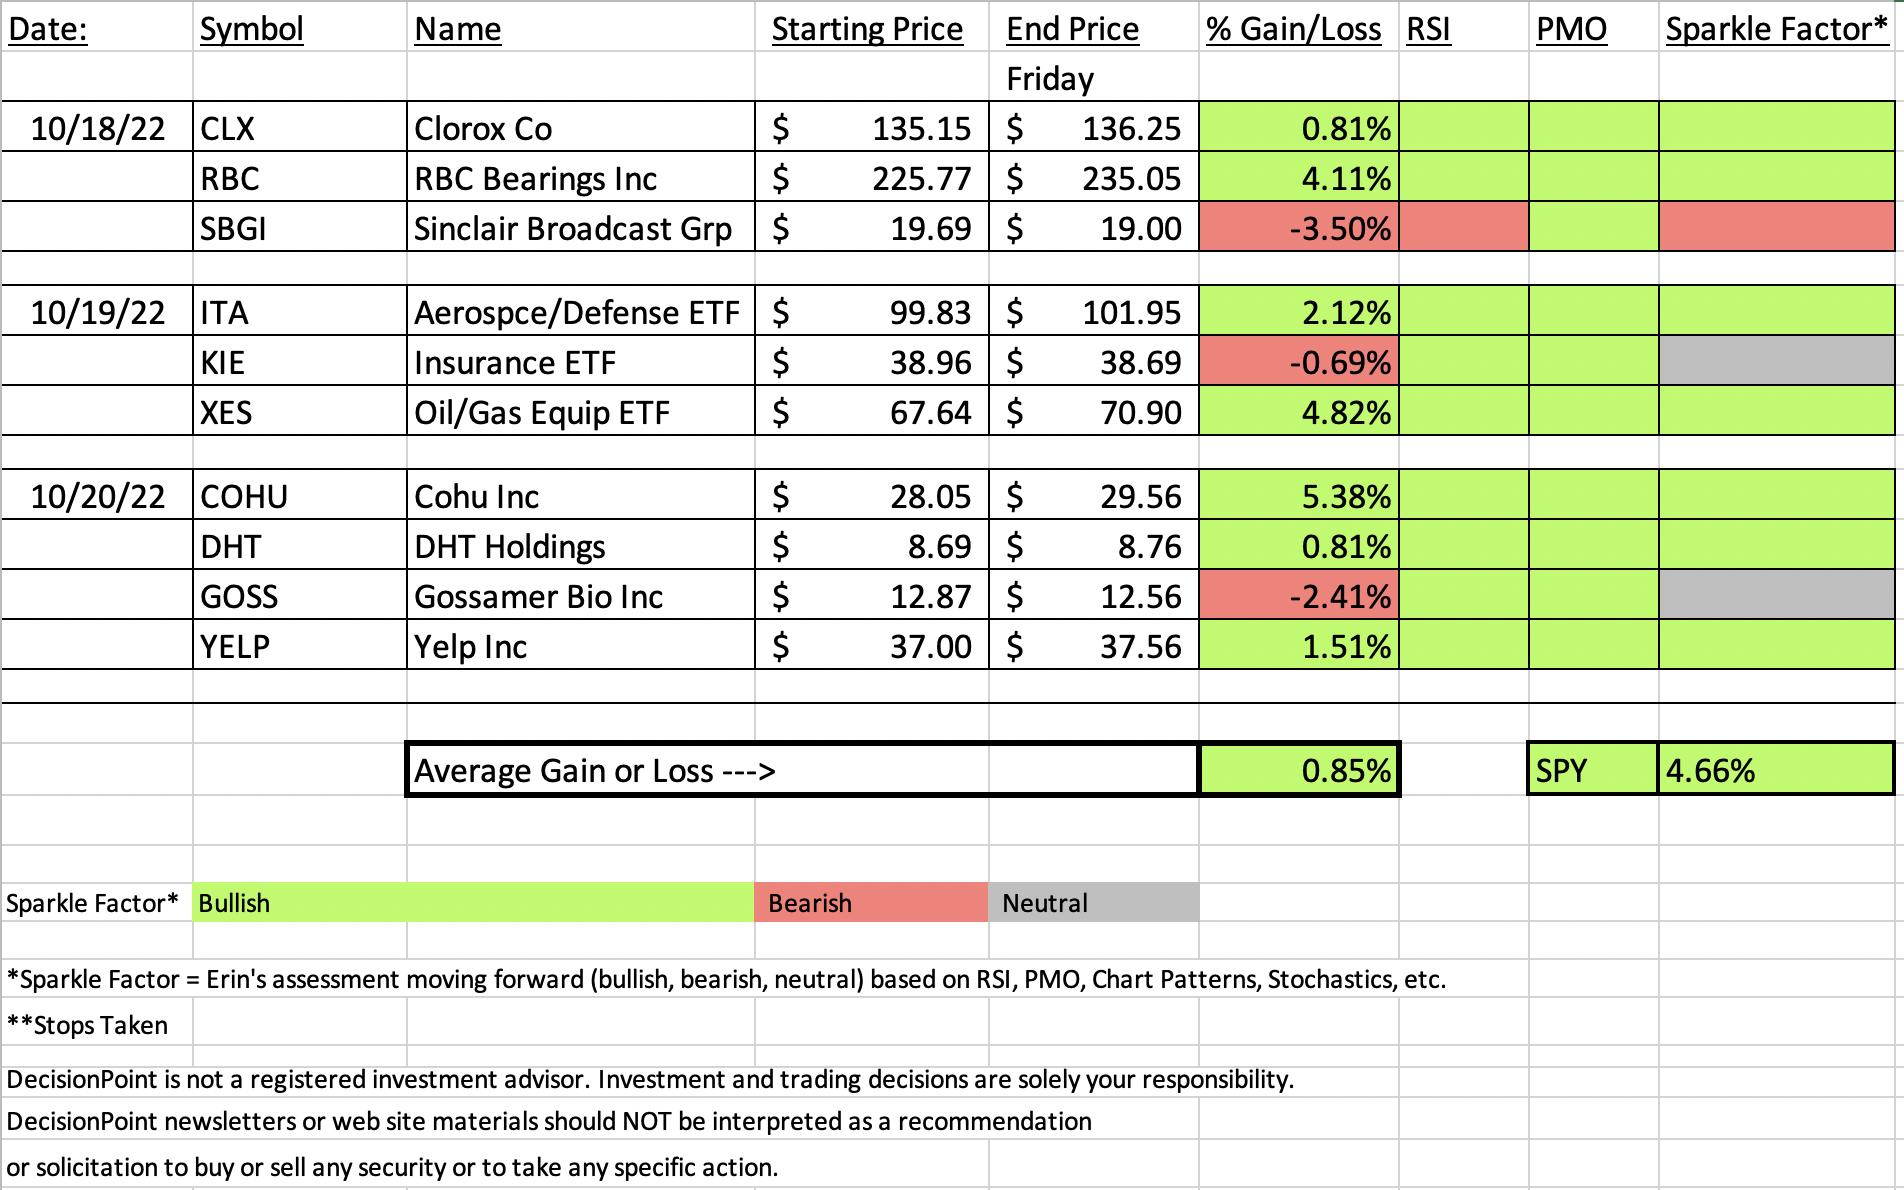
In this morning's Diamond Mine trading room, "Diamonds in the Rough" had 7 out of 10 in the red. By day's end 7 out of 10 were in the green. Overall I'm pleased with the performance of most of them.
You'll note on the spreadsheet that the Sparkle Factor on two of the "Diamonds in the Rough" are neutral and one is bearish. "Neutral" means the stock really could go either way.
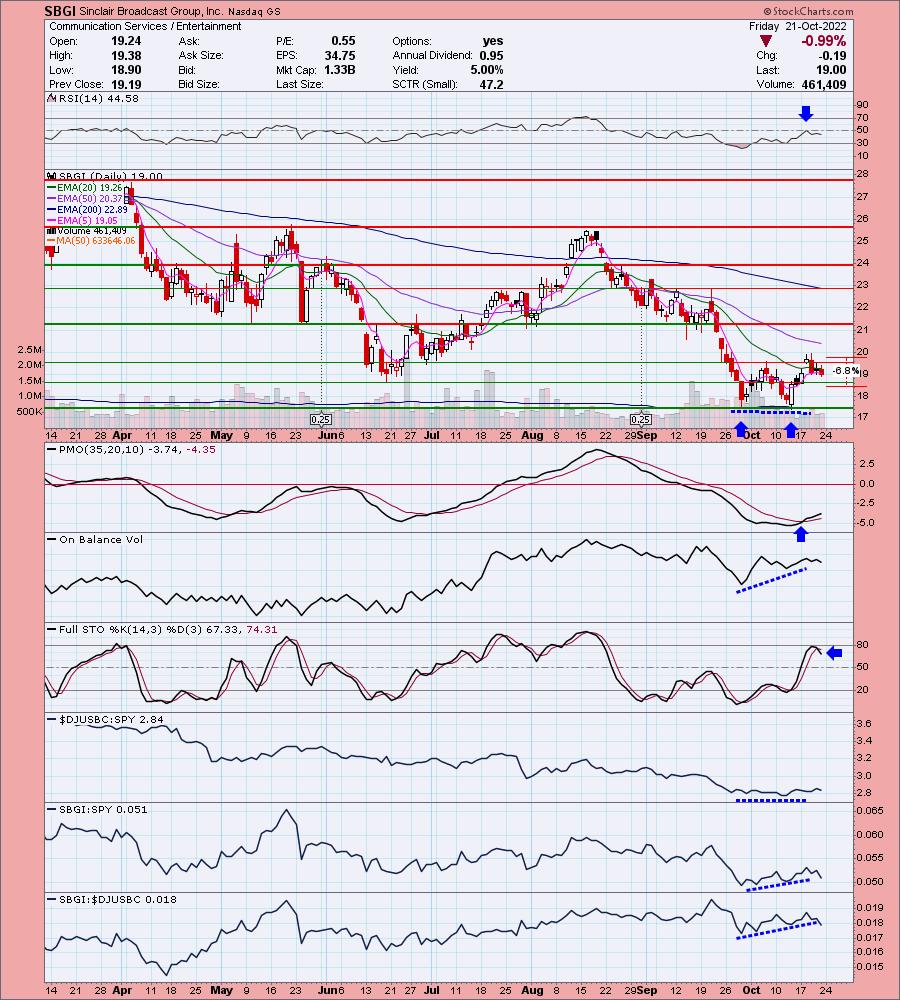
This week's "Dud" turned out to be Sinclair Broadcast Group (SBGI) from the Communication Services (XLC) sector. The setup was pretty good, but we'll discuss possible reasons that the trade went south.
The "Darling" this week was my pick of Cohu Inc (COHU) yesterday. It was Reader Request Day, but I saw COHU and was thoroughly impressed. (Full disclosure: I own it.)
The sector and industry groups to watch shouldn't surprise those in today's trading room nor those who haven't watched it. Energy has been holding its own despite a lackluster performance by Crude Oil. The industry group I like best is Oil Equipment & Services. I presented the ETF Wednesday. However, it is quite overbought, so I picked Exploration & Production as the industry to watch.
The link for today's Diamond Mine recording is below the diamonds logo.
Have a great weekend!
Good Luck & Good Trading,
Erin

TODAY'S RECORDING LINK (9/30/2022):
Topic: DecisionPoint Diamond Mine (9/30/2022) LIVE Trading Room
Start Time: Sept 30, 2022 09:00 AM
Passcode: Oct-21st
NEXT DIAMOND MINE Trading Room on October 28th
When: Oct 28, 2022 09:00 AM Pacific Time (US and Canada)
Topic: DecisionPoint Diamond Mine (10/28/2022) LIVE Trading Room
Register in advance for this webinar HERE.
Save the registration confirmation email with login instructions in case Zoom doesn't notify you in time.

Our latest DecisionPoint Trading Room recording:
A few items about the spreadsheet: I've put on the spreadsheet whether the RSI is positive (green) or negative (red). The PMO column tells you if it is rising (green) or falling (red). Finally I've added my own "Sparkle Factor" that gives you my assessment going forward, bullish (green), bearish (red) or neutral (gray). The Sparkle Factor is basically my thoughts on whether I expect it to rise or fall. A neutral means it could really go either way so it could be added to a watch list. If you're in a stock I consider "neutral" going forward, the ball is in your court.
Darling:
Cohu, Inc. (COHU)
EARNINGS: 10/27/2022 (AMC)
Cohu, Inc. engages in the provision of back-end semiconductor equipment and services. It offers test and handling capital equipment, interface products, and related services to the semiconductor and electronics manufacturing industries. It operates through the Semiconductor Test and Inspection, and Printed Circuit Board Test segments. The company was founded in 1947 and is headquartered in Poway, CA.
Predefined Scans Triggered: Bullish MACD Crossovers, Moved Above Ichimoku Could and Parabolic SAR BUY Signals.
Below are the commentary and chart from 10/20:
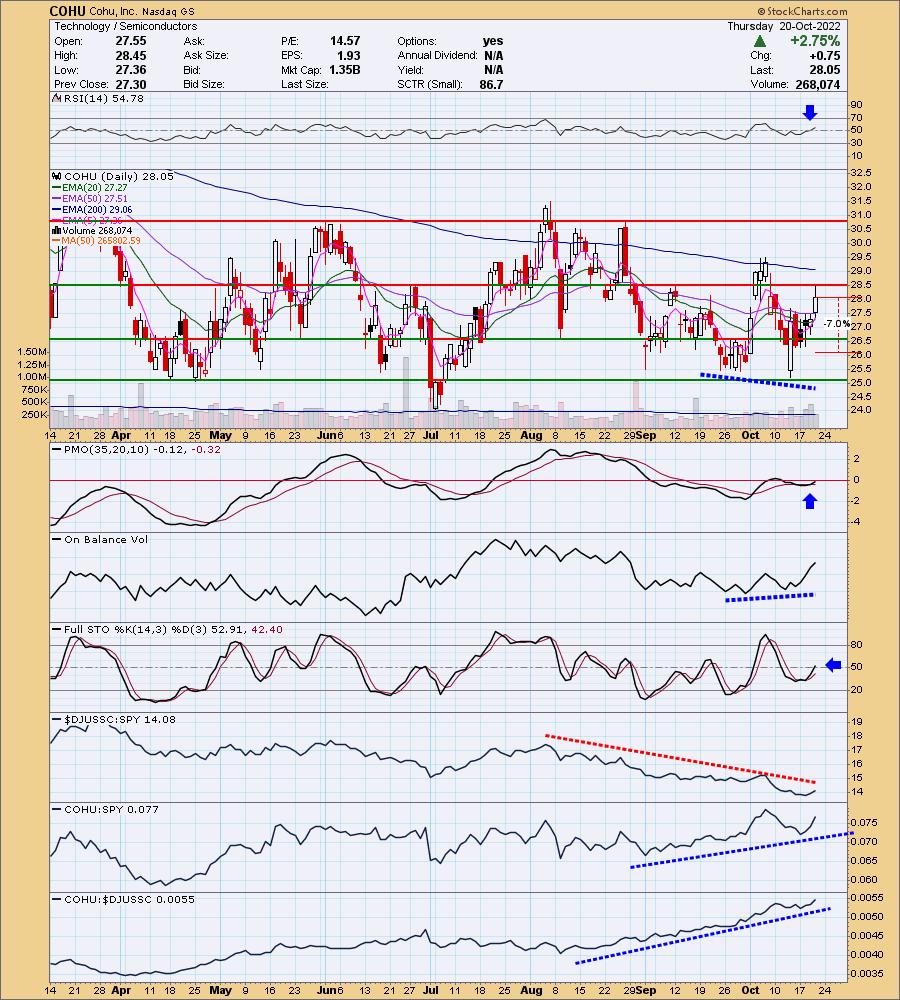
"COHU is down -1.07% in after hours trading. This is my one selection. Lam Research (LRCX) had a huge day up over 7.5%. Many of the semiconductors followed suit including COHU. I would say my one problem with this one is the volatility and sideways trading range, but the rest of the chart looks good. I like the newly positive RSI and PMO whipsaw BUY signal. The PMO should get above zero soon. There is a lovely positive OBV divergence with price lows and Stochastics are healthy. The one problem is that the industry group itself needs to kickstart its performance. Still COHU is doing just fine against the SPY in spite of the group's struggles. I've set the stop at 7% below the the August low at $26.08."
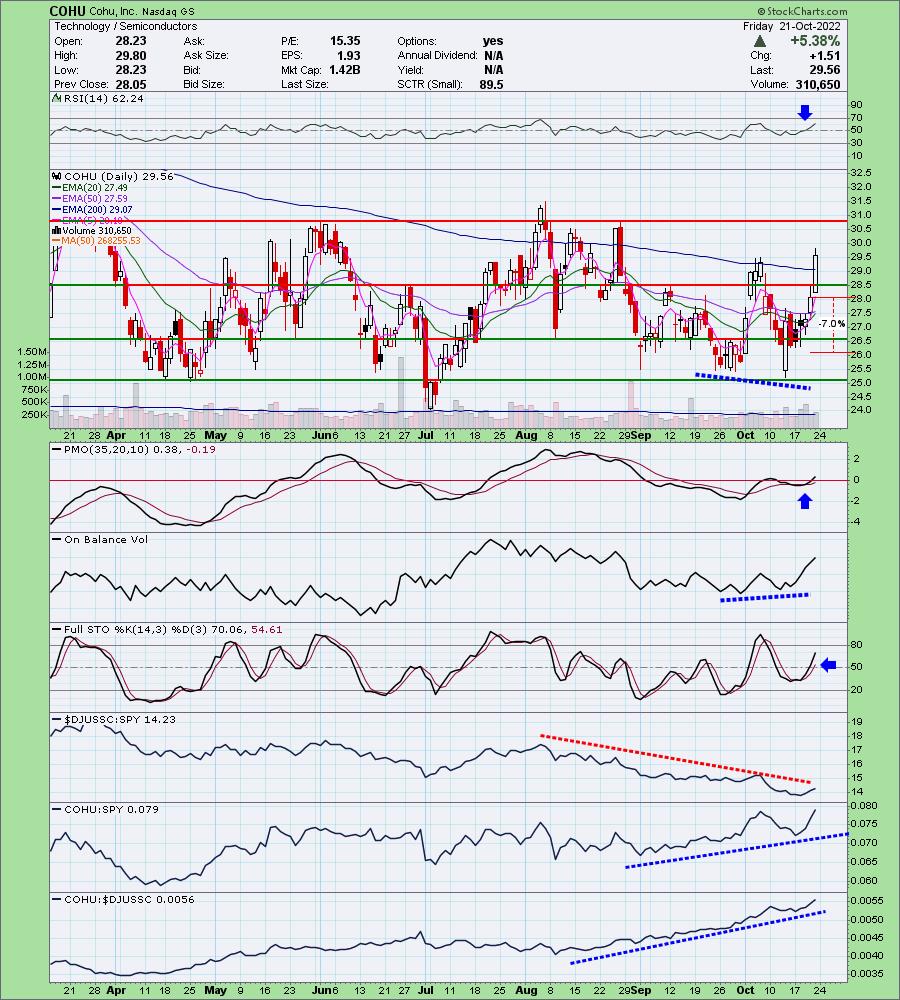
Here is today's chart:
I knew this one had a great setup, but today's rocket higher was unexpected. Price has a decisive 3% plus breakout that implies followthrough on today's big rally move. Typically we will see price pull back toward the breakout area, but this one is looking like a "winner that will keep on winning". The PMO is now above the zero line and I love that it nor the RSI are overbought yet. More upside seems likely.
Don't forget, on Thursdays I look at reader-requested symbols, so shoot me an email at erin@decisionpoint.com. I read every email I receive and try to answer them all!
Dud:
Sinclair Broadcast Group, Inc. (SBGI)
EARNINGS: 11/2/2022 (BMO)
Sinclair Broadcast Group, Inc. is a media company engaged in the provision of local sports and news. It operates through the following segments: Broadcast, Local Sports, and Others. The Broadcast segment consists of television stations which offer programming and operating services, and sales and other non-programming operating services. The Local Sports segment consists of regional sports networks, the Marquee Sports Network, Yankee Entertainment, and Sports Network LLC. The company was founded by Julian Sinclair Smith in 1986 and is headquartered in Hunt Valley, MD.
Predefined Scans Triggered: Declining Chaikin Money Flow.
Below are the commentary and chart from 10/18:
"SBGI is down -0.91% in after hours trading. I picked this one for a few reasons. First we have a bullish double-bottom confirmed on a breakout above the confirmation line and the 20-day EMA. Second, there is an OBV positive divergence between price lows and OBV bottoms. Additionally, the PMO just triggered a crossover BUY signal and Stochastics are rising strongly. The rub is that the group isn't performing well. It is performing inline with the SPY right now which I don't like in a bear market, but with the market reversing, performing as well as the SPY will likely be a good thing. The stop is set at 7%, just below the June low, around $18.31."
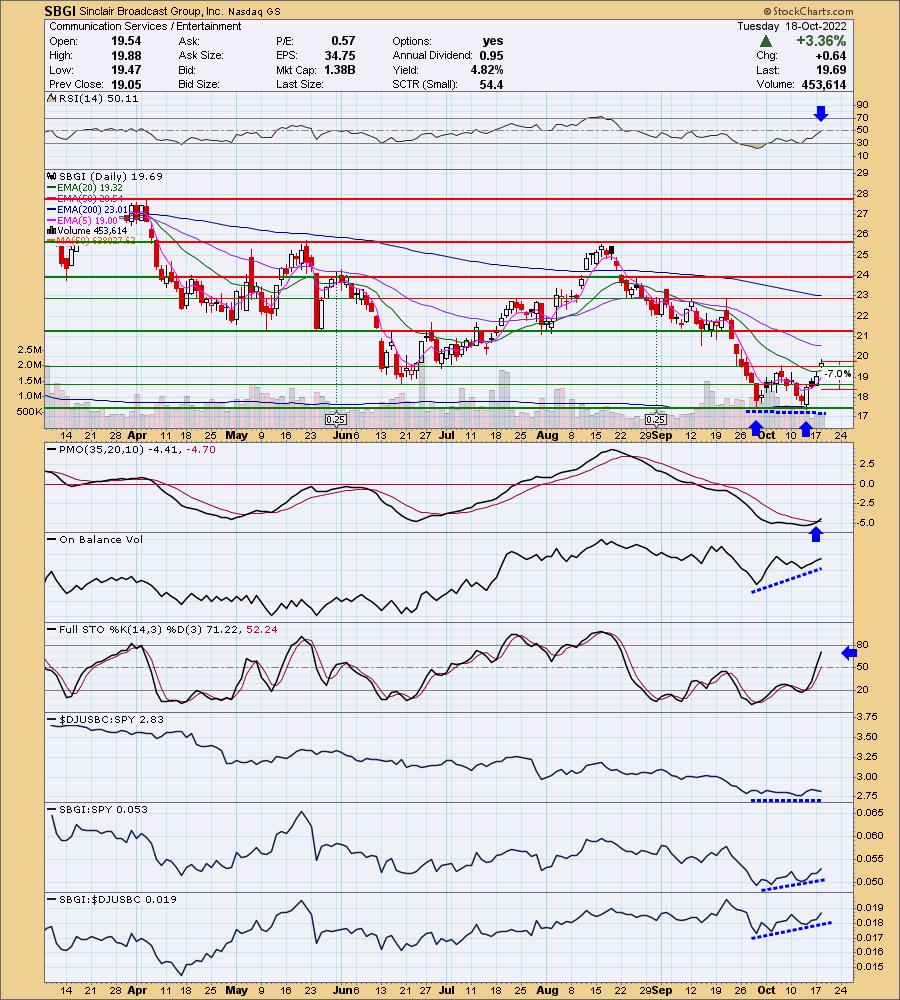
Here is today's chart:
I've studied the chart above and I really can't find anything that would point to the rally failure. The group hasn't been performing all that well, SBGI has been. It is just one of those anomalies and something that proves that technical analysis doesn't always work. At this point, the chart isn't terrible, but as I often say in the trading rooms, there are better choices out there.
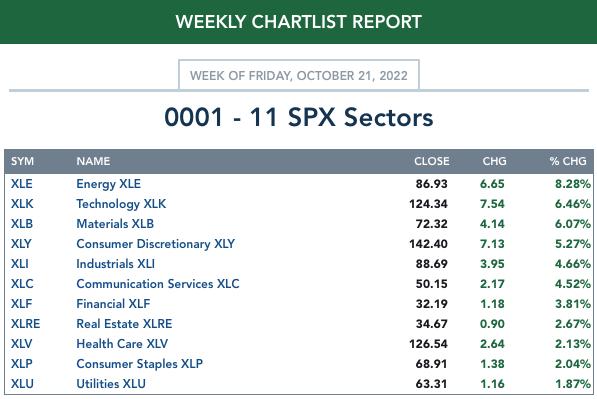
THIS WEEK's Sector Performance:
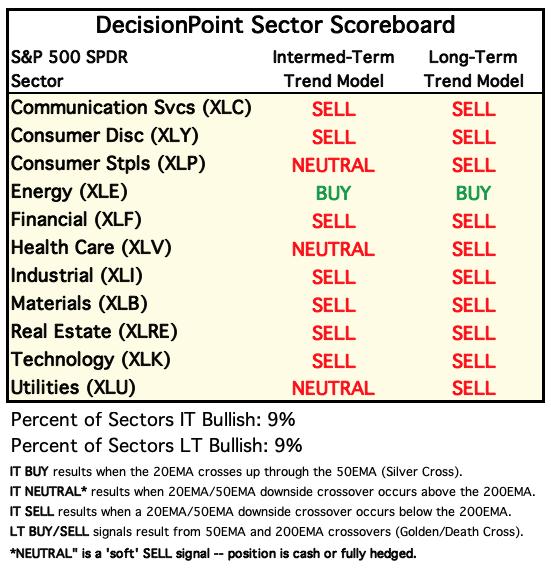
DecisionPoint Sector Scoreboard (Mechanical Trend Model Signals):
Click Here to view Carl's annotated Sector ChartList!
RRG® Daily Chart ($ONE Benchmark):
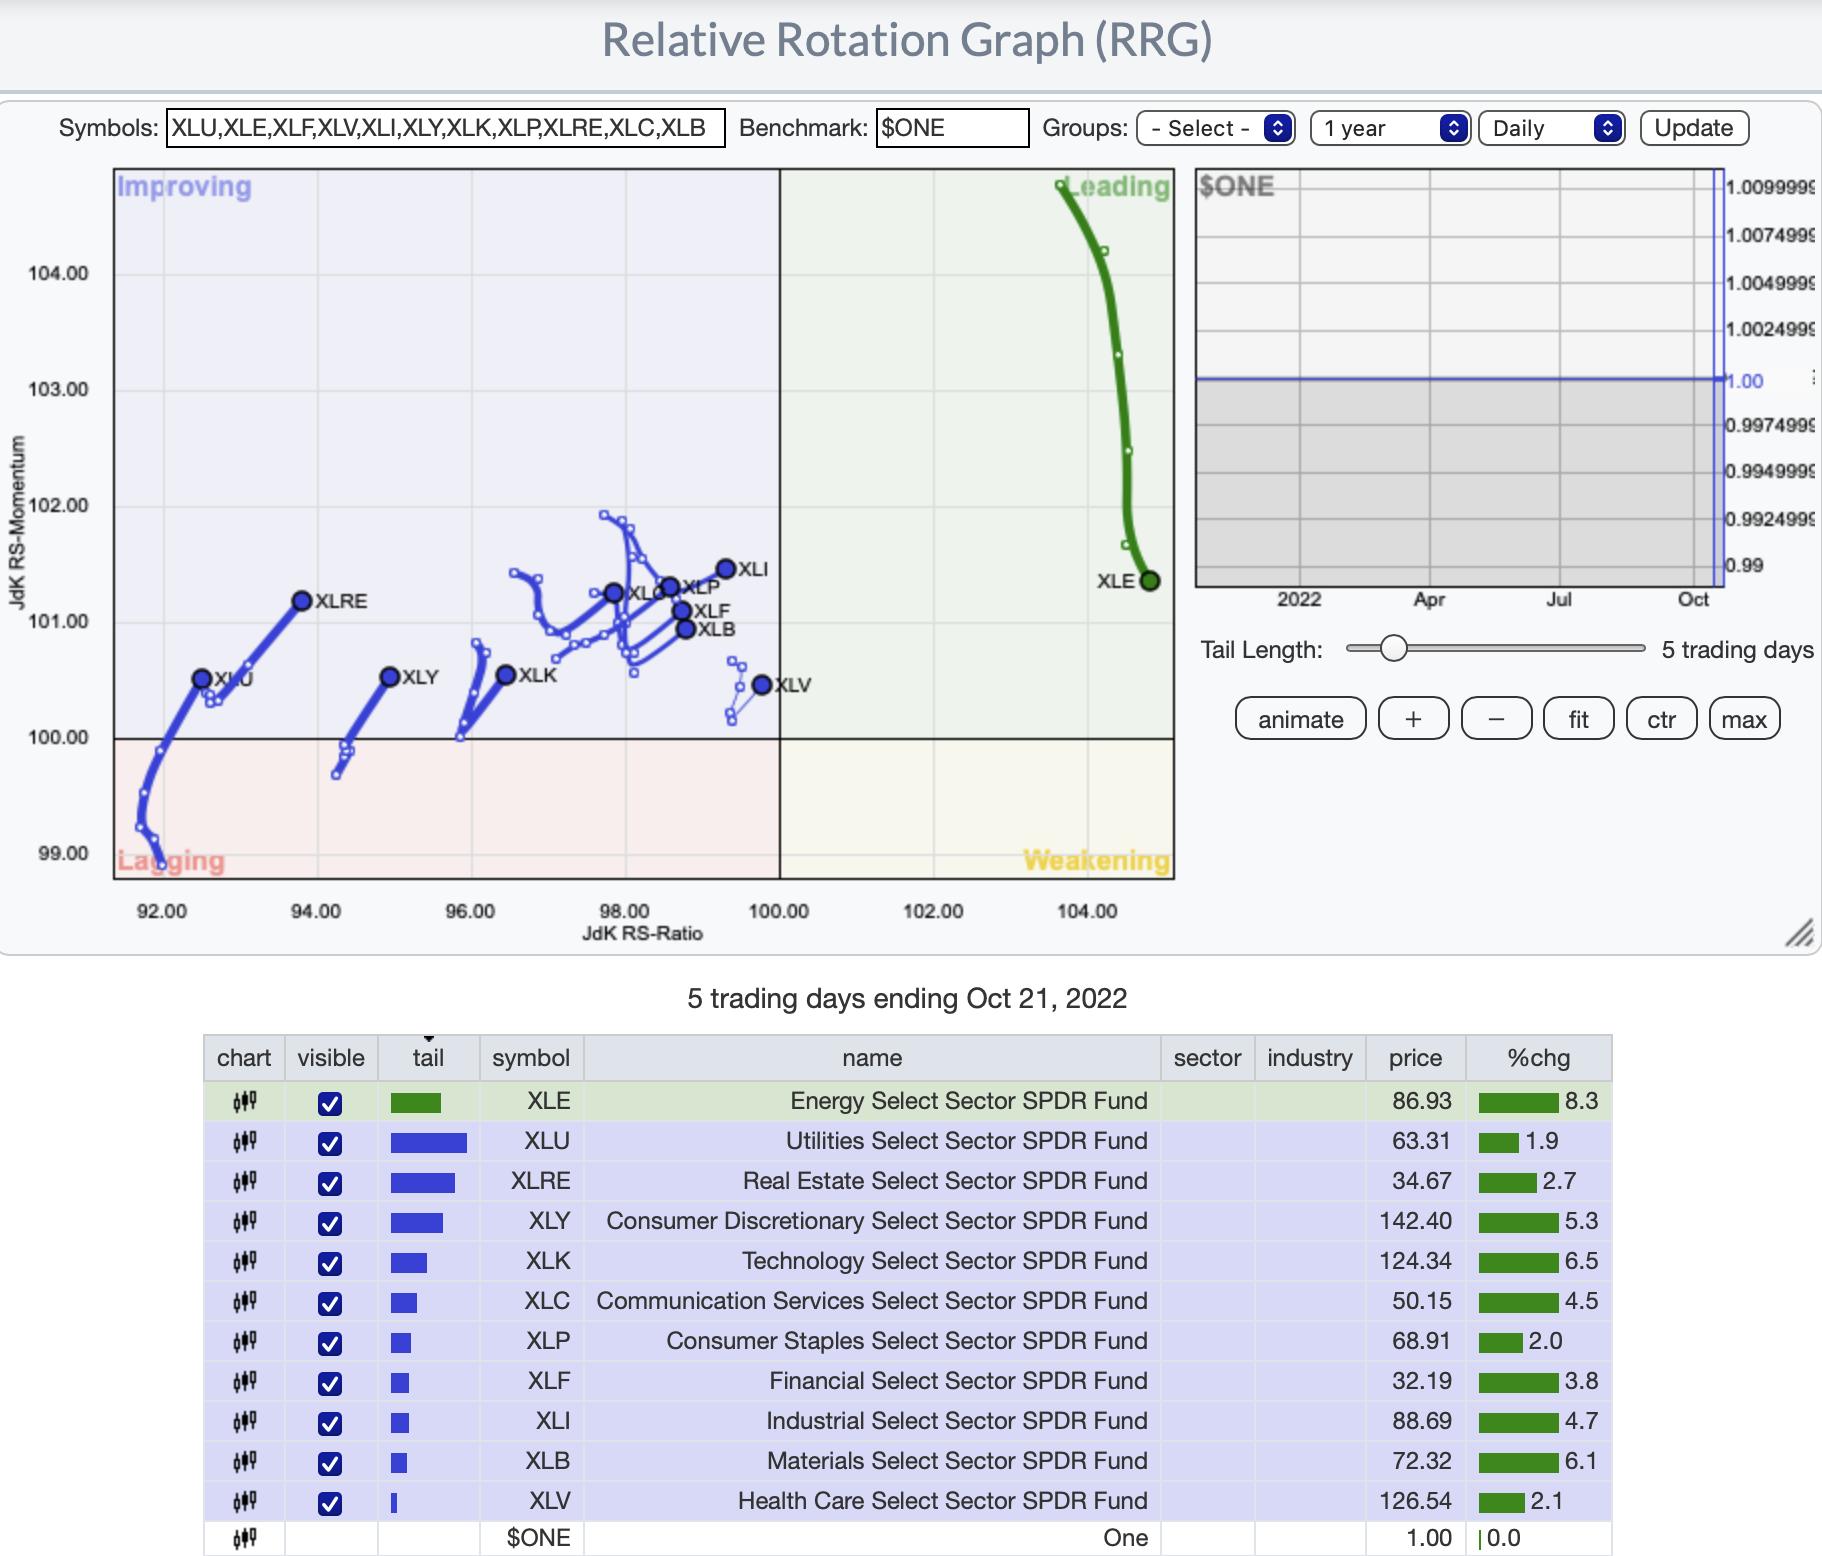
Interestingly, all of the sectors except XLE have bullish northeast headings on the short-term daily RRG. While XLE is falling, it is on the right side of the chart where it has a bullish configuration. It is also still firmly in the Leading quadrant.
This RRG tells us in the short term, there is a big reversal and turnaround occurring. This fits well into our stance that we are on our way to a bear market rally.
RRG® Weekly Chart ($ONE Benchmark):
The weekly RRG tells us that this rally is indeed a "bear market rally". The sectors are still underperforming. Every sector except Energy (XLE) has bearish southwest headings. XLF is in the Improving quadrant, but it is far from improving right now as it nears the Lagging quadrant.
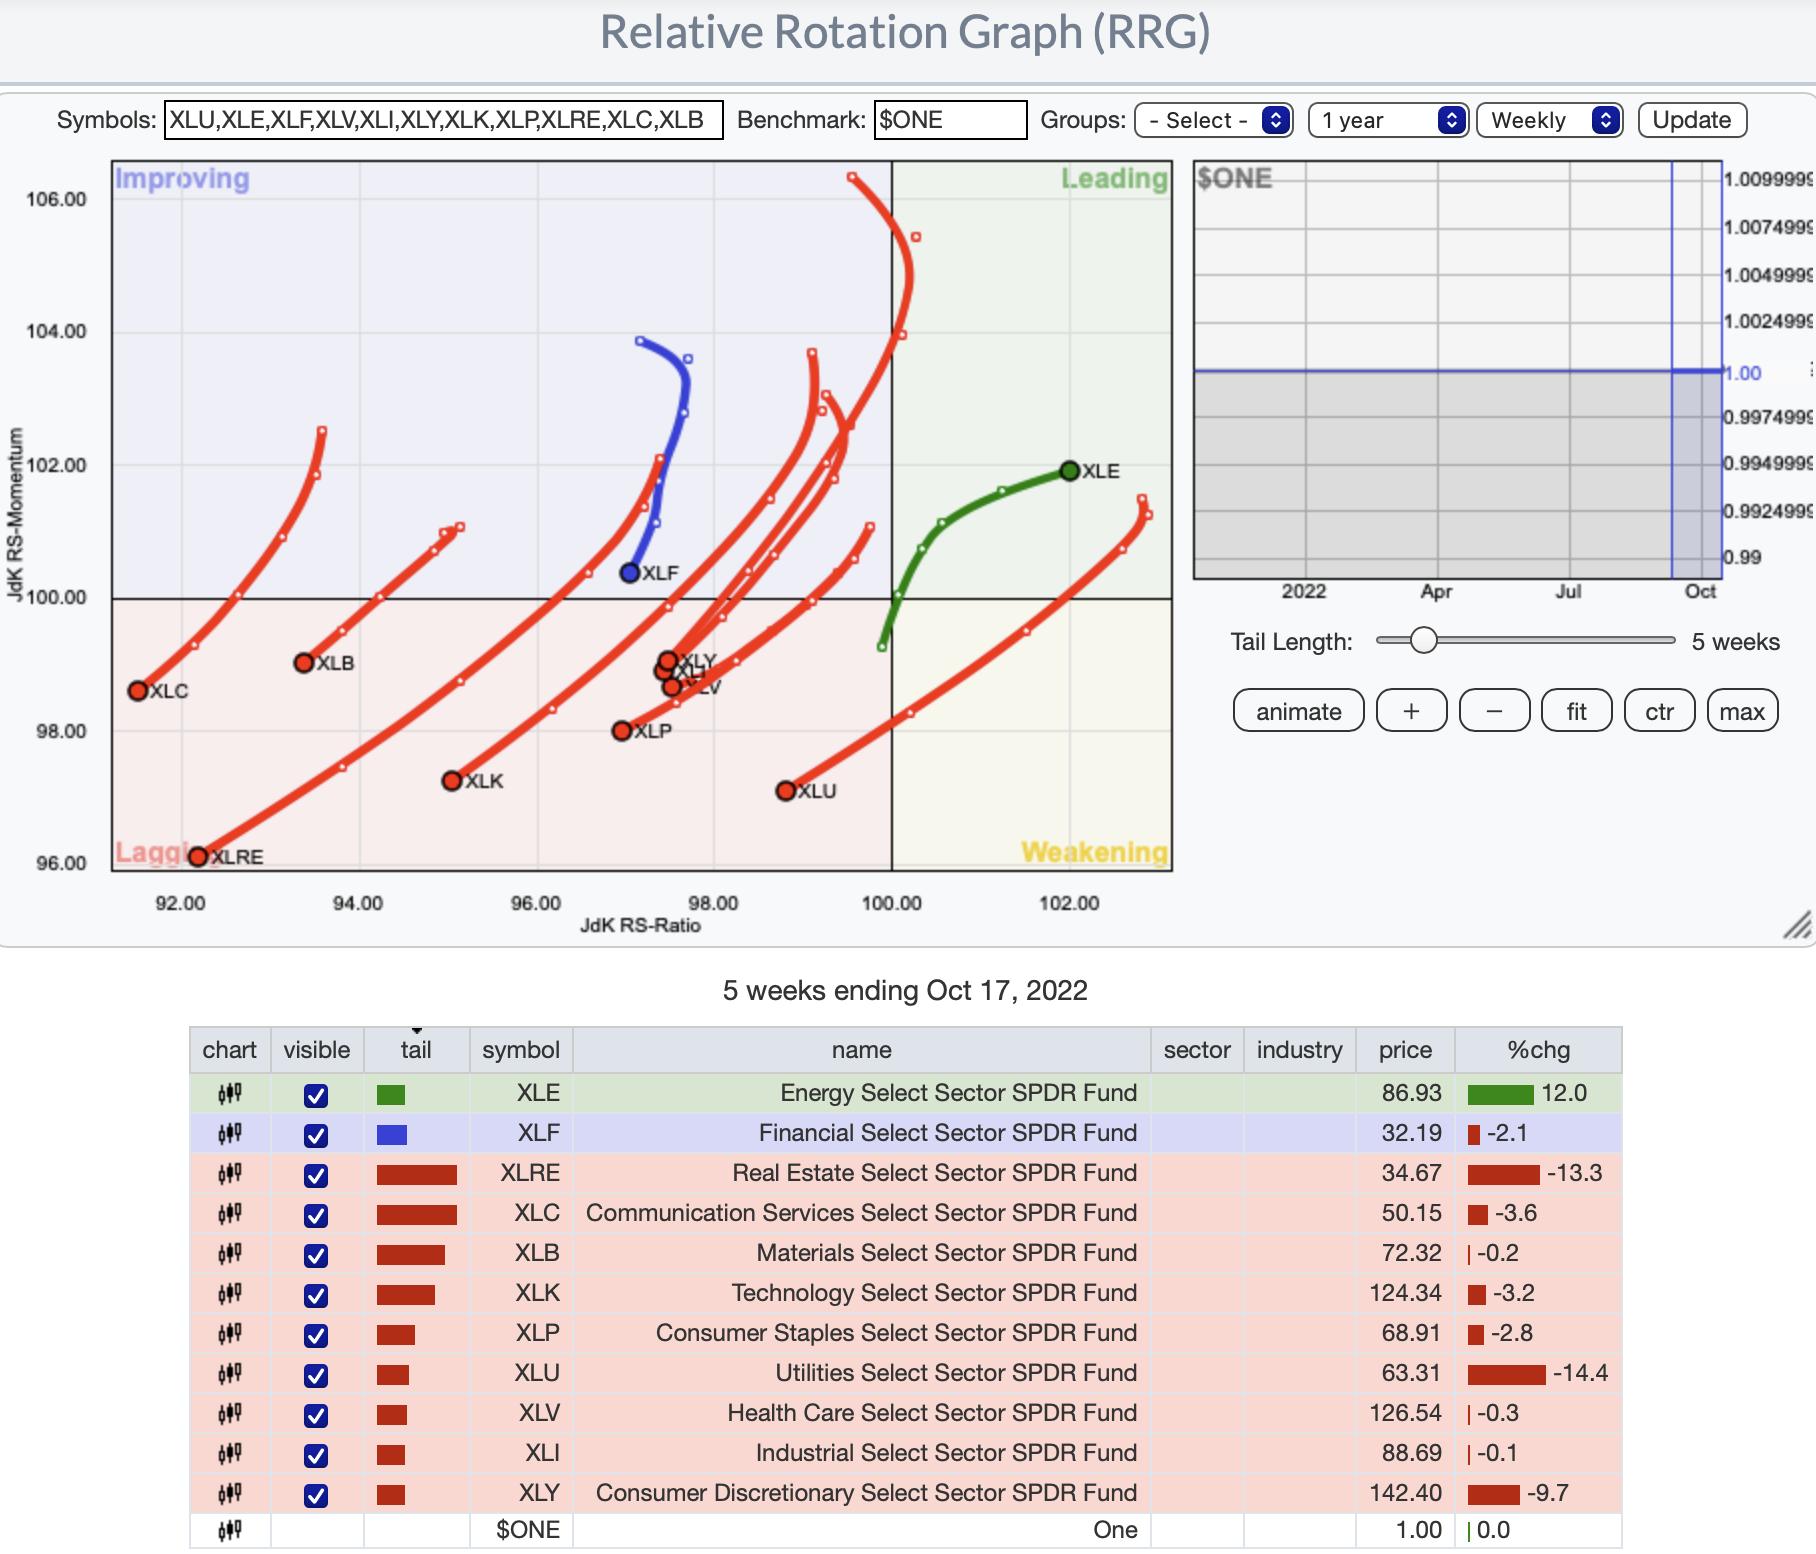
RRG® charts show you the relative strength and momentum for a group of stocks. Stocks with strong relative strength and momentum appear in the green Leading quadrant. As relative momentum fades, they typically move into the yellow Weakening quadrant. If relative strength then fades, they move into the red Lagging quadrant. Finally, when momentum starts to pick up again, they shift into the blue Improving quadrant.
CLICK HERE for an animated version of the RRG charts.
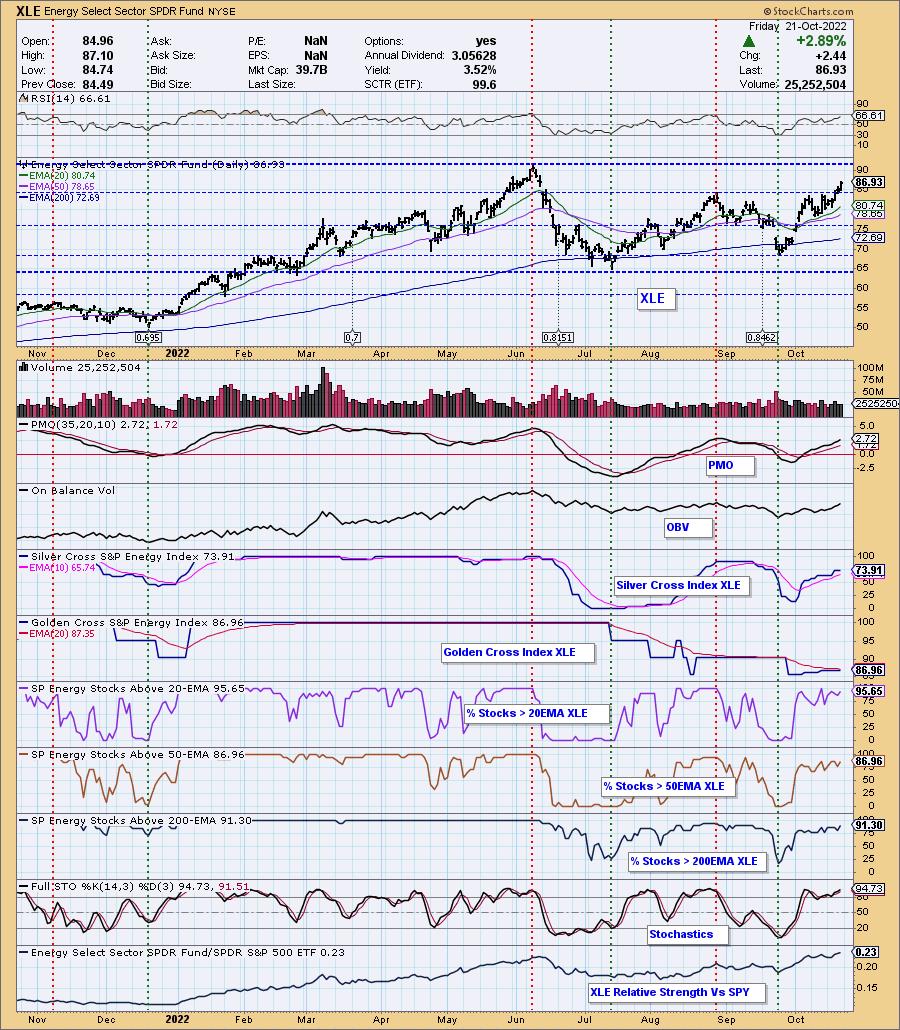
Sector to Watch: Energy (XLE)
XLE was an easy pick this week, but Technology wasn't far behind. XLE has that beautiful breakout accompanied by rising but not overbought RSI and PMO. The OBV is rising and therefore confirming the current rally. Participation, even through the consolidation of prior weeks has stayed steady. Crude Oil may be struggling a bit right now, but XLE is not. Stochastics are oscillating above 80 which confirms price strength.
Industry Group to Watch: Exploration & Production (IEO)
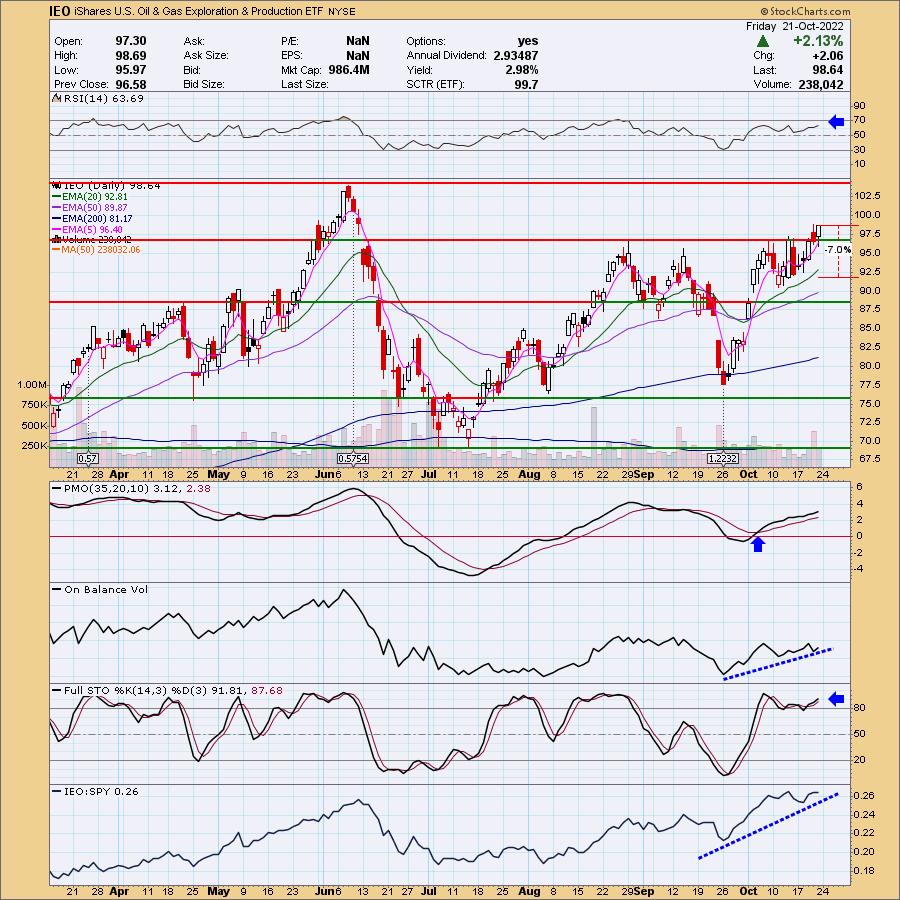
Rather than use the industry group chart, I opted to show the iShares ETF as it can be traded. This is also why I put a stop level on the chart. The chart is similar to XLE's with a nice breakout and similar indicator configuration. Certainly overhead resistance is close by, but IEO, like XES (which I own) look strong enough to overcome.
Some of the names we came up during the Diamond Mine in this industry were COP, HES, MUR and of course, XOM.
Go to our Sector ChartList on DecisionPoint.com to get an in-depth view of all the sectors. On StockCharts.com you can find the Industry Summary.
Have a great weekend! Good Luck & Good Trading!
- Erin
erin@decisionpoint.com
Full Disclosure: I'm 35% exposed with a 2.5% hedge.
Watch the latest episode of DecisionPoint with Carl & Erin Swenlin on Mondays 7:00p EST or on the DecisionPoint playlist on the StockCharts TV YouTube channel here!
Technical Analysis is a windsock, not a crystal ball. --Carl Swenlin
NOTE: The stocks reported herein are from mechanical trading model scans that are based upon moving average relationships, momentum and volume. DecisionPoint analysis is then applied to get five selections from the scans. The selections given should prompt readers to do a chart review using their own analysis process. This letter is not a call for a specific action to buy, sell or short any of the stocks provided. There are NO sure things or guaranteed returns on the daily selection of "diamonds in the rough."
Helpful DecisionPoint Links:
DecisionPoint Shared ChartList and DecisionPoint Chart Gallery
Price Momentum Oscillator (PMO)
Swenlin Trading Oscillators (STO-B and STO-V)
(c) Copyright 2022 DecisionPoint.com