
Today is a bonus Diamonds Report for ETF Day. As I often say, I do not present stocks/ETFs that I wouldn't consider for my own portfolio. This has been a great week to start expanding my exposure. I missed sharing three picks with you yesterday, so today I have six picks and I own them all. It is ETF Day so three of these picks are ETFs while the others are stocks. As with all "Diamonds in the Rough" these are not guaranteed winners, but they appeared in my scans and the setups were good enough for me to add these this week. Remember, I do not send SELL alerts so you're on your own there. Watch for topping PMOs and negative RSIs, etc. If the chart goes south before the stop is hit, there's no real reason to hang onto it.
I dropped my hedges today so there isn't a safety net right now, but I like what is happening in the overall market.
Remember tomorrow is Reader Request Day so send in the symbols you would be interested in having me review. If yours is not picked, I'll save them for Friday's Diamond Mine trading room!
Good Luck & Good Trading!
Erin
Today's "Diamonds in the Rough": CHPT, GDX, IGN, RIO, RLAY and TAN.

We didn't have a Diamond Mine trading room last week due to my appearance at ChartCon so here is the prior link:
RECORDING LINK (10/21/2022):
Topic: DecisionPoint Diamond Mine (10/21/2022) LIVE Trading Room
Passcode: Oct-21st
REGISTRATION LINK (10/28/2022):
When: Oct 28, 2022 09:00 AM Pacific Time (US and Canada)
Topic: DecisionPoint Diamond Mine (10/28/2022) LIVE Trading Room
Register in advance for this webinar HERE
After registering, you will receive a confirmation email containing information about joining the webinar.

Here is the Monday 10/24 recording:
Welcome to DecisionPoint Diamonds, wherein I highlight ten "Diamonds in the Rough" per week. These are selected from the results of my DecisionPoint Scans which search for stocks that could benefit from the trend and condition of the market. Remember, these are not recommendations to buy or sell, but are the most interesting of the stocks that surfaced in my scans. My objective is to save you the work of the initial, tedious culling process, but you need to apply your own analysis to see if these stocks pique your interest as well. There are no guaranteed winners here!
"Predefined Scans Triggered" are taken from StockCharts.com using the "Symbol Summary" option instead of a "SharpChart" on the workbench.
ChargePoint Holdings, Inc. (CHPT)
EARNINGS: 12/7/2022 (AMC)
ChargePoint Holdings, Inc. operates as an electric vehicle charging network provider. It designs, develops and markets networked electric vehicle charging system infrastructure and its Cloud Services enable consumers the ability to locate, reserve, authenticate and transact electric vehicle charging sessions. The firm provides an open platform providing real-time information about charging sessions and control, support and management of the networked charging systems. This network provides multiple web-based portals for charging system owners, fleet managers, drivers and utilities. The company was founded in 2007 and is headquartered in Campbell, CA.
Predefined Scans Triggered: Elder Bar Turned Green and Bullish MACD Crossovers.
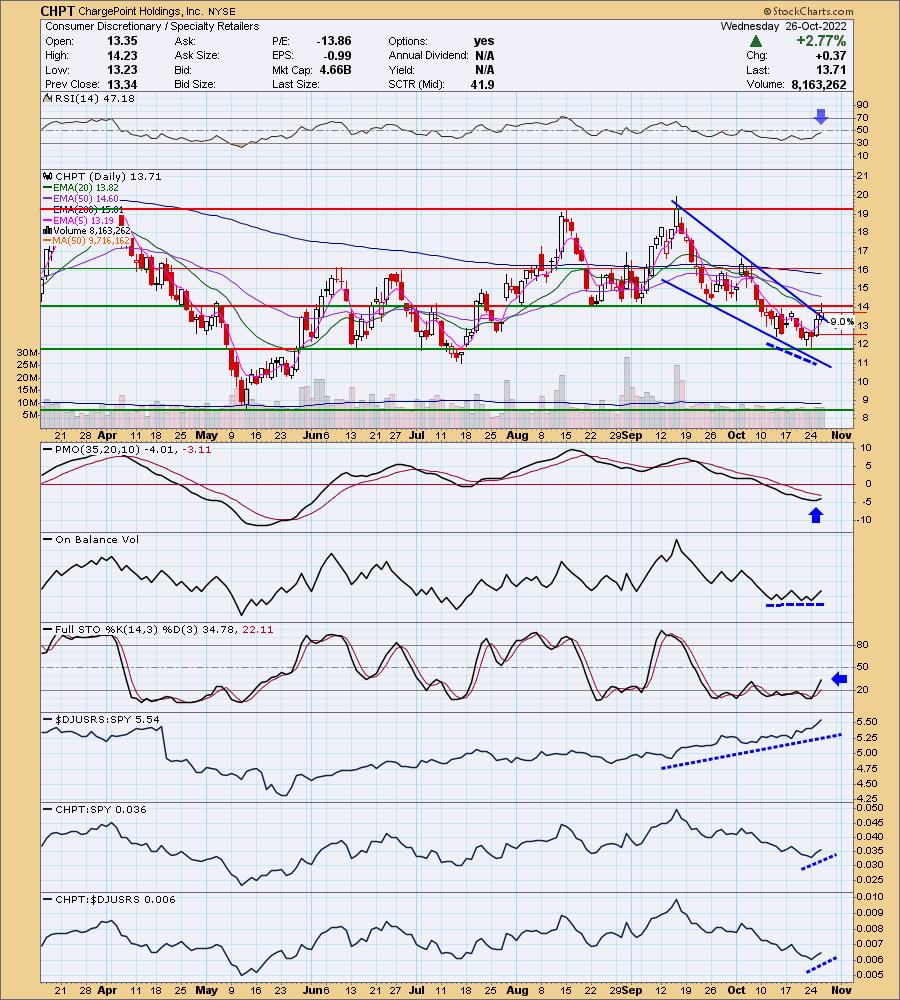
CHPT is up +0.36% in after hours trading. Price just broke out of a bullish falling wedge. Price is still stuck beneath resistance, but the indicators are beginning to shape up. The RSI is rising, though not quite positive. The PMO is turning back up in oversold territory. There is a positive OBV divergence with price lows. Stochastics are rising nicely and with purpose now. The group is definitely enjoying outperformance. CHPT hasn't held leadership within the group or even against the SPY, but that is slowly changing. This company is involved in building charge stations for EVs. More of them are sorely needed. The stop is rather deep at 9% (around $12.47), but after a +2.77% rise today, it was really necessary.
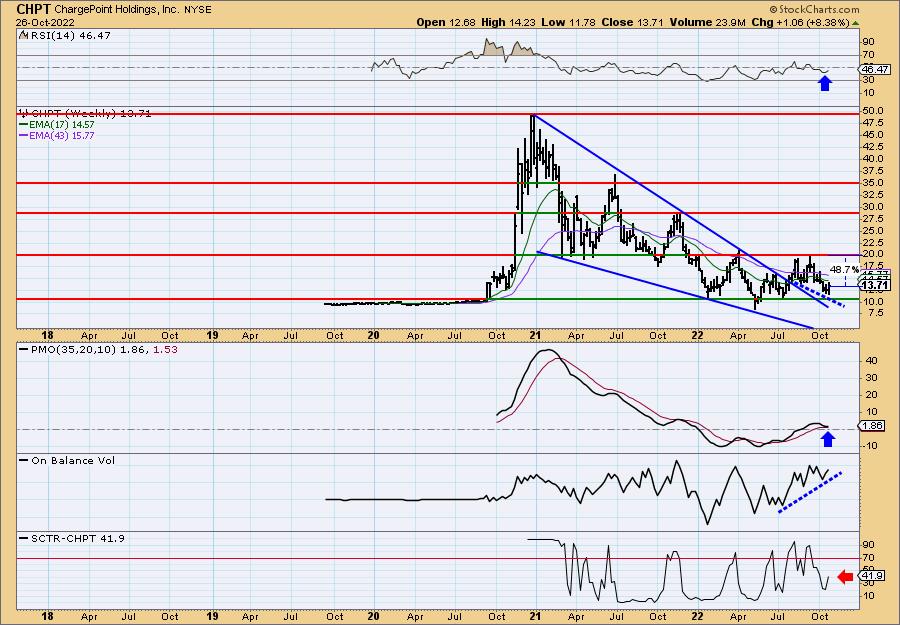
This is admittedly one of the weakest weekly charts you'll find in today's report. This is a bit of a risk, but the upside potential is incredible and for me worth the short-term risk. The weekly RSI is negative, but rising. The weekly PMO is still on a BUY signal but very close to a crossover SELL. One good thing is that the weekly PMO has decelerated and could end up turning up above the signal line or see a whipsaw back to a BUY. Upside potential if it just reaches its first area of overhead resistance is over 48%.
VanEck Vectors Gold Miners ETF (GDX)
EARNINGS: N/A
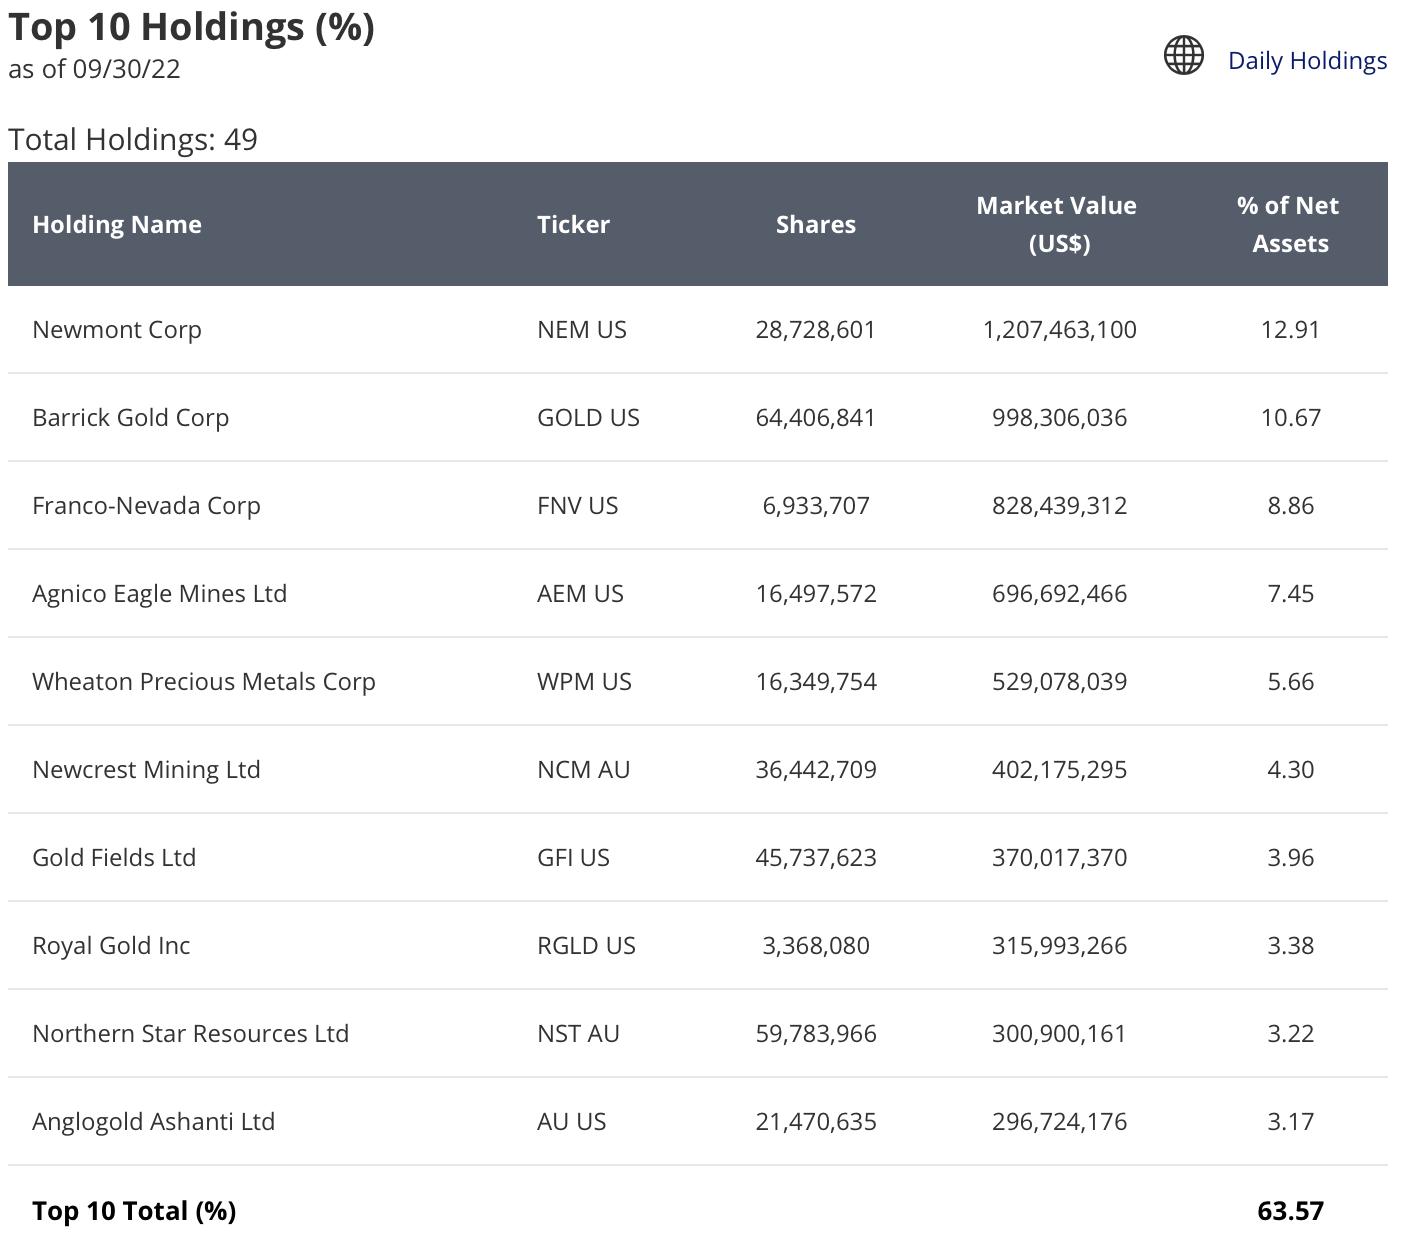
GDX tracks a market-cap-weighted index of global gold-mining firms. Click HERE for more information.
Predefined Scans Triggered: Entered Ichimoku Cloud.
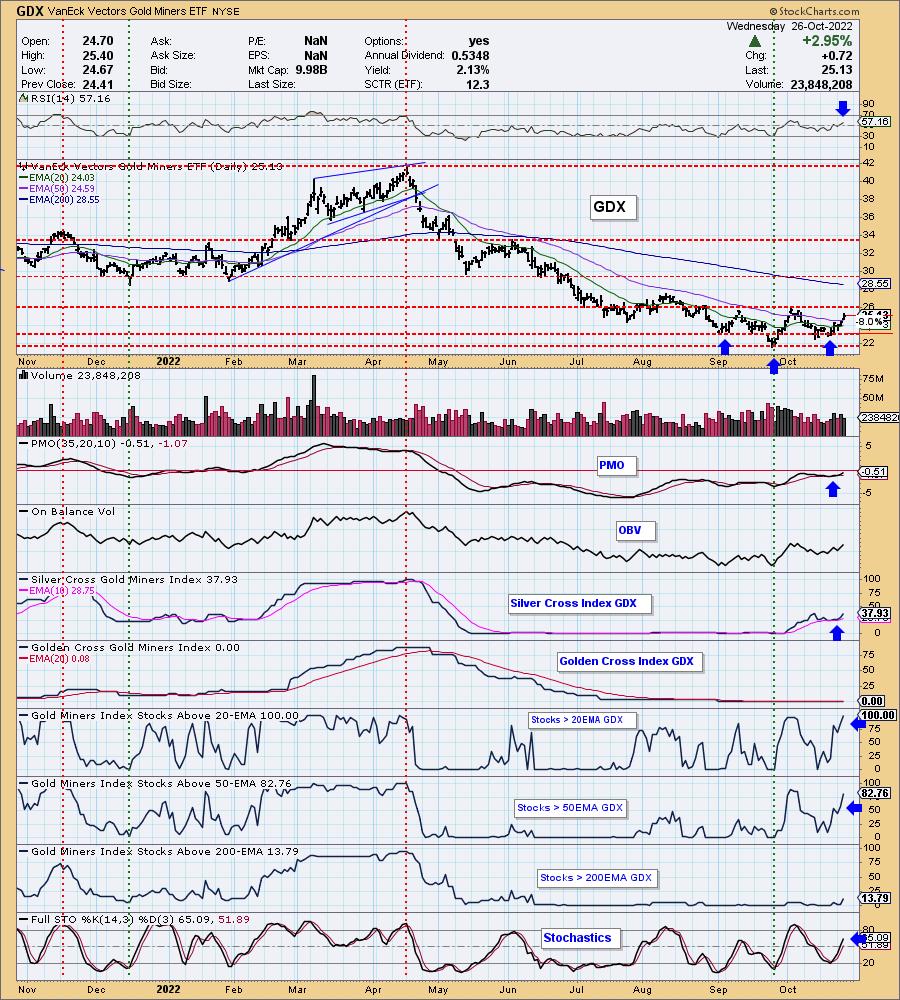
GDX is up +0.08% in after hours trading. This looks like a rally that will get legs. Gold is forming a bullish double-bottom and the market is rallying. Both are excellent indications that GDX will rally in the short term. There is a bullish reverse head and shoulders building that will be confirmed with a breakout above overhead resistance at $26.00. The minimum upside target of the pattern would take price to $30. The RSI is positive and rising. The PMO is rising on a crossover BUY signal. We have the benefit of an "under the hood" chart for Gold Miners. We can see a pivotal move by the Silver Cross Index as it accelerates higher. We now have 100% of stocks above their 20-day EMAs. That's convincing to me. Stochastics are rising in confirmation as well. The stop is set at 8% or $23.12. If you want, you could set it lower below the early September low.
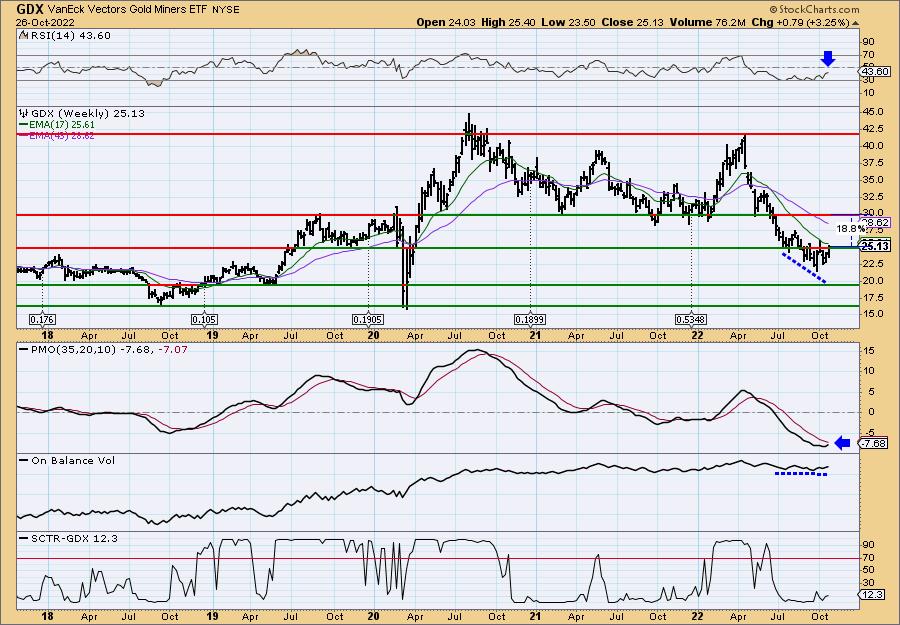
The weekly chart is great. The RSI, while negative, is in a rising trend. The weekly PMO is turning up and we have a positive divergence between the OBV and price lows. Technically OBV bottoms declined a bit, but given the steepness of price lows, we're calling it a positive divergence. The SCTR is terrible, but this group has been very beat down. I've only marked upside potential at 18.8%, but a breakout is highly likely should it get back to that level.
iShares North American Tech-Multimedia Networking ETF (IGN)
EARNINGS: N/A
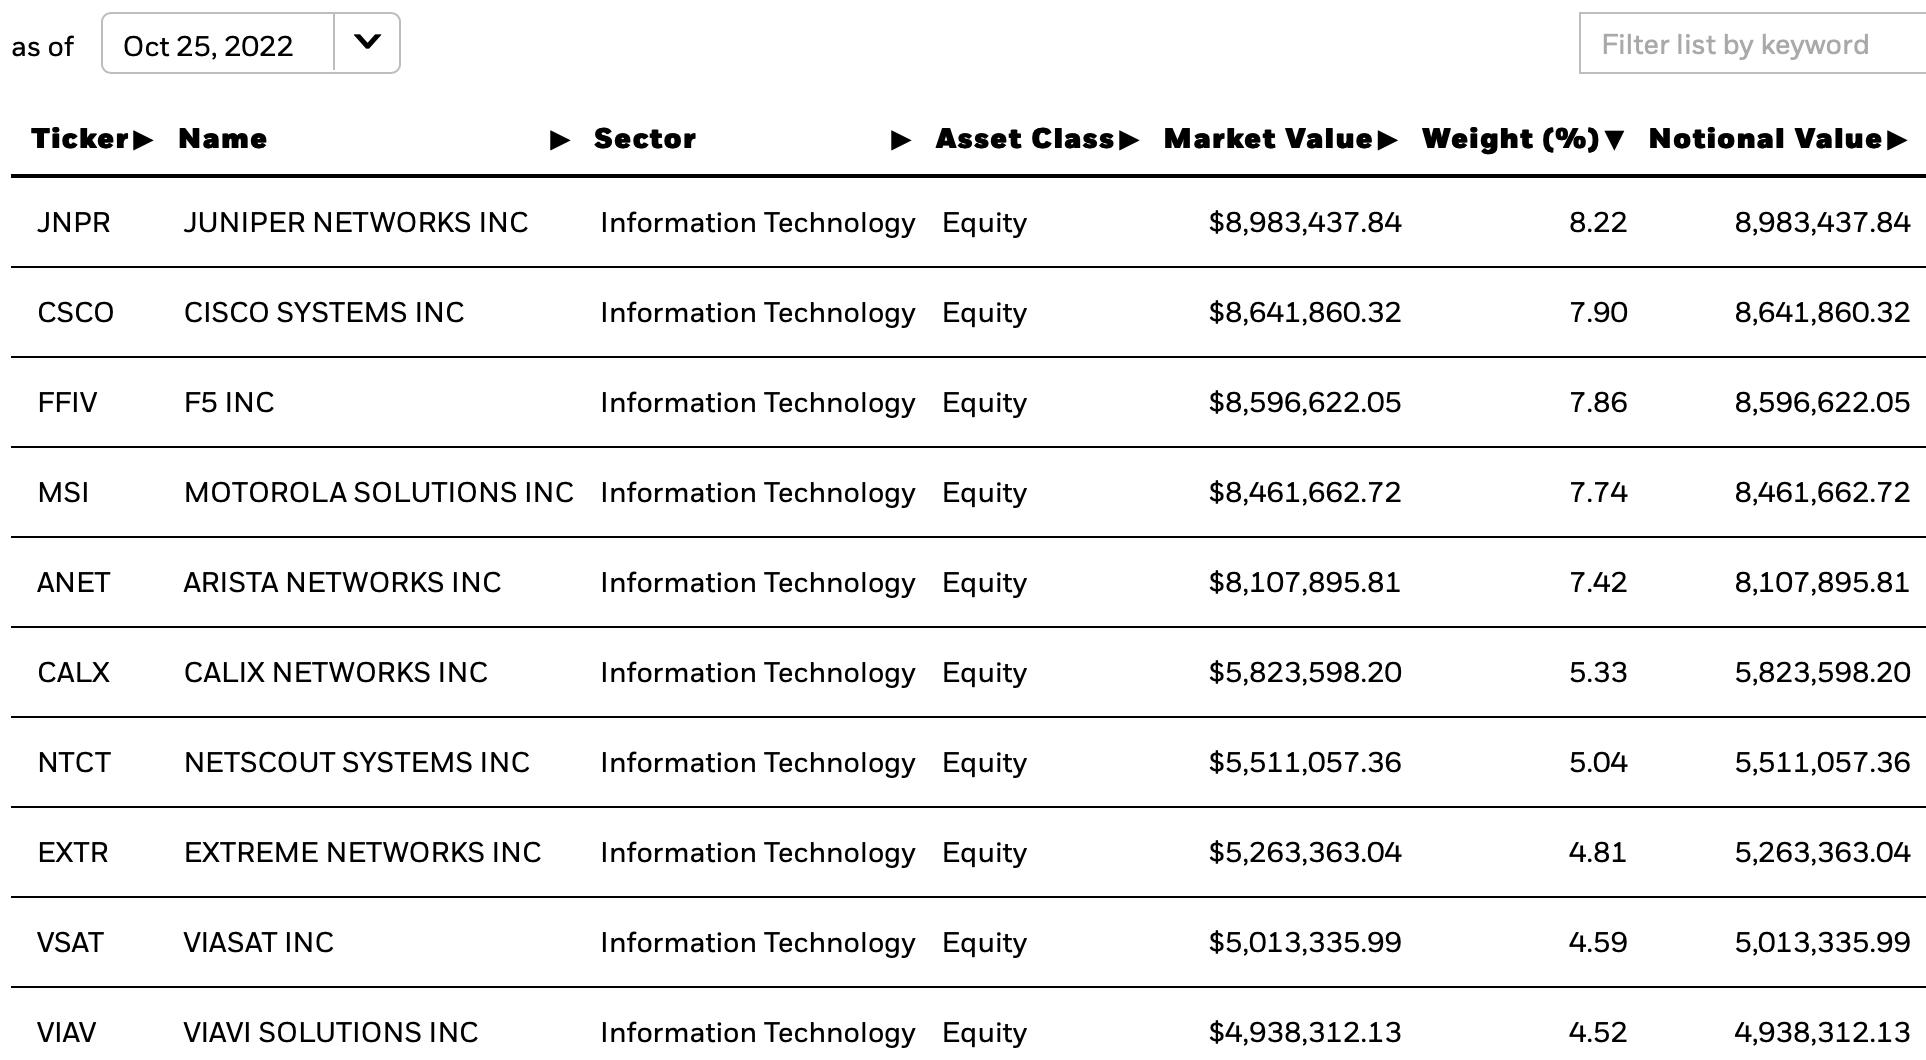
IGN tracks a market-cap-weighted index of US and Canadian multimedia networking companies. Click HERE for more information.
Predefined Scans Triggered: None.
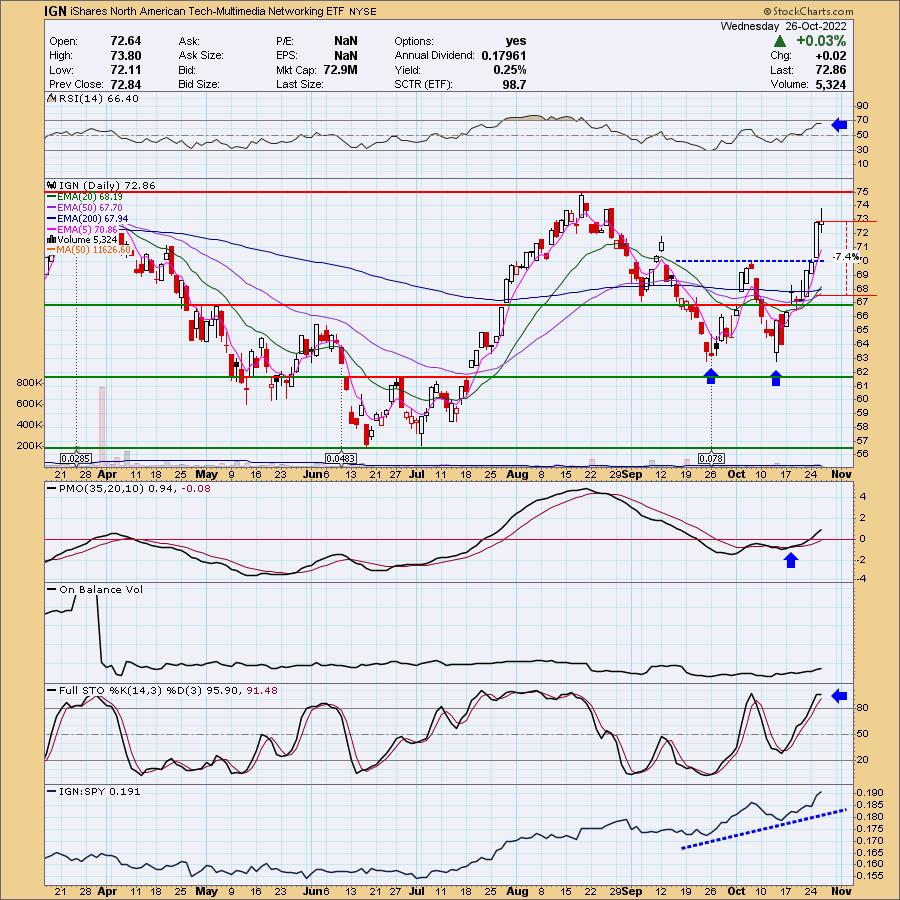
IGN is unchanged in after hours trading. We have a giant bullish double-bottom that was confirmed with yesterday's giant breakout. Considering today was a bad day for tech, this ETF didn't succumb. The RSI is positive and not overbought. The PMO is on an oversold BUY signal that occurred just below the zero line. We saw a "Silver Cross" BUY signal come in on yesterday's breakout. Stochastics are oscillating above 80 and I love the relative performance of this ETF. The stop is set at 7.4% around $67.46 below the 50-day EMA.
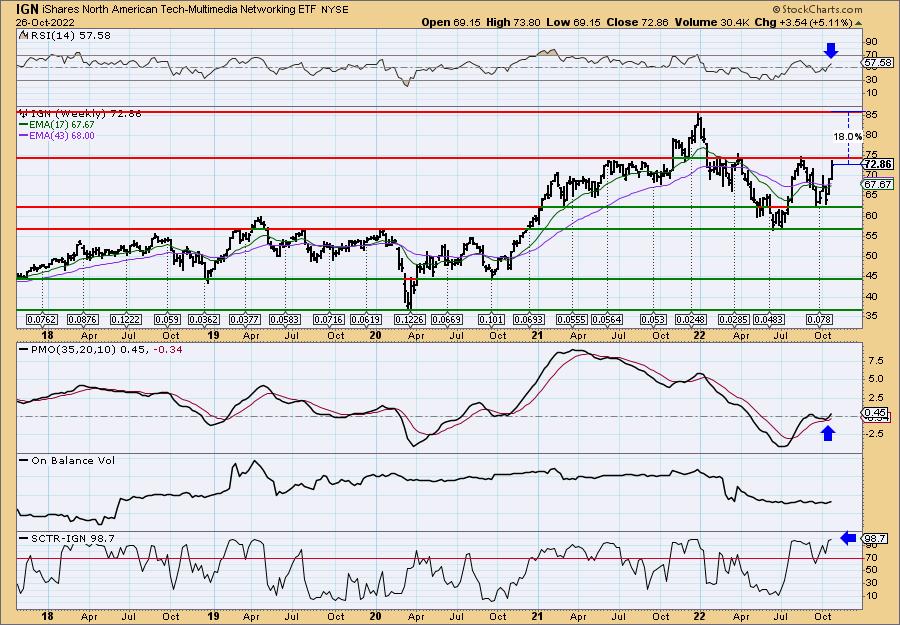
The weekly chart shows price up against overhead resistance. The best part of this chart is the weekly PMO bottom above the signal line. The SCTR is outstanding at 98.7%. The weekly RSI is positive, rising and best of all, not overbought. I've listed an 18% upside target, but I suspect it will push past that.
Rio Tinto PLC (RIO)
EARNINGS: 2/22/2023 (BMO)
Rio Tinto Plc engages in the exploration, mining, and processing of mineral resources. It operates through the following business segments: Iron Ore, Aluminium, Copper and Diamonds, Energy and Minerals, and Other Operations. The Iron Ore segment supplies global seaborne iron ore trade. The Aluminium segment produces bauxite, alumina and primary aluminum. The Copper and Diamonds segment offers gold, silver, molybdenum and other by-products. The Energy and Minerals includes businesses with products such as uranium, borates, salt and titanium dioxide feedstock together with coal operations. The Other Operations segment covers the the curtailed Gove alumina refinery and Rio Tinto Marine operations. Rio Tinto was founded in 1873 and is headquartered in London, the United Kingdom.
Predefined Scans Triggered: Bullish MACD Crossovers and Entered Ichimoku Cloud.
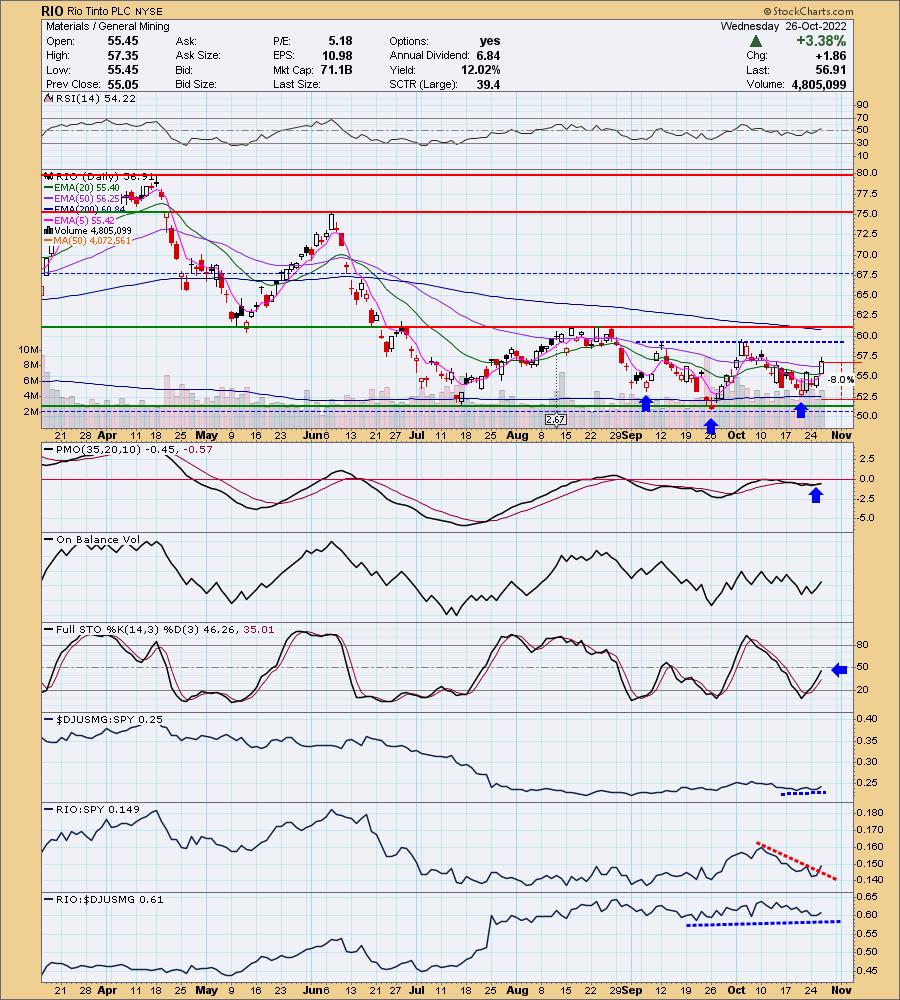
RIO is down -0.42% in after hours trading. This isn't a Gold Miner, but it is obviously in the mining business. The setup is similar to GDX with a reverse head and shoulders developing. A breakout from the neckline would imply a minimum upside target of $67.50. Price broke out above both the 20/50-day EMAs. The RSI just moved positive above net neutral (50). The PMO had a positive crossover today just below the zero line. Stochastics are rising quickly. Relative performance could be better. This one is a bottom fish so treat it accordingly (babysit). The stop is set beneath the October low at 8% around $52.35.
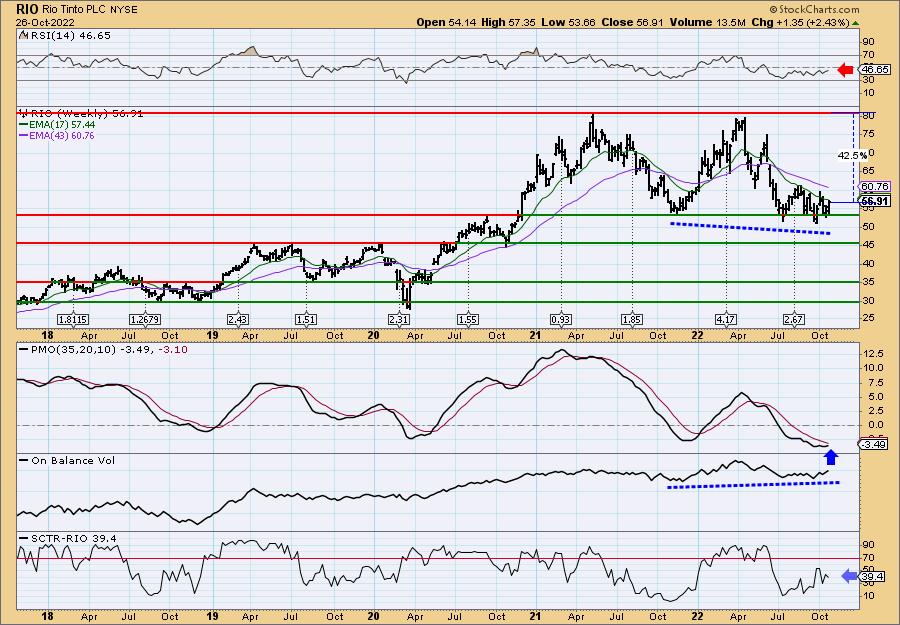
The weekly chart is favorable but does have some work to do. The weekly RSI is negative and not really trending upward just yet. The weekly PMO has bottomed which is very bullish. There is a long-term OBV positive divergence. The SCTR isn't great, but it is trending up. Upside potential is over 42%.
Relay Therapeutics Inc. (RLAY)
EARNINGS: 11/3/2022 (AMC)
Relay Therapeutics, Inc. engages in transforming the drug discovery process with an initial focus on enhancing small molecule therapeutic discovery in targeted oncology. Its Dynamo platform is use to integrate an array of edge experimental and computational approaches, which allows to apply the understanding of protein structure and motion to drug discovery. The company was founded by David Elliot Shaw, Matthew P. Jacobson, Dorothee Kern, Mark Murcko, Alexis Borisy, and Jakob Loven on May 4, 2015 and is headquartered in Cambridge, MA.
Predefined Scans Triggered: Bullish MACD Crossovers.
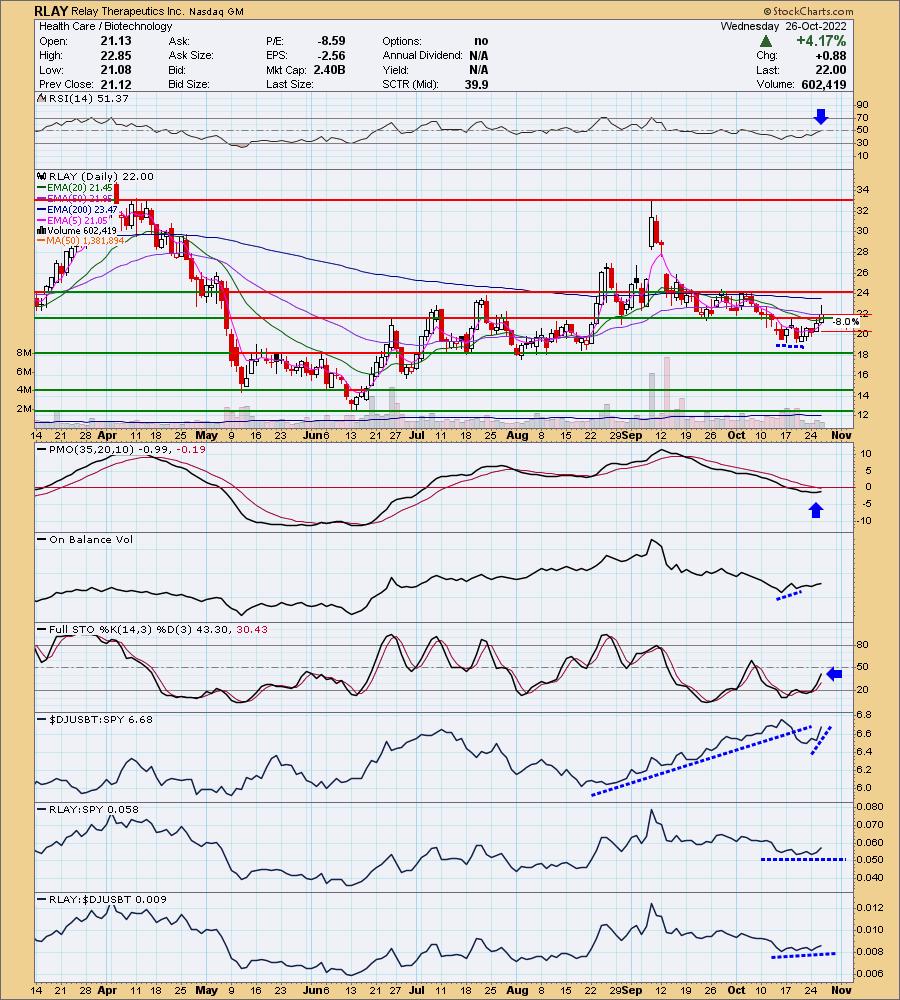
RLAY is unchanged in after hours trading. The chart is coming together but this is somewhat early. I bit on the breakout above the 20/50-day EMAs. The RSI just moved into positive territory. The PMO is rising and there is an OBV positive divergence that led into the current rally. Stochastics are rising nicely. Biotechs hit a bump in the road a few weeks ago, but relative strength is building again. Given this one is performing inline with its industry group and the group is showing new strength, relative strength is still a win on this chart. The stop is set at 8% around $20.24.
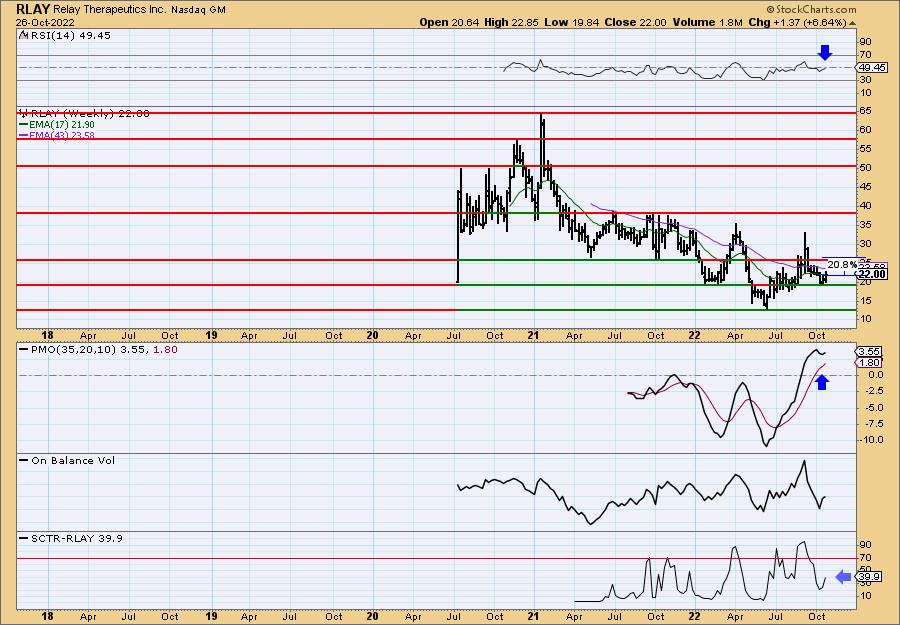
I really like the weekly PMO bottom well above the the signal line. Very encouraging to see. The weekly RSI is about to move into positive territory. The SCTR isn't great, but it is improving. Upside potential is 20%+ in my opinion.
Invesco Solar ETF (TAN)
EARNINGS: N/A
TAN tracks an index of global solar energy companies selected based on the revenue generated from solar related business.
Predefined Scans Triggered: Elder Bar Turned Green, P&F Double Top Breakout and P&F Bearish Signal Reversal.
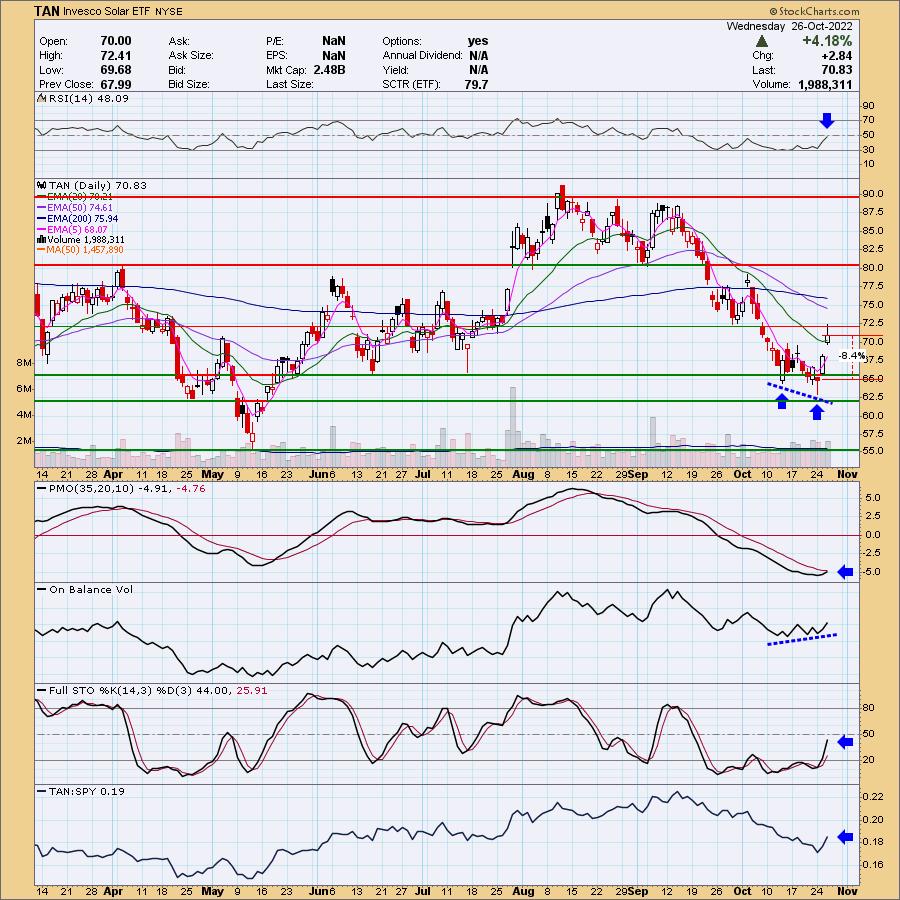
TAN is up +0.58% in after hours trading. I had my eye on this group as the market began to bottom. It usually follows suit. Today's giant gap up and close well above the 20-day EMA got my attention. We also see this executed a double-bottom pattern. Upside potential of the pattern would take price to about the 200-day EMA. The RSI is about to move in positive territory. The PMO is nearing a crossover BUY signal. There is a clear OBV positive divergence. Stochastics are rising almost vertically. It is now beginning to outperform the SPY after a long draught. My sense is that people are hungry to get into an industry group that generally explodes when the market reverses to the upside. The stop is somewhat deep at 8.4% but after a 4%+ rally today it is necessary. The stop at 8.4% puts price around $64.88.
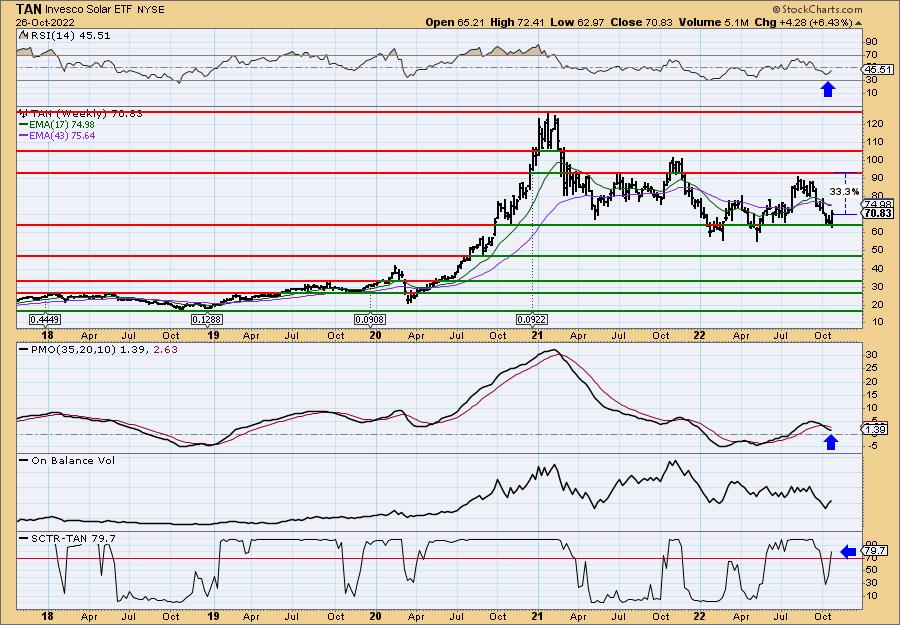
The weekly chart is looking okay. The weekly RSI is rising, but it is still in negative territory. The weekly PMO is still declining, but appears to be decelerating the decline. The SCTR is strong at 79.7% and that really adds a bullish bias to this chart. Upside potential if it reaches this year's high is over 33%.
Don't forget, on Thursdays I look at reader-requested symbols, click HERE to send me an email. I read every email I receive and try to answer them all!
Current Market Outlook:
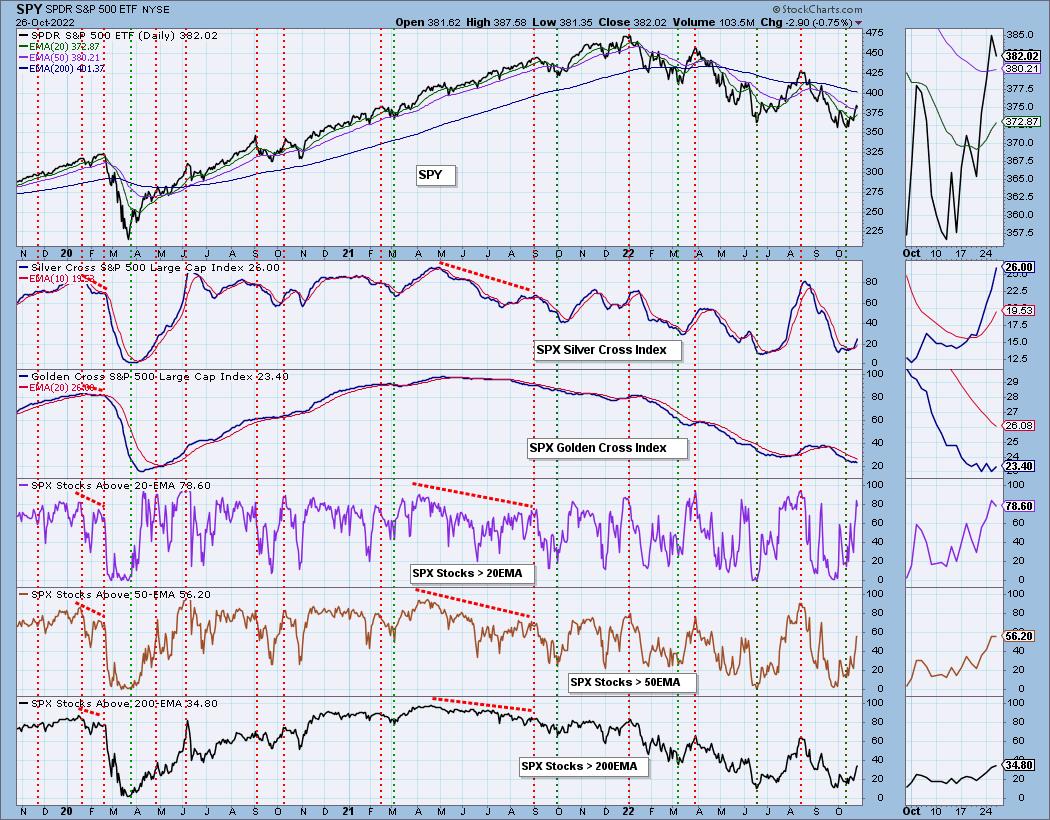
Market Environment: It is important to consider the odds for success by assessing the market tides. The following chart uses different methodologies for objectively showing the depth and trend of participation for intermediate- and long-term time frames.
- The Silver Cross Index (SCI) shows the percentage of SPX stocks on IT Trend Model BUY signals (20-EMA > 50-EMA)
- The Golden Cross Index (GCI) shows the percentage of SPX stocks on LT Trend Model BUY signals (50-EMA > 200-EMA)
Don't forget that as a "Diamonds" member, you have access to our GCI/SCI curated ChartList on DecisionPoint.com. You'll find it under "Members Only" links on the left side on the Blogs and Links Page.
Here is the current chart:
Full Disclosure: I am 55% exposed. I own all of the stocks/ETFs presented above. Managing those positions will be up to you should you participate.
I'm required to disclose if I currently own a stock I mention and/or may buy/short it within the next 72 hours.
"Technical Analysis is a windsock, not a crystal ball." - Carl Swenlin
(c) Copyright 2022 DecisionPoint.com
Watch the latest episode of DecisionPoint with Carl & Erin Swenlin on Mondays 7:00p EST or on the DecisionPoint playlist on the StockCharts TV YouTube channel here!
NOTE: The stocks reported herein are from mechanical trading model scans that are based upon moving average relationships, momentum and volume. DecisionPoint analysis is then applied to get five selections from the scans. The selections given should prompt readers to do a chart review using their own analysis process. This letter is not a call for a specific action to buy, sell or short any of the stocks provided. There are NO sure things or guaranteed returns on the daily selection of "Diamonds in the Rough."
Regarding BUY/SELL Signals: The signal status reported herein is based upon mechanical trading model signals and crossovers. They define the implied bias of the price index/stock based upon moving average relationships and momentum, but they do not necessarily call for a specific action. They are information flags that should prompt chart review. Further, they do not call for continuous buying or selling during the life of the signal. For example, a BUY signal will probably (but not necessarily) return the best results if action is taken soon after the signal is generated. Additional opportunities for buying may be found as price zigzags higher, but the trader must look for optimum entry points. Conversely, exit points to preserve gains (or minimize losses) may be evident before the model mechanically closes the signal.
Helpful DecisionPoint Links:
DecisionPoint Shared ChartList and DecisionPoint Chart Gallery
Price Momentum Oscillator (PMO)
Swenlin Trading Oscillators (STO-B and STO-V)
For more links, go to DecisionPoint.com