
I had a handful of requests to look at but decided to add one of my own to the mix. The market is poised to resume the bear market rally, although today's action wasn't exactly what we wanted to see. My exposure has expanded to 35% and I pulled back my hedge by 2.5%.
I'm running behind today so I'll let the analysis do the talking. Don't forget to sign up for the Diamond Mine trading room tomorrow! The link is below the diamonds logo below.
Good Luck & Good Trading!
Erin
Today's "Diamonds in the Rough": COHU, DHT, GOSS and YELP.
Other requests: AXGN, DNP, SWAV, EXTR, DRVN, HQT, AMD and TK.

We didn't have a Diamond Mine trading room last week due to my appearance at ChartCon so here is the prior link:
RECORDING LINK (10/14/2022):
Topic: DecisionPoint Diamond Mine (10/14/2022) LIVE Trading Room
Passcode: October#14
REGISTRATION LINK (10/21/2022):
When: Oct 21, 2022 09:00 AM Pacific Time (US and Canada)
Topic: DecisionPoint Diamond Mine (10/21/2022) LIVE Trading Room
Register in advance for this webinar HERE
After registering, you will receive a confirmation email containing information about joining the webinar.

Here is the Monday 10/17 recording:
Welcome to DecisionPoint Diamonds, wherein I highlight ten "Diamonds in the Rough" per week. These are selected from the results of my DecisionPoint Scans which search for stocks that could benefit from the trend and condition of the market. Remember, these are not recommendations to buy or sell, but are the most interesting of the stocks that surfaced in my scans. My objective is to save you the work of the initial, tedious culling process, but you need to apply your own analysis to see if these stocks pique your interest as well. There are no guaranteed winners here!
"Predefined Scans Triggered" are taken from StockCharts.com using the "Symbol Summary" option instead of a "SharpChart" on the workbench.
Cohu, Inc. (COHU)
EARNINGS: 10/27/2022 (AMC)
Cohu, Inc. engages in the provision of back-end semiconductor equipment and services. It offers test and handling capital equipment, interface products, and related services to the semiconductor and electronics manufacturing industries. It operates through the Semiconductor Test and Inspection, and Printed Circuit Board Test segments. The company was founded in 1947 and is headquartered in Poway, CA.
Predefined Scans Triggered: Bullish MACD Crossovers, Moved Above Ichimoku Could and Parabolic SAR BUY Signals.
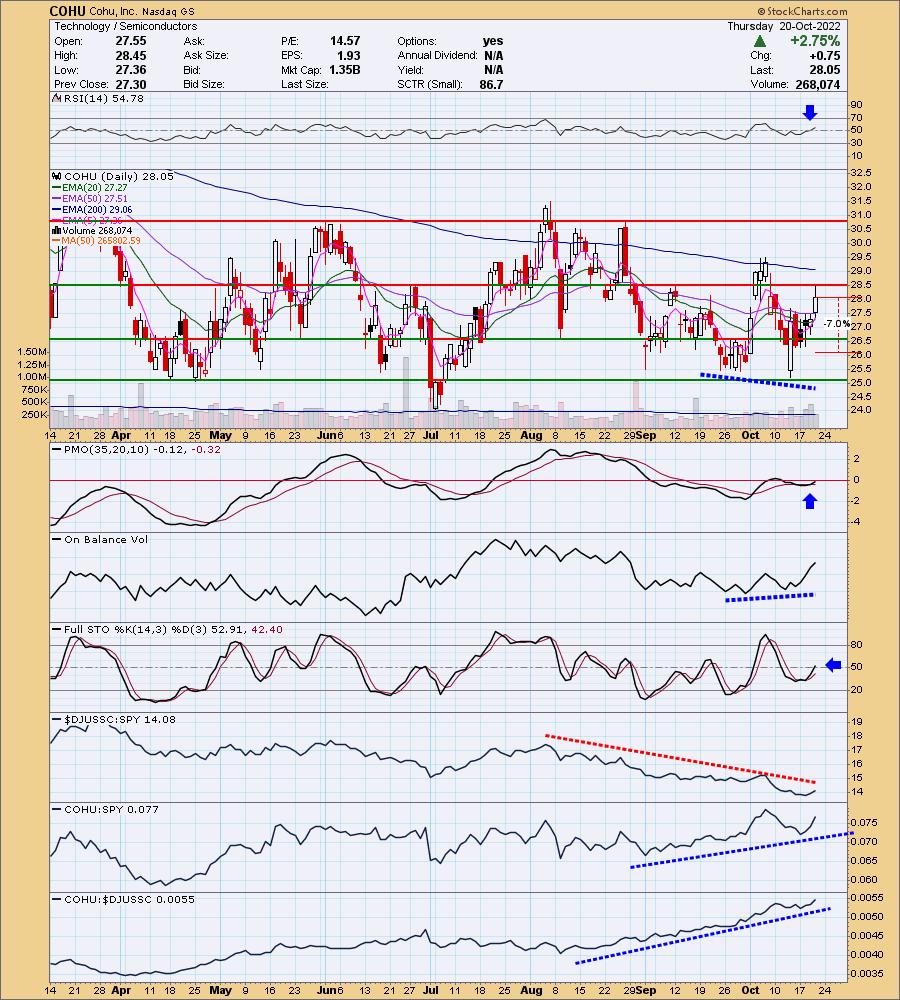
COHU is down -1.07% in after hours trading. This is my one selection. Lam Research (LRCX) had a huge day up over 7.5%. Many of the semiconductors followed suit including COHU. I would say my one problem with this one is the volatility and sideways trading range, but the rest of the chart looks good. I like the newly positive RSI and PMO whipsaw BUY signal. The PMO should get above zero soon. There is a lovely positive OBV divergence with price lows and Stochastics are healthy. The one problem is that the industry group itself needs to kickstart its performance. Still COHU is doing just fine against the SPY in spite of the group's struggles. I've set the stop at 7% below the the August low at $26.08.
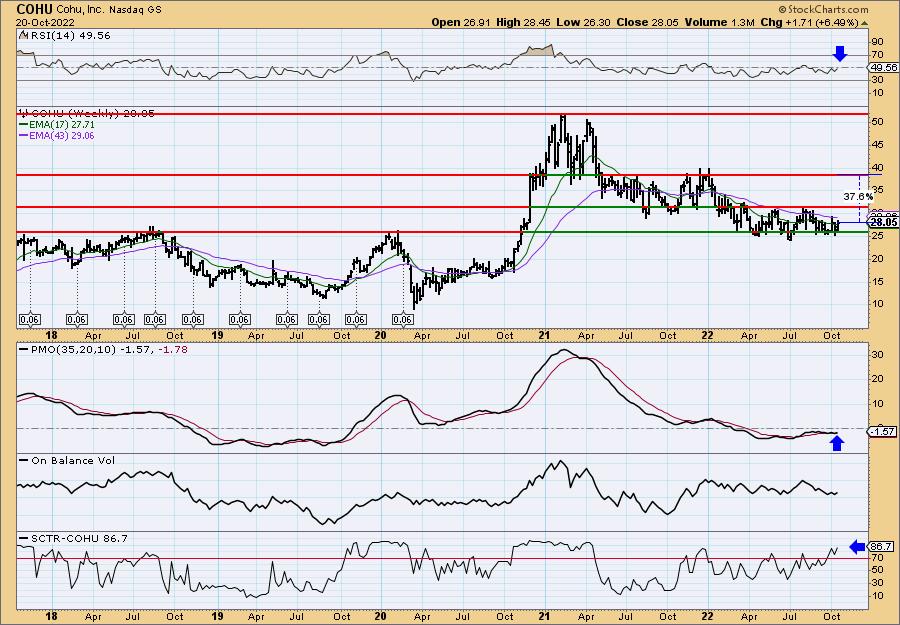
You can see the long-term trading range of COHU on the weekly chart. Price is halfway to the top of the small range, but I would look for an upside target closer to the late 2021 highs. The weekly RSI is about to move into positive territory above net neutral (50). The weekly PMO is on a tenuous BUY signal, but it is a BUY signal nonetheless. The SCTR is a healthy 86.7%. The upside potential target is about 37% away.
DHT Holdings Inc. (DHT)
EARNINGS: 10/31/2022 (AMC)
DHT Holdings, Inc. engages in the operation of a fleet of crude oil tankers. It operates through its integrated management companies in Monaco, Singapore, and Oslo, Norway. The company was founded in 2005 and is headquartered in Hamilton, Bermuda.
Predefined Scans Triggered: None.
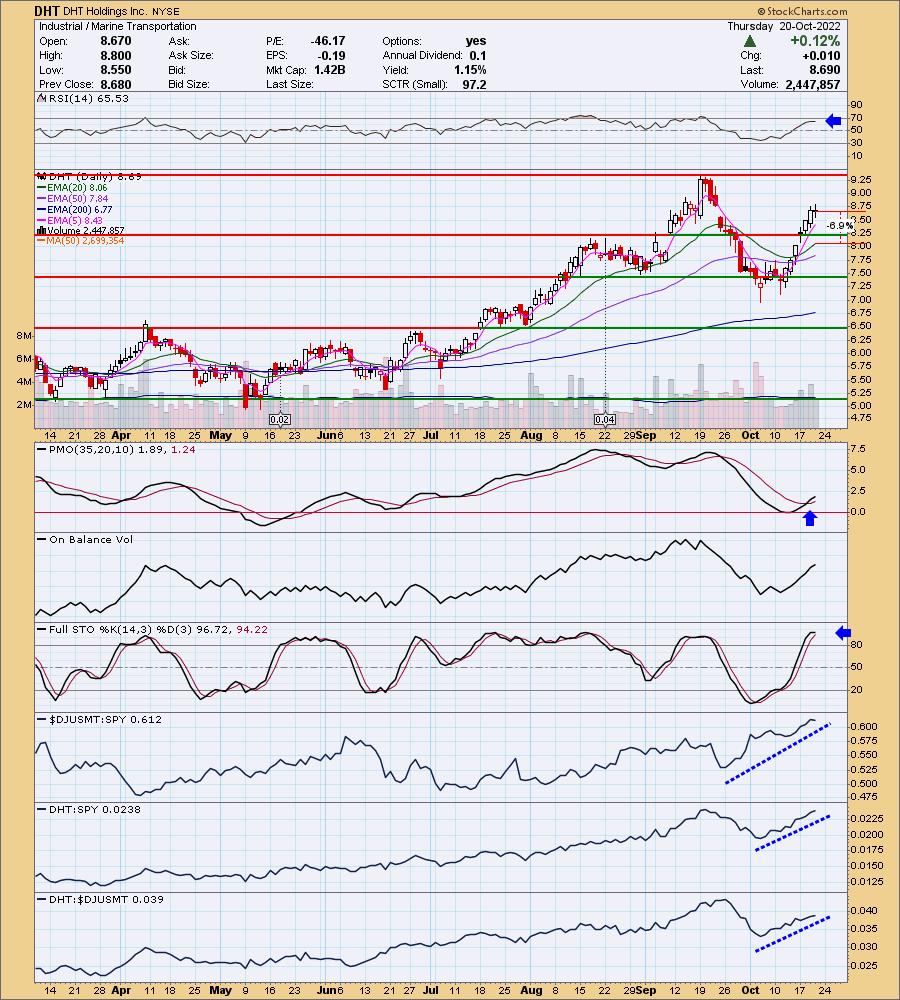
DHT is up +0.12% in after hours trading. It has been on quite a run since the rally began. There is a high likelihood it will pullback toward the breakout point at the August price high. The RSI is positive and the PMO has triggered a crossover BUY signal. Volume is coming in based on the OBV. Stochastics are above 80 and relative strength is excellent across the board. I've set the stop beneath the 20-day EMA around 6.9% or $8.09.
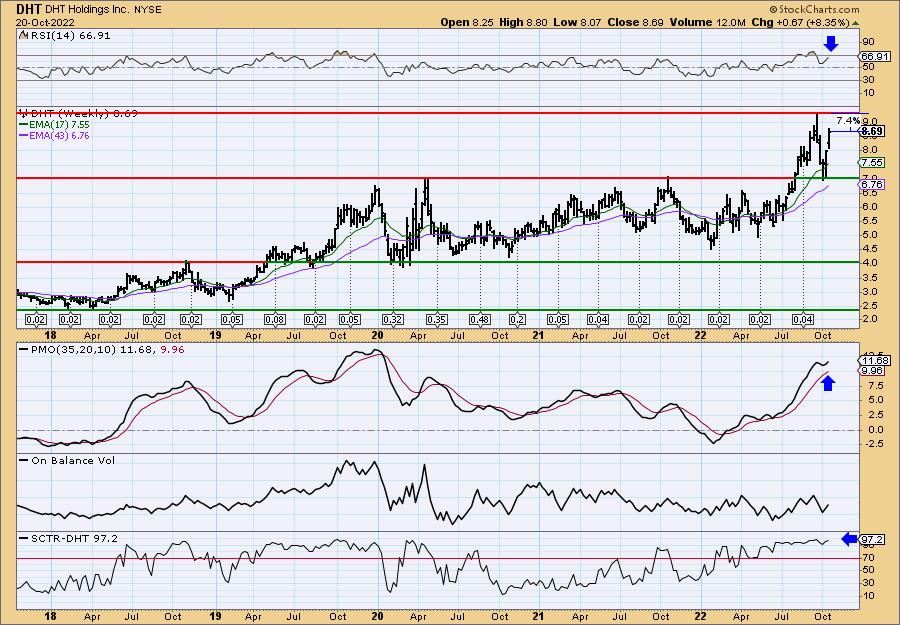
The weekly PMO has just bottomed above the signal line which is especially bullish. The weekly RSI is positive and not yet overbought. The SCTR is a might 97.2%. It is near all-time highs so consider an upside target around $10 or 15%.
Gossamer Bio, Inc. (GOSS)
EARNINGS: 11/8/2022 (BMO)
Gossamer Bio, Inc. engages in discovering, acquiring, developing, and commercializing therapeutics in the disease areas of immunology, inflammation, and oncology. Its primary product candidate, GB001, is intended for the treatment of moderate-to-severe eosinophilic asthma and other allergic conditions. The company was founded by Faheem Hasnain and Sheila Gujrathi on October 25, 2015 and is headquartered in San Diego, CA.
Predefined Scans Triggered: New CCI Buy Signals, Moved Above Upper Bollinger Band and Parabolic SAR Buy Signals.
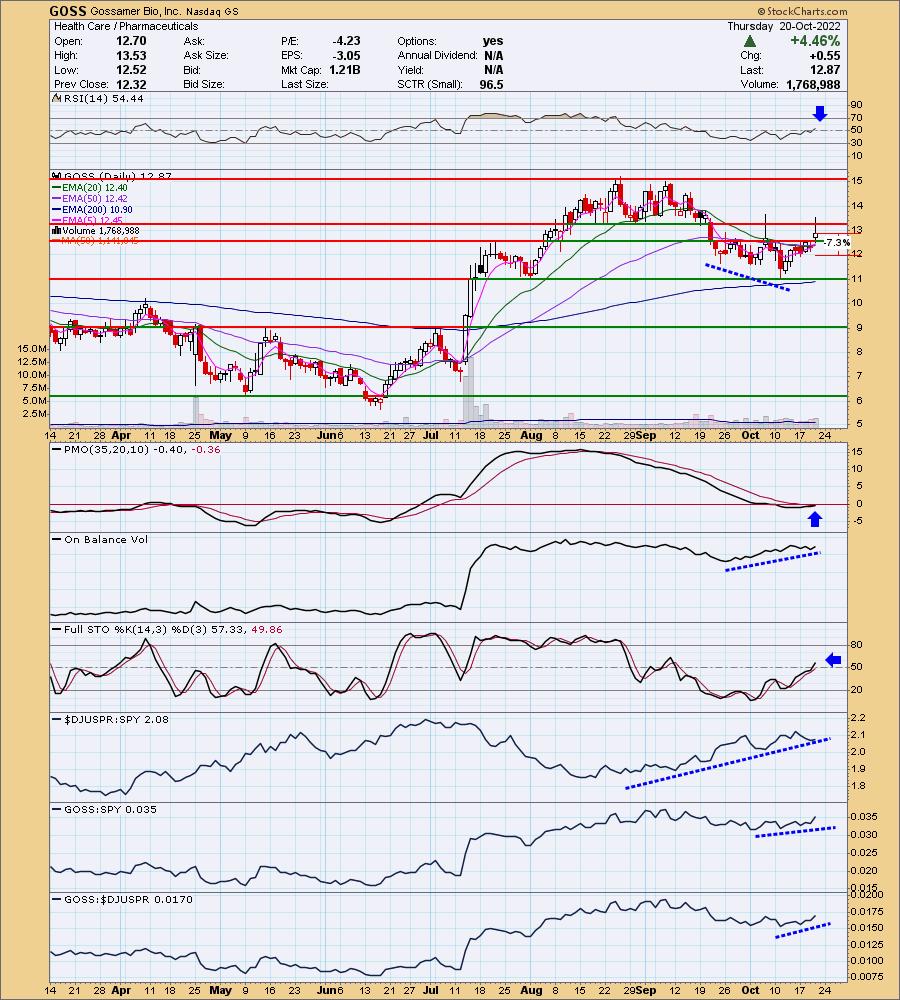
GOSS is down -2.87% in after hours trading. I like the basing pattern I'm seeing here that is accompanied by a positive OBV divergence. The RSI just moved into positive territory and the PMO is nearing a crossover BUY signal. The PMO is rather flat and though Stochastics are rising, neither are very enthusiastic about rising. Relative strength looks pretty good, but could be better for GOSS. The group is performing well. I've set the stop around 7.3% at $11.93.
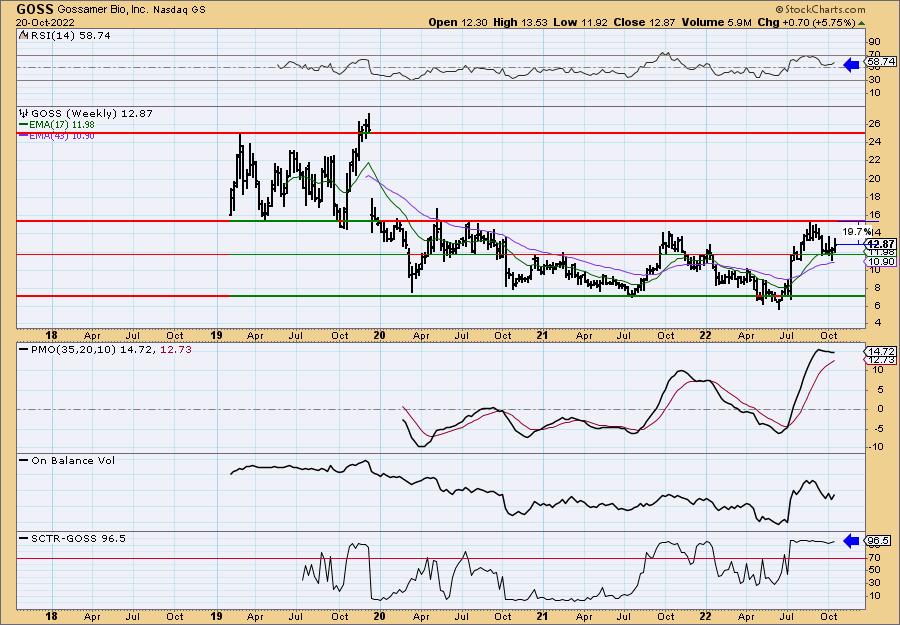
The weekly chart shows a positive and rising RSI and a strong SCTR of 96.5%. The weekly PMO could use some work. It does appear to be flattening a bit on this week's rally. If price can reach overhead resistance, that would be a nearly 20% gain.
Yelp Inc. (YELP)
EARNINGS: 11/3/2022 (AMC)
Yelp, Inc. operates a platform that connects consumers with local businesses in the United States and internationally. The company's platform covers various local business categories, including restaurants, shopping, beauty and fitness, health, and other categories, as well as home, local, auto, professional, pets, events, real estate, and financial services. It provides free and paid advertising products to businesses, which include cost-per-click search advertising and multi-location ad products, as well as enables businesses to deliver targeted search advertising to local audiences and business listing page products. It also offers other services, including Yelp Reservations, which provides online reservations for restaurants, nightlife, and other venues directly from their Yelp business listing pages, Yelp Waitlist, a subscription-based waitlist management solution that allows consumers to check wait times and join waitlists remotely, as well as businesses to manage seating and server rotation, the Yelp Knowledge program, which offers business owners local analytics and insights through access to its historical data and other proprietary content, and Yelp Fusion, which offers free and paid access to content and data for consumer-facing enterprise use through publicly available APIs. In addition, it provides content licensing, as well as allows third-party data providers to update and manage business listing information on behalf of businesses. The Firm offers its products directly through its sales force, indirectly through partners, and online through its website, as well as non-advertising partner arrangements. It has a strategic partnership with Grubhub for providing consumers with a service to place food orders for pickup and delivery. The company was founded by Jeremy Stoppelman and Russell Simmons in July 2004 and is headquartered in San Francisco, CA.
Predefined Scans Triggered: Declining Chaikin Money Flow.
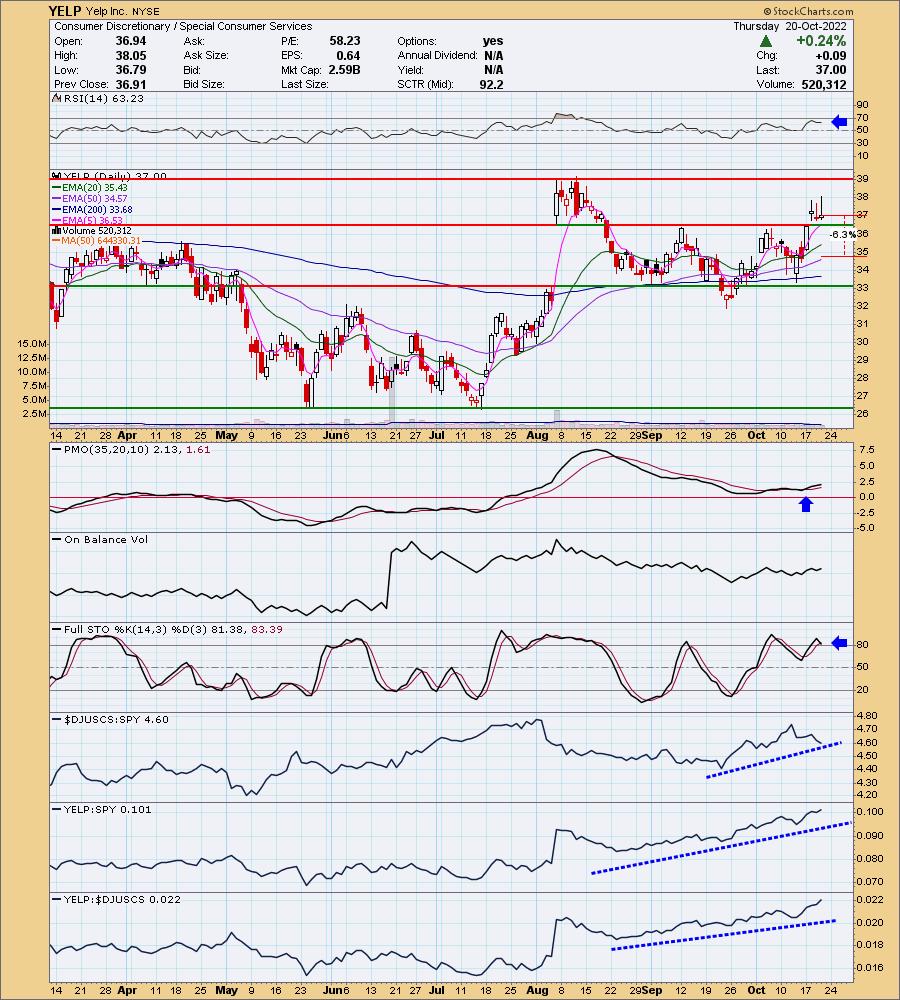
YELP is down -0.16% in after hours trading. I like the chart. The only possible problem is the threat of a reverse island. However, that island is sitting on top of support so I feel it is safe. The indicators agree this support level should hold in the short term. The RSI is positive and the PMO is on a BUY signal and rising. I'd like it to accelerate its upward movement, but it is rising nonetheless. Stochastics are above 80. The group overall is outperforming, although it is struggling a bit of late. YELP is performing very well against the group and the SPY. The stop is set near the 50-day EMA at about 6.3% or $34.67.
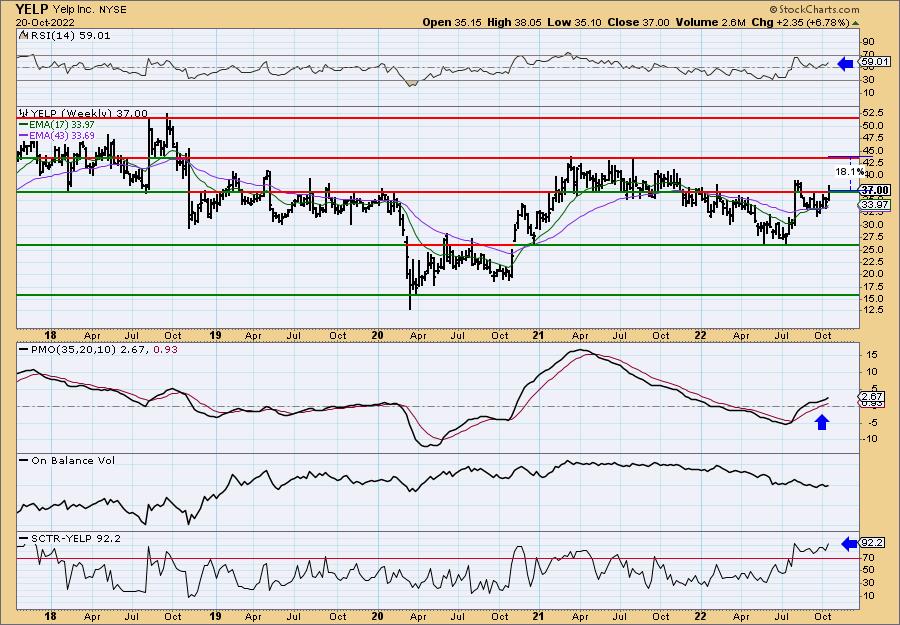
The weekly chart is very favorable. We do need to see price hold above resistance here, but it should. The weekly RSI is positive and rising. The weekly PMO has bottomed above the signal line and is now above the zero line. The SCTR is a strong 92.2%. Upside potential is about 18.1% should it reach that level of strong overhead resistance at the 2021 highs.
Don't forget, on Thursdays I look at reader-requested symbols, click HERE to send me an email. I read every email I receive and try to answer them all!
Current Market Outlook:
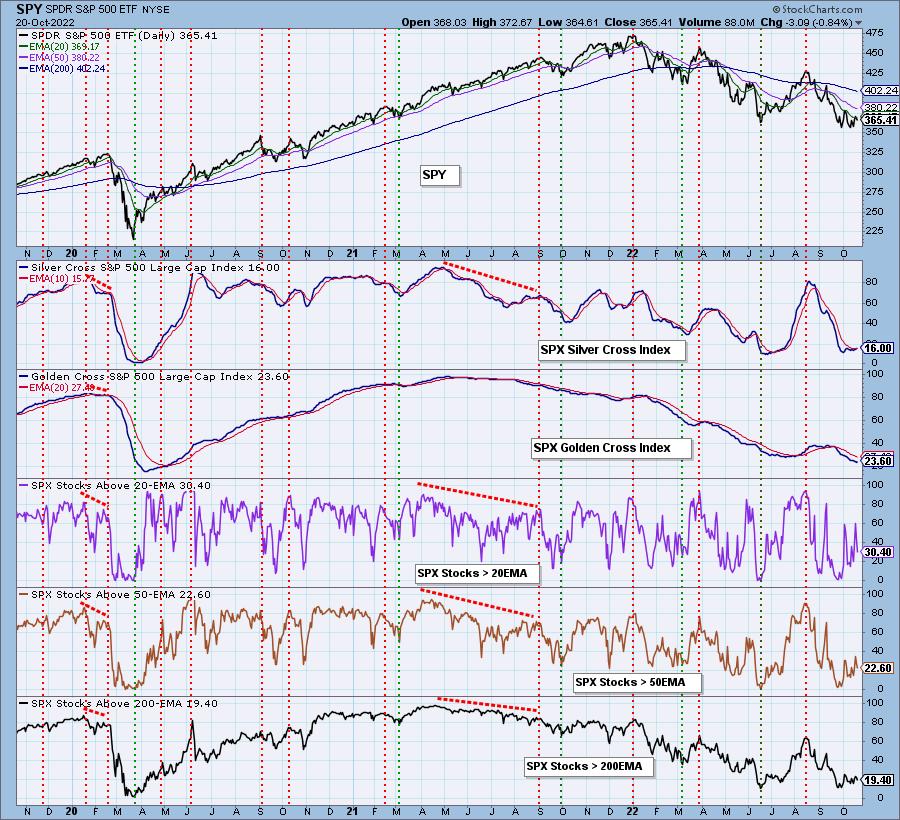
Market Environment: It is important to consider the odds for success by assessing the market tides. The following chart uses different methodologies for objectively showing the depth and trend of participation for intermediate- and long-term time frames.
- The Silver Cross Index (SCI) shows the percentage of SPX stocks on IT Trend Model BUY signals (20-EMA > 50-EMA)
- The Golden Cross Index (GCI) shows the percentage of SPX stocks on LT Trend Model BUY signals (50-EMA > 200-EMA)
Don't forget that as a "Diamonds" member, you have access to our GCI/SCI curated ChartList on DecisionPoint.com. You'll find it under "Members Only" links on the left side on the Blogs and Links Page.
Here is the current chart:
Full Disclosure: I am 35% exposed with a 2.5% hedge. Thinking about COHU or DHT for tomorrow.
I'm required to disclose if I currently own a stock I mention and/or may buy/short it within the next 72 hours.
"Technical Analysis is a windsock, not a crystal ball." - Carl Swenlin
(c) Copyright 2022 DecisionPoint.com
Watch the latest episode of DecisionPoint with Carl & Erin Swenlin on Mondays 7:00p EST or on the DecisionPoint playlist on the StockCharts TV YouTube channel here!
NOTE: The stocks reported herein are from mechanical trading model scans that are based upon moving average relationships, momentum and volume. DecisionPoint analysis is then applied to get five selections from the scans. The selections given should prompt readers to do a chart review using their own analysis process. This letter is not a call for a specific action to buy, sell or short any of the stocks provided. There are NO sure things or guaranteed returns on the daily selection of "Diamonds in the Rough."
Regarding BUY/SELL Signals: The signal status reported herein is based upon mechanical trading model signals and crossovers. They define the implied bias of the price index/stock based upon moving average relationships and momentum, but they do not necessarily call for a specific action. They are information flags that should prompt chart review. Further, they do not call for continuous buying or selling during the life of the signal. For example, a BUY signal will probably (but not necessarily) return the best results if action is taken soon after the signal is generated. Additional opportunities for buying may be found as price zigzags higher, but the trader must look for optimum entry points. Conversely, exit points to preserve gains (or minimize losses) may be evident before the model mechanically closes the signal.
Helpful DecisionPoint Links:
DecisionPoint Shared ChartList and DecisionPoint Chart Gallery
Price Momentum Oscillator (PMO)
Swenlin Trading Oscillators (STO-B and STO-V)
For more links, go to DecisionPoint.com