
I've noticed that my bullish scans have been producing fewer and fewer results. Today was very lopsided to the bearish side. We had 63 bearish results and about 6 bullish results. Many times when results are this lopsided, a bottom is put in. The SPY is still within the trading range as everyone waits with bated breath for jobs report, consumer price index and of course, next week's meeting of the FOMC.
While I don't like that we haven't gotten a breakout yet, the Swenlin Trading Oscillators are still rising so I'm still going to present longs rather than shorts.
I had an ETF come up today that I believe looks good, but I couldn't decipher exactly what the fund does or whether they have any holdings. The website was terrible. Here's the name and symbol. It's a good chart: iM DBi Managed Futures Strategy ETF (DBMF).
There are no other "Stocks to Review" as there weren't many choices. I'm actually presenting two that were "Stocks to Review" yesterday as the scan results were less than impressive.
"Reader Request" Day is tomorrow and given the weak scan results, I will welcome your ideas and give you complete analysis of your selections if chosen. Email me here.
I have only received a few folks' emails that they would like DP Show "Diamonds of the Week" sent out on Monday afternoons since I don't start up Diamonds until Tuesdays. I believe I should send you at a minimum the symbols. I'll include the chart in the email or I'll publish a Monday report if time permits that is only the one maybe two charts of Diamond(s) of the week. Would love to hear from you on whether you'd like this. My time is at a premium but the symbols at a minimum should be shared before Tuesday night.
Good Luck & Good Trading!
Erin
Today's "Diamonds in the Rough": CRNX, MASS and UEC.

RECORDING LINK (6/3/2022):
Topic: DecisionPoint Diamond Mine (6/3/2022) LIVE Trading Room
Start Time: Jun 3, 2022 09:00 AM
Meeting Recording Link.
Access Passcode: June#3rd
REGISTRATION FOR Friday 6/10 Diamond Mine:
When: Jun 10, 2022 09:00 AM Pacific Time (US and Canada)
Topic: DecisionPoint Diamond Mine (6/10/2022) LIVE Trading Room
Register in advance for this webinar HERE.
Save the registration confirmation email with login instructions in case Zoom doesn't notify you in time.

Free DP Trading Room (6/6/2022) RECORDING LINK:
Topic: DecisionPoint Trading Room
Start Time: Jun 6, 2022 09:00 AM
Meeting Recording Link.
Access Passcode: June@6th
For best results, copy and paste the access code to avoid typos.
Welcome to DecisionPoint Daily Diamonds, wherein I highlight ten "Diamonds in the Rough" per week. These are selected from the results of my DecisionPoint Scans, which search for stocks that could benefit from the trend and condition of the market. Remember, these are not recommendations to buy or sell, but are the most interesting of the stocks that surfaced in my scans. My objective is to save you the work of the initial, tedious culling process, but you need to apply your own analysis to see if these stocks pique your interest as well. There are no guaranteed winners here!
"Predefined Scans Triggered" are taken from StockCharts.com using the "Symbol Summary" option instead of a "SharpChart" on the workbench.
Crinetics Pharmaceuticals, Inc. (CRNX)
EARNINGS: 8/10/2022 (AMC)
Crinetics Pharmaceuticals, Inc. operates as a clinical stage pharmaceutical company focused on the discovery, development, and commercialization of novel therapeutics for rare endocrine diseases and endocrine-related tumors. Its product candidate, CRN00808, is an oral nonpeptide somatostatin agonist for the treatment of acromegaly. The firm is also developing other oral nonpeptide somatostatin agonists for neuroendocrine tumors and hyperinsulinism, as well as an oral nonpeptide ACTH antagonist for the treatment of Cushing's disease. The company was founded by R. Scott Struthers, Yun-Fei Zhu and Stephen F. Betz in 2008 and is headquartered in San Diego, CA.
Predefined Scans Triggered: Parabolic SAR Buy Signals and Shooting Star.
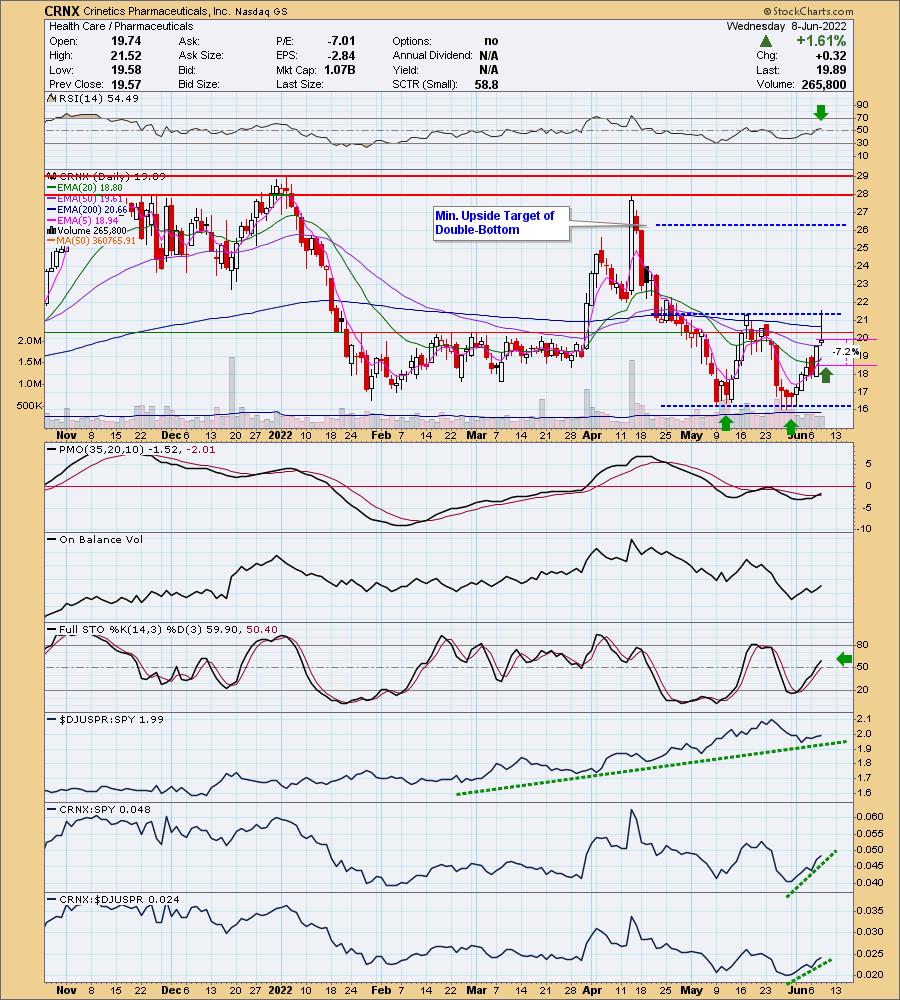
CRNX is unchanged in after hours trading. I covered this one in the June 16th, 2020 Diamonds Report. The position is closed but the double-bottom I pointed out fulfilled its target and then some. At its peak, it was up over 28%. We have another double-bottom. Price made it above the confirmation line but unfortunately close well below that level forming a bearish shooting star candlestick. It may take more time before this one breaks back above the confirmation line of the pattern, but if it confirms, the minimum upside target is just above $26. There is a new Short-Term Trend Model BUY signal as the 5-day EMA crossed above the 20-day EMA. The RSI just moved into positive territory and is rising. The PMO recently triggered a crossover BUY signal and Stochastics are rising in positive territory. Relative strength is excellent in the short term for CRNX and the group has had relative strength building for months. The stop is set below that last March bottom and the 20-day EMA.
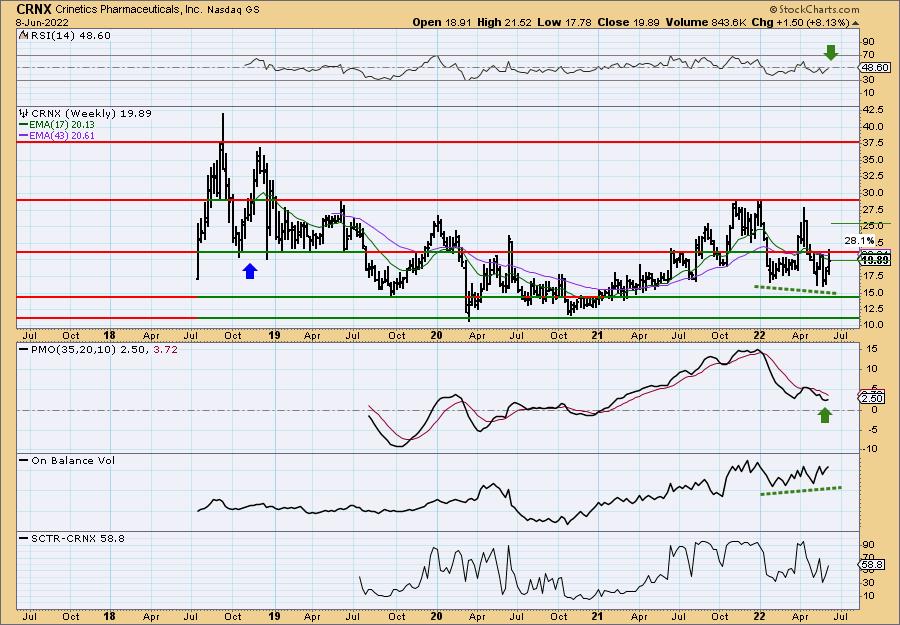
The weekly chart is pretty good. The weekly RSI is nearing positive territory and the PMO has turned up. There is a slight OBV positive divergence that is leading into this current rally. If it can reach that $26 level (minimum upside target of double-bottom), that's an over 28% gain.
908 Devices Inc. (MASS)
EARNINGS: 8/4/2022 (BMO)
908 Devices, Inc. engages in the development of measurement devices for chemical and biochemical analysis. It offers products using mass spectrometry technology, an analytical technique for measuring the mass of charged molecules that is used in chemical analysis laboratories for applications, such as safety and security, food science, biotechnology, clinical diagnostics, and controlling industrial processes. Its products include desktops and handhelds. The company was founded by Kevin J. Knopp, Miller Scott, Steve Araiza, Andrew Bartfay, Michael Jobin, Christopher D. Brown, and Christopher J. Petty in 2012 and is headquartered in Boston, MA.
Predefined Scans Triggered: P&F Double Top Breakout.
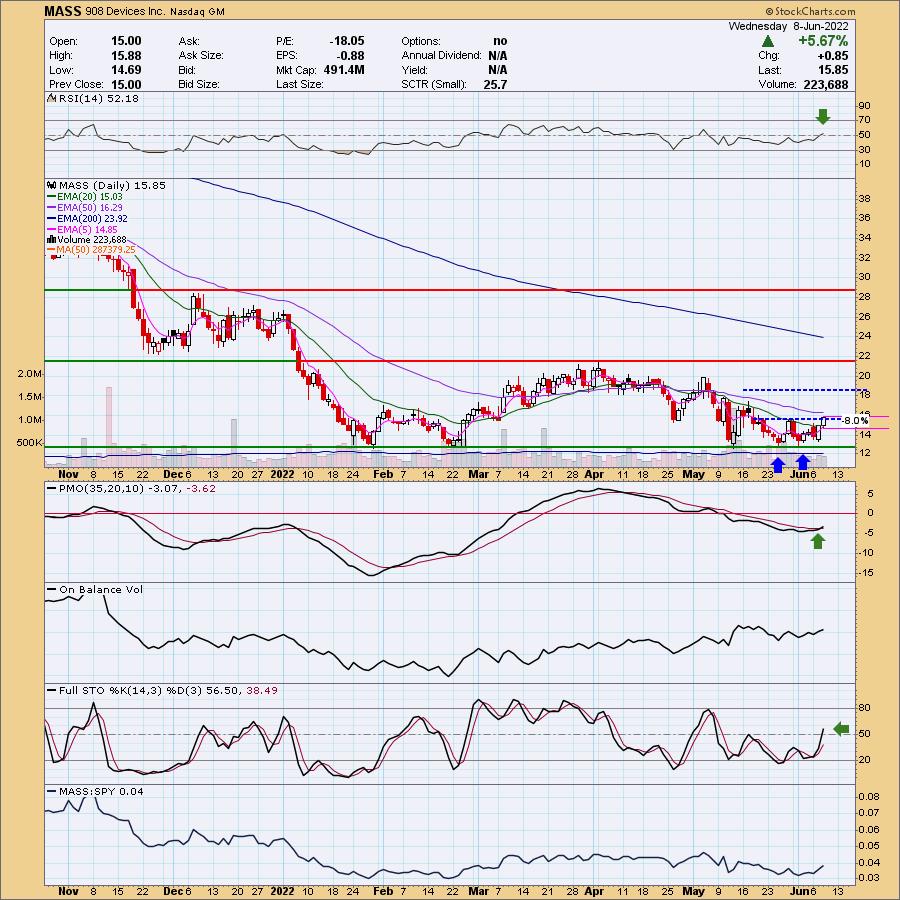
MASS is unchanged in after hours trading. I know playing reversals is risky right now, but as I said, pickin's were slim. This one is incredibly beat down, but it is rebounding off support and has formed a double-bottom. This was actually a bearish ascending triangle but today's breakout from the short-term declining trend busted that pattern. Price is back above the 20-day EMA. The minimum upside target of the double-bottom is just above $18. The RSI just moved into positive territory and the PMO triggered a crossover BUY signal today. Stochastics just moved into positive territory. Relative strength isn't anything great, but at least it is even and not in decline. It's not listed as part of a sector or industry group, but based on the description of the company, it is a healthcare stock and provides medical devices/equipment. The group isn't doing that well and XLV is doing okay so keep that in mind. The stop was difficult to set due to today's giant rally. I set it below the April low.
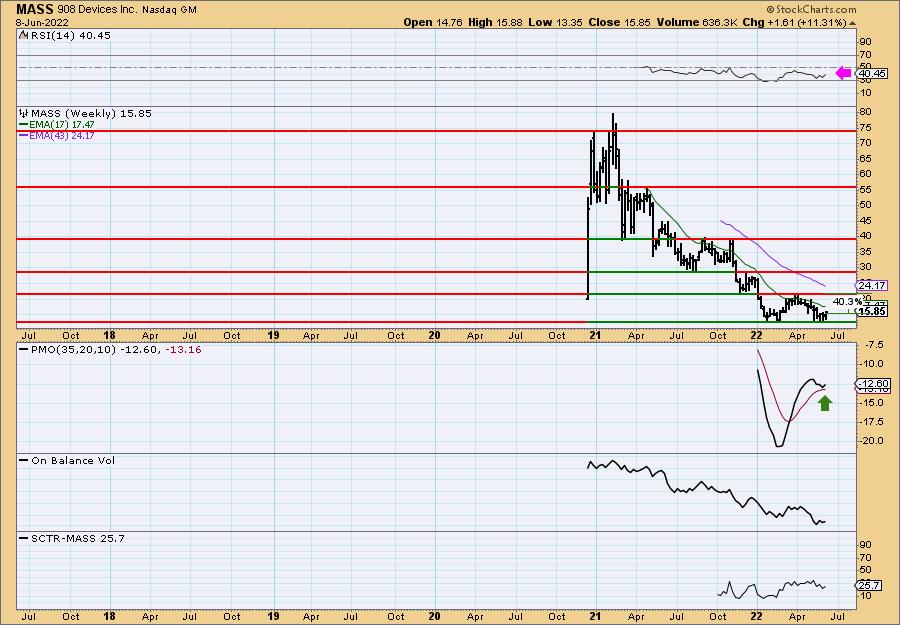
The weekly chart is mixed. The RSI is rising but very negative right now. The weekly PMO has bottomed above its signal line which is very bullish. The SCTR at 25.7% isn't good. Be careful with this beat down stock. If price can just reach the confirmation line of the double-bottom that is developing in the intermediate term, it would be an over 40% gain.
Uranium Energy Corp. (UEC)
EARNINGS: 6/8/2022 (AMC)
Uranium Energy Corp. engages in the provision of uranium mining and related activities. It includes the exploration, pre-extraction, extraction, and processing of uranium concentrates. It operates through the following geographical segments: United States, Canada, and Paraguay. The company was founded by Alan P. Lindsay and Amir Adnani on May 16, 2003 and is headquartered in Vancouver, Canada.
Predefined Scans Triggered: P&F Low Pole.
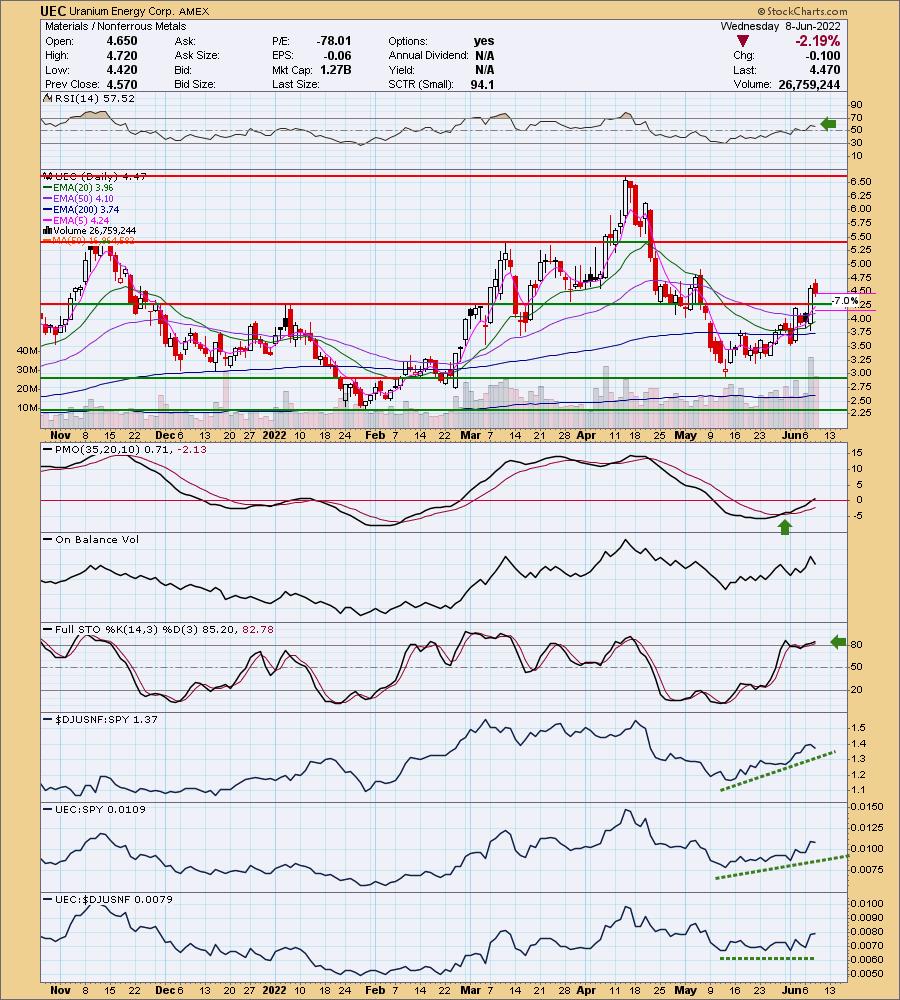
UEC is up +0.89% in after hours trading. I listed this one yesterday on the "wait for a pullback" list. We got that today. Given the positive price action that got us here, there is very little price damage. The RSI is positive and the PMO just hit positive territory today. The OBV bottoms are rising to confirm the current rally. Stochastics are rising and relative strength is excellent for the group and UEC against the SPY. UEC is performing inline with the group and that's why it is seeing very good strength against the SPY. The stop is set below the January high right around the 50-day EMA.
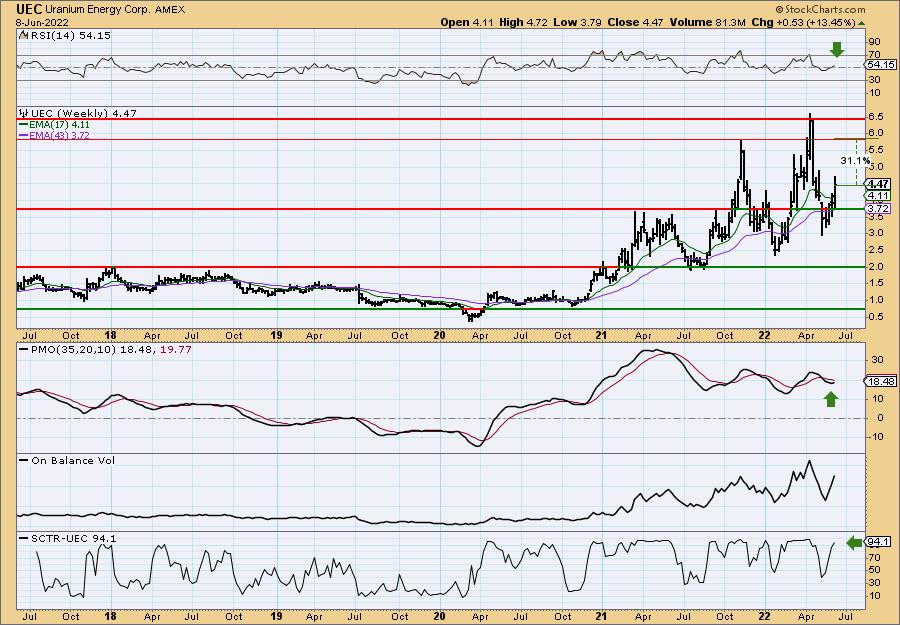
The weekly chart is very favorable. The weekly RSI just hit positive territory and the weekly PMO has turned up. The SCTR is a powerful 94.1% and volume is coming in based on the upward thrust of the OBV. Upside potential if it reaches the 2021 high is over 31%.
Don't forget, on Thursdays I look at reader-requested symbols, click HERE to send me an email. I read every email I receive and try to answer them all!
Current Market Outlook:
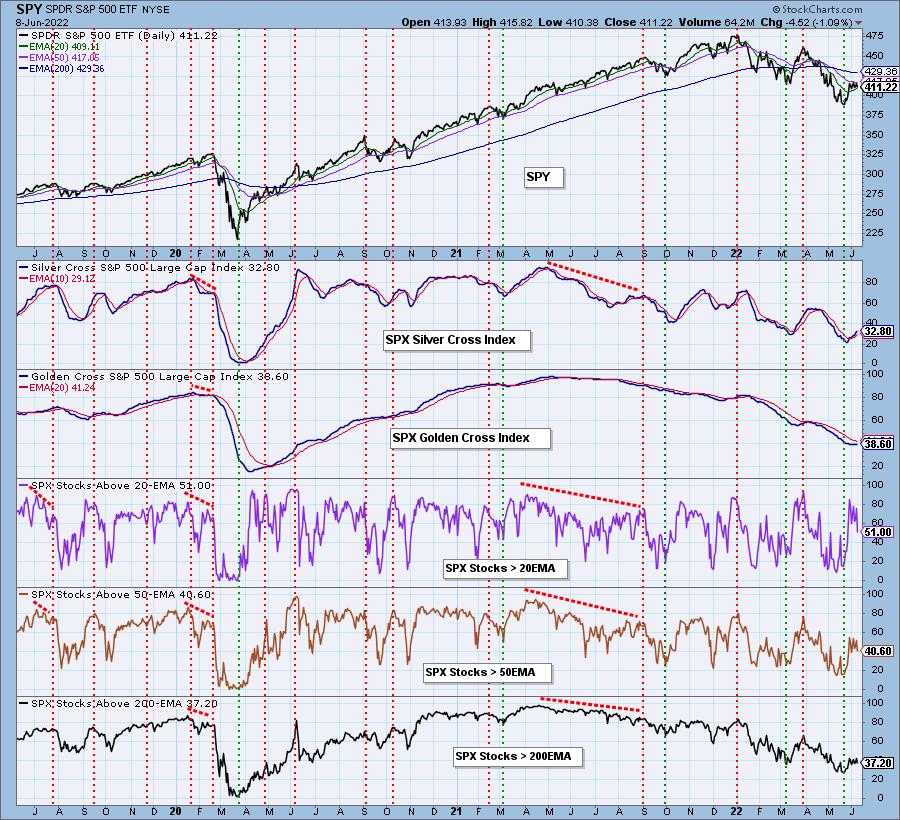
Market Environment: It is important to consider the odds for success by assessing the market tides. The following chart uses different methodologies for objectively showing the depth and trend of participation for intermediate- and long-term time frames.
- The Silver Cross Index (SCI) shows the percentage of SPX stocks on IT Trend Model BUY signals (20-EMA > 50-EMA)
- The Golden Cross Index (GCI) shows the percentage of SPX stocks on LT Trend Model BUY signals (50-EMA > 200-EMA)
Don't forget that as a "Diamonds" member, you have access to our GCI/SCI curated ChartList on DecisionPoint.com. You'll find it under "Members Only" links on the left side on the Blogs and Links Page.
Here is the current chart:
Full Disclosure: I'm 30% exposed with 70% in cash. I made no purchases today, but I am planning to add to my Gold position using IAU on a breakout. AWK is on my purchase list as well.
I'm required to disclose if I currently own a stock I mention and/or may buy/short it within the next 72 hours.
"Technical Analysis is a windsock, not a crystal ball." - Carl Swenlin
(c) Copyright 2022 DecisionPoint.com
Watch the latest episode of DecisionPoint with Carl & Erin Swenlin on Mondays 7:00p EST or on the DecisionPoint playlist on the StockCharts TV YouTube channel here!
NOTE: The stocks reported herein are from mechanical trading model scans that are based upon moving average relationships, momentum and volume. DecisionPoint analysis is then applied to get five selections from the scans. The selections given should prompt readers to do a chart review using their own analysis process. This letter is not a call for a specific action to buy, sell or short any of the stocks provided. There are NO sure things or guaranteed returns on the daily selection of "Diamonds in the Rough."
Helpful DecisionPoint Links:
DecisionPoint Shared ChartList and DecisionPoint Chart Gallery
Price Momentum Oscillator (PMO)
Swenlin Trading Oscillators (STO-B and STO-V)
For more links, go to DecisionPoint.com