
The breakdown finally happened. Given the lack of scan results the past two days I probably should have "sensed" this breakdown. Yesterday intermediate-term indicators topped and short-term indicators while rising, were really going nowhere. Now that we have the breakdown, stock picking is going to get even more dicey. This is why I haven't expanded my exposure from 35%. I will be paring it down to 30% soon. Most of my positions are Energy related or a hedge (PFIX - the interest rate hedge). I do want to add Gold, but I want to see the breakout before I do.
Reader requests were thin so there are only four being presented today. There are no "Stocks to Review". There just isn't much out there, even Energy pulled back today.
Don't forget to sign up for tomorrow's Diamond Mine trading room. The links are below along with recordings of the last Diamond Mine and FREE DP Trading Room.
Have a great weekend!
Good Luck & Good Trading!
Erin
Today's "Diamonds in the Rough": KNTE, MERC, UGL and ZM.

RECORDING LINK (6/3/2022):
Topic: DecisionPoint Diamond Mine (6/3/2022) LIVE Trading Room
Start Time: Jun 3, 2022 09:00 AM
Meeting Recording Link.
Access Passcode: June#3rd
REGISTRATION FOR Friday 6/10 Diamond Mine:
When: Jun 10, 2022 09:00 AM Pacific Time (US and Canada)
Topic: DecisionPoint Diamond Mine (6/10/2022) LIVE Trading Room
Register in advance for this webinar HERE.
Save the registration confirmation email with login instructions in case Zoom doesn't notify you in time.

Free DP Trading Room (6/6/2022) RECORDING LINK:
Topic: DecisionPoint Trading Room
Start Time: Jun 6, 2022 09:00 AM
Meeting Recording Link.
Access Passcode: June@6th
For best results, copy and paste the access code to avoid typos.
Welcome to DecisionPoint Daily Diamonds, wherein I highlight ten "Diamonds in the Rough" per week. These are selected from the results of my DecisionPoint Scans, which search for stocks that could benefit from the trend and condition of the market. Remember, these are not recommendations to buy or sell, but are the most interesting of the stocks that surfaced in my scans. My objective is to save you the work of the initial, tedious culling process, but you need to apply your own analysis to see if these stocks pique your interest as well. There are no guaranteed winners here!
"Predefined Scans Triggered" are taken from StockCharts.com using the "Symbol Summary" option instead of a "SharpChart" on the workbench.
Kinnate Biopharma Inc. (KNTE)
EARNINGS: 8/15/2022 (AMC)
Kinnate Biopharma, Inc. operates as a biopharmaceutical company engaged in the research and development of Kinnate Discovery Engine that targets genomic drivers of cancer. The company was founded by Stephen W. Kaldor and Eric A. Murphy in January 2018 and is headquartered in San Diego, CA.
Predefined Scans Triggered: Bullish MACD Crossovers.
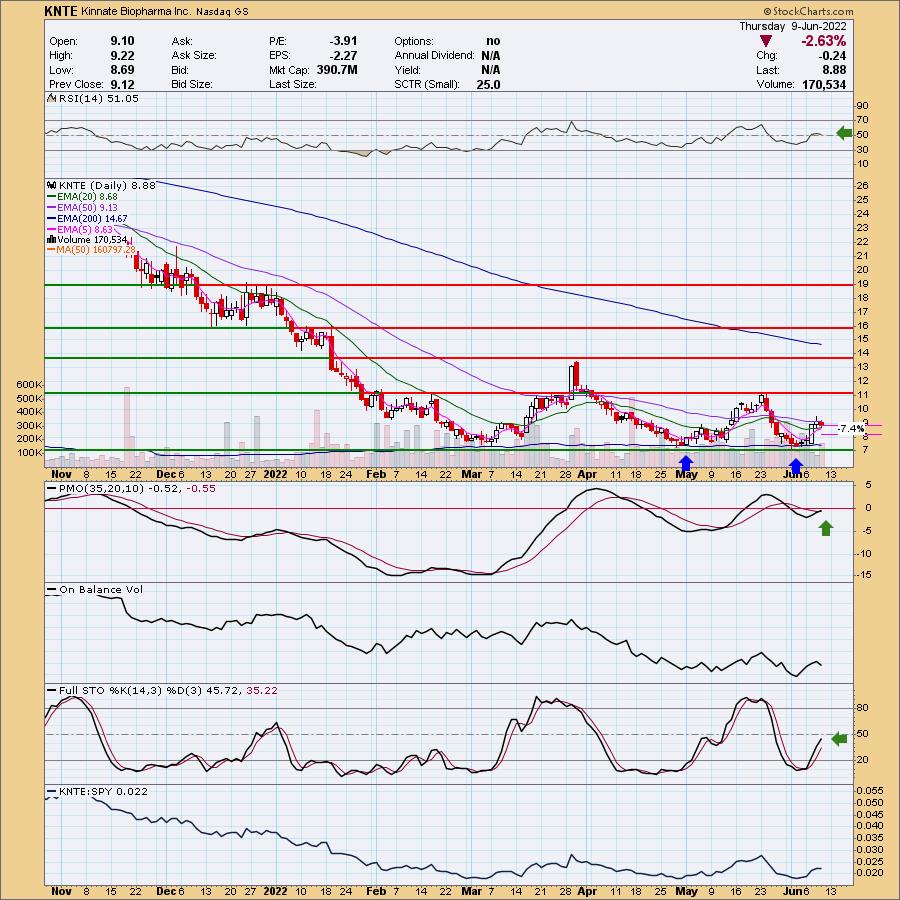
KNTE is unchanged in after hours trading. It is a small-cap company that is not listed in an industry group, but based on what it does, I would classify it as a biotech which = risk. It's a very nice set-up on this pullback primarily because the PMO was still able to pull off a crossover BUY signal despite a day that the stock lost 2.63%. The RSI also was able to stay in positive territory above net neutral (50). Stochastics are also continuing to rise. The 5-day EMA crossed above the 20-day EMA which is a Short-Term Trend Model BUY signal. There is a double-bottom forming. Price is struggling to move above the 50-day EMA, but indicators are suggesting it will eventually. The stop is set somewhat arbitrarily under the 5/20-day EMAs.
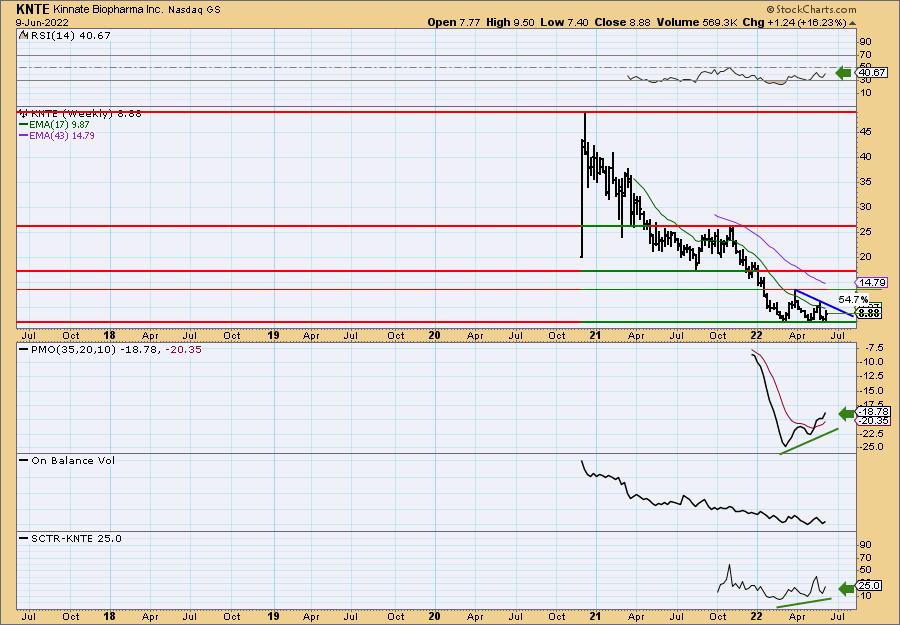
The weekly chart is mixed. The weekly RSI is negative, but rising. There are positive divergences on both the PMO and SCTR. However, the SCTR is very low and I see declining tops and a flat bottom which is a bearish ascending triangle. However, if we get a bullish breakout from the pattern, look for price to test March highs for a 50% gain.
Mercer Intl, Inc. (MERC)
EARNINGS: 7/28/2022 (AMC)
Mercer International, Inc. engages in the manufacture and sale of pulp. It operates through Pulp and Wood Products segments. The Pulp segment consists of the manufacture, sales, and distribution of NBSK pulp, electricity, and other by-products at three pulp mills. The Wood Products segment is involved in the manufacture, sale, and distribution of lumber, electricity and other wood residuals at the Friesau Facility. The company was founded on July 1, 1968 and is headquartered in Vancouver, Canada.
Predefined Scans Triggered: Elder Bar Turned Blue, Bearish Engulfing and P&F Low Pole.
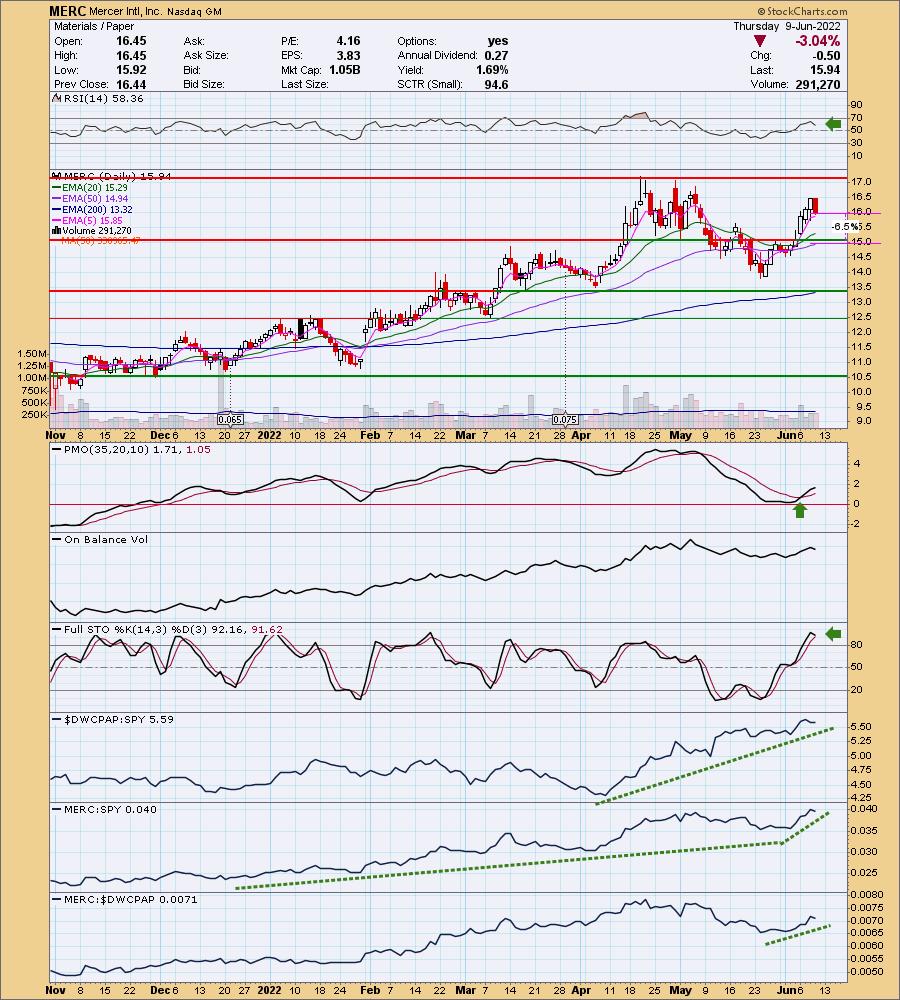
MERC is unchanged in after hours trading. I've covered MERC twice before on March 10th 2022 (Position is open and up +12.33%) and on August 18th 2021(This short position was closed when the upside stop was hit). This one is very interesting on the pullback today. As with KNTE above, a severe down day didn't deter indicators from staying bullish. The RSI fell, but it is still comfortably within positive territory. The PMO is decelerating somewhat, but is still rising after a bullish bottom above the zero line. Relative strength for the group is excellent and MERC is improving its relative strength greatly. The stop is set below support and the 50-day EMA.
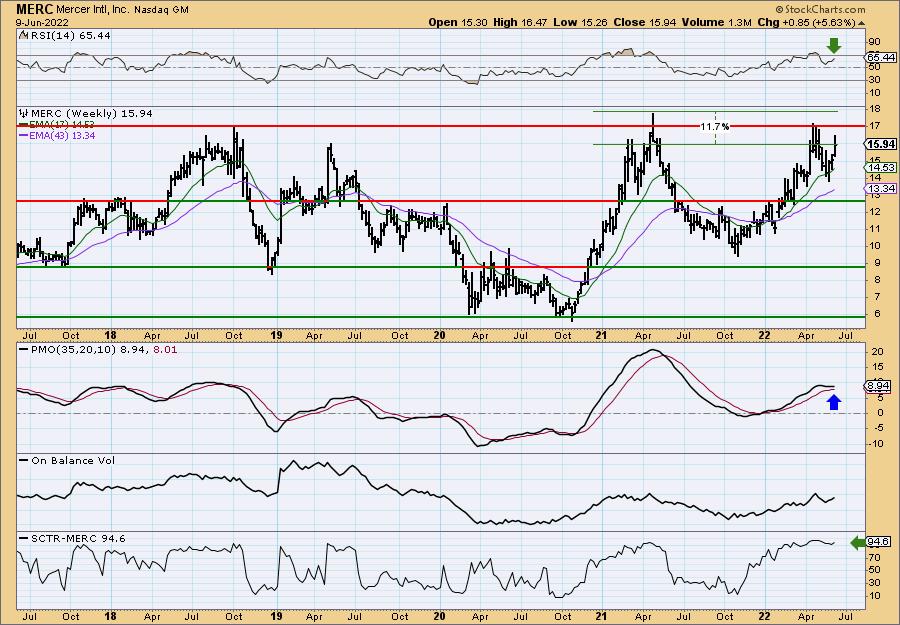
The weekly chart suggests a breakout ahead. The weekly RSI is rising and positive. The weekly PMO is decelerating and could turn up above the signal line soon. The SCTR is very healthy.
ProShares Ultra Gold (UGL)
EARNINGS: N/A
UGL provides 2x the daily performance of gold, as measured by the price of COMEX gold futures contracts. For more information click HERE.
Predefined Scans Triggered: Parabolic SAR Sell Signals.
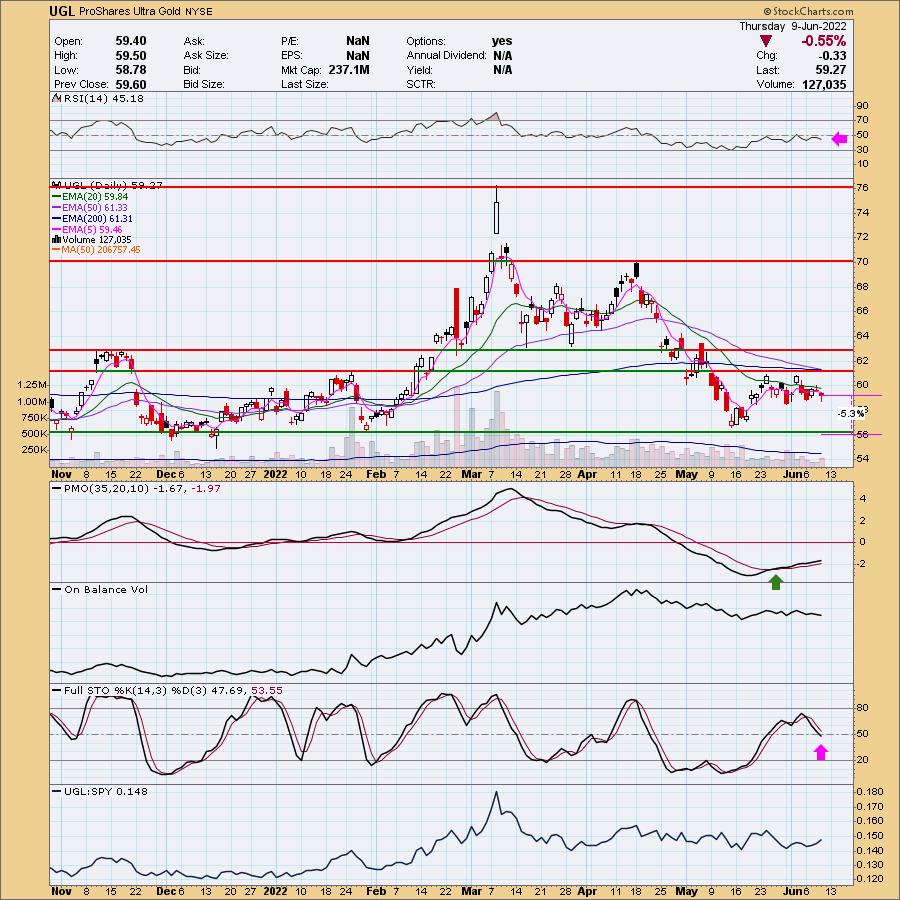
UGL is down -0.44% in after hours trading. While I am bullish on Gold, I need to see a breakout before getting involved so I would caution you on using this "juiced" ETF. If you are interested in investing in Gold, Carl and I use IAU. It is a closed-ended fund that holds actual Gold. It's a "pure play" on Gold and will be less volatile that UGL. There is a toppy looking formation building. Short-term support is holding at the lows for this month. The RSI and Stochastics are not healthy yet. However, the PMO has been holding its BUY signal for a few weeks. I would like this on the breakout, but I'm not a fan of going "ultra" right now. The stop is fairly thin if you want to give it a try.
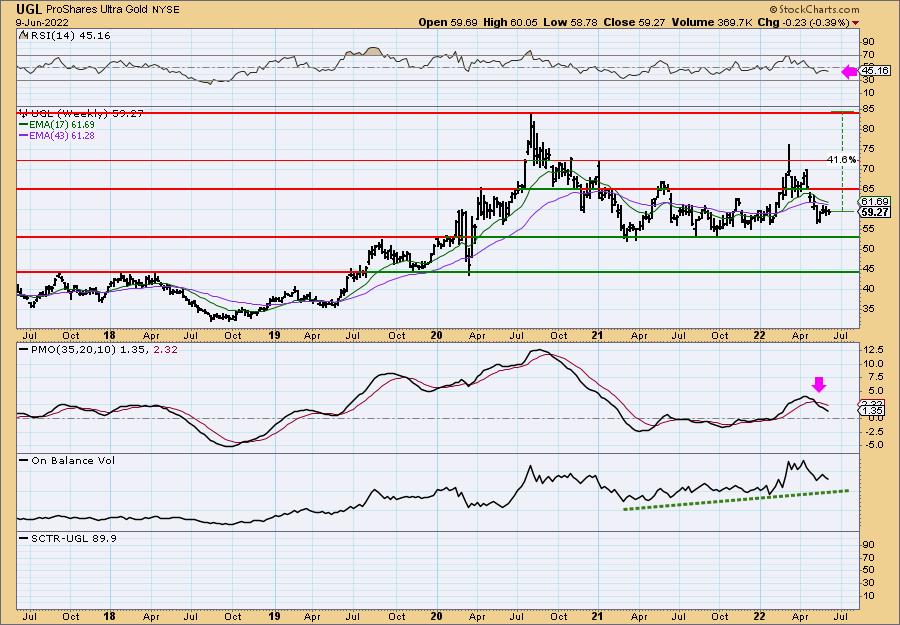
The weekly RSI has turned down in negative territory and the weekly PMO is falling on a SELL signal. On the bright side it appears that the OBV is confirming the longer-term rising trend. I do believe Gold will reach its prior all-time highs eventually. If it does, this ETF will gain over 40%.
Zoom Video Communications, Inc. (ZM)
EARNINGS: 8/22/2022 (AMC)
Zoom Video Communications, Inc. engages in the provision of video-first communications platform. The firm offers meetings, chat, rooms and workspaces, phone systems, video webinars, marketplace, and developer platform products. It serves the education, finance, government, and healthcare industries. Its platform helps people to connect through voice, chat, content sharing, and face-to-face video experiences. The company was founded by Eric S. Yuan in 2011 and is headquartered in San Jose, CA.
Predefined Scans Triggered: P&F Ascending Triple Top Breakout and P&F Double Top Breakout.
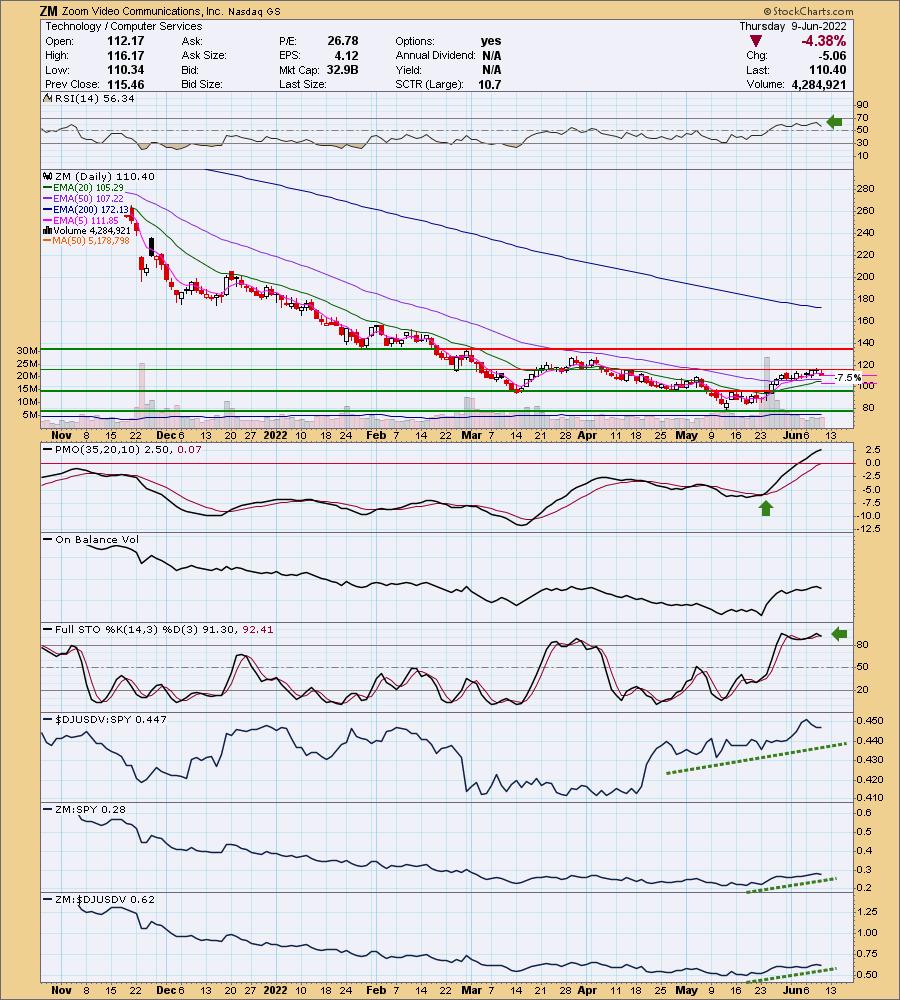
ZM is down -0.61% in after hours trading. I covered this one six times in 2020. If you click HERE, it will take you to the most recent was the December 18th 2020 Diamonds Report. Within the writeup on ZM you'll find links to the other five times. As you might imagine, all of the positions are closed as ZM was completely beaten down even before the bear market began.
If you'd asked me about this one two days ago I might have been on board. However, with the market breaking down, I would avoid Technology and this one is beat down. It had a terrible day, but like the two the "Diamonds in the Rough" above, the indicators didn't see too much damage. The RSI remains positive and the PMO is still rising after moving above the zero line for the first time in months. Stochastics ticked down slightly but are comfortably above 80. Relative strength of the group is pretty good in the longer term and ZM is seeing some improvement in performance, just not enough for me to be on board with this stock. The stop is set under the 20-day EMA.
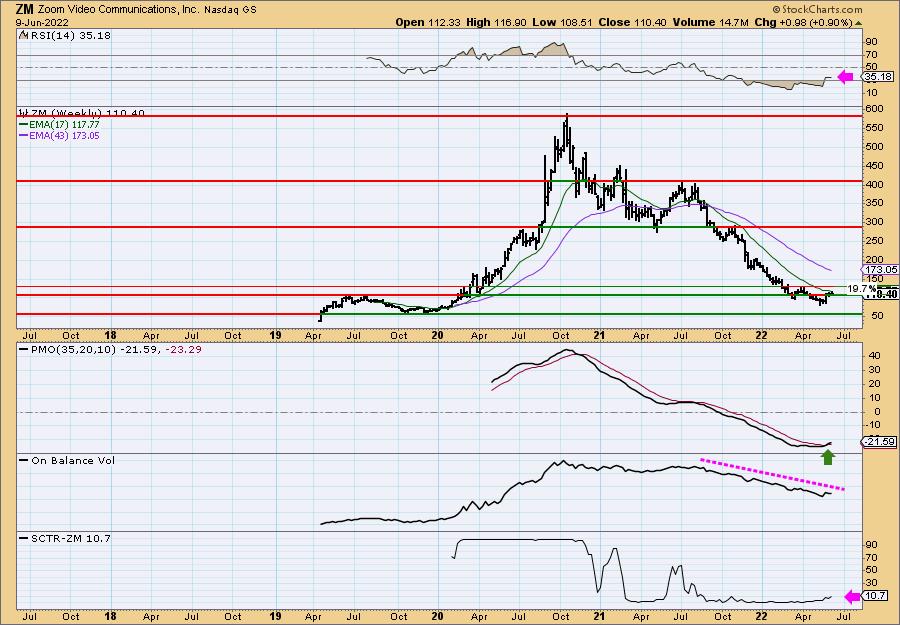
The weekly chart is showing some improvement, but the RSI is very negative and the OBV is still in a steep declining trend. The PMO did just trigger a BUY signal (although it won't go "final" until Friday's close). The SCTR is seeing some improvement but remains at a very negative 10.7%. If we do get a rally to near-term resistance, that would be an almost 20% gain. It's an awful lot of risk to take on though.
Don't forget, on Thursdays I look at reader-requested symbols, click HERE to send me an email. I read every email I receive and try to answer them all!
Current Market Outlook:
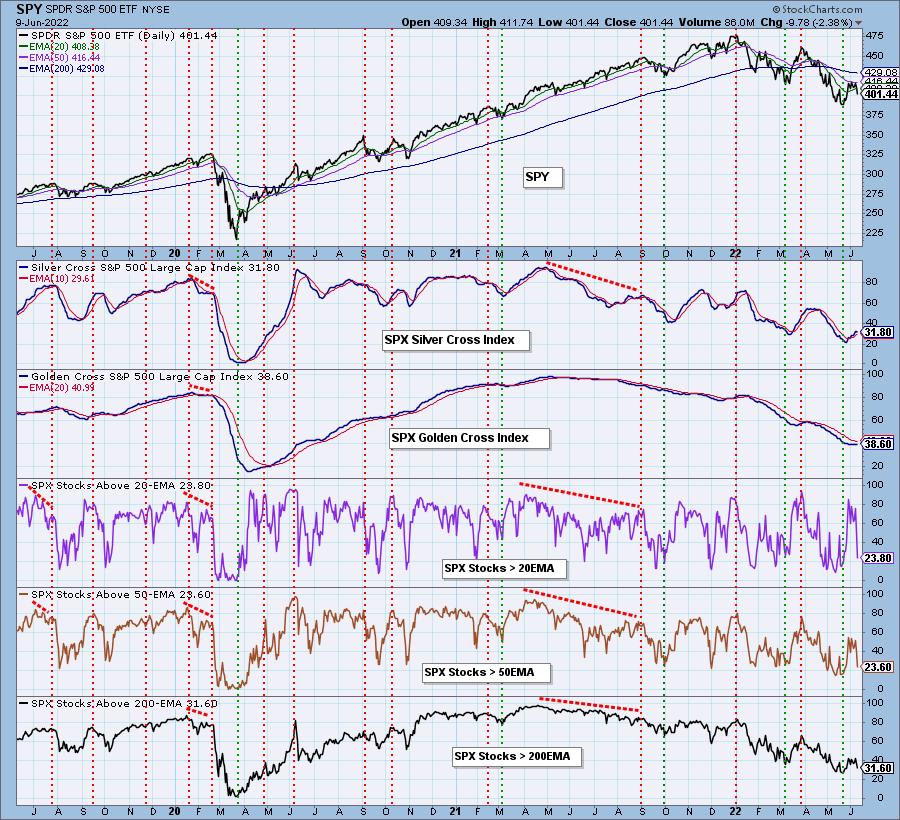
Market Environment: It is important to consider the odds for success by assessing the market tides. The following chart uses different methodologies for objectively showing the depth and trend of participation for intermediate- and long-term time frames.
- The Silver Cross Index (SCI) shows the percentage of SPX stocks on IT Trend Model BUY signals (20-EMA > 50-EMA)
- The Golden Cross Index (GCI) shows the percentage of SPX stocks on LT Trend Model BUY signals (50-EMA > 200-EMA)
Don't forget that as a "Diamonds" member, you have access to our GCI/SCI curated ChartList on DecisionPoint.com. You'll find it under "Members Only" links on the left side on the Blogs and Links Page.
Here is the current chart:
Full Disclosure: I'm 35% exposed with 65% in cash. I made no purchases today, but I am planning to add to my Gold position using IAU on a breakout.
I'm required to disclose if I currently own a stock I mention and/or may buy/short it within the next 72 hours.
"Technical Analysis is a windsock, not a crystal ball." - Carl Swenlin
(c) Copyright 2022 DecisionPoint.com
Watch the latest episode of DecisionPoint with Carl & Erin Swenlin on Mondays 7:00p EST or on the DecisionPoint playlist on the StockCharts TV YouTube channel here!
NOTE: The stocks reported herein are from mechanical trading model scans that are based upon moving average relationships, momentum and volume. DecisionPoint analysis is then applied to get five selections from the scans. The selections given should prompt readers to do a chart review using their own analysis process. This letter is not a call for a specific action to buy, sell or short any of the stocks provided. There are NO sure things or guaranteed returns on the daily selection of "Diamonds in the Rough."
Helpful DecisionPoint Links:
DecisionPoint Shared ChartList and DecisionPoint Chart Gallery
Price Momentum Oscillator (PMO)
Swenlin Trading Oscillators (STO-B and STO-V)
For more links, go to DecisionPoint.com