
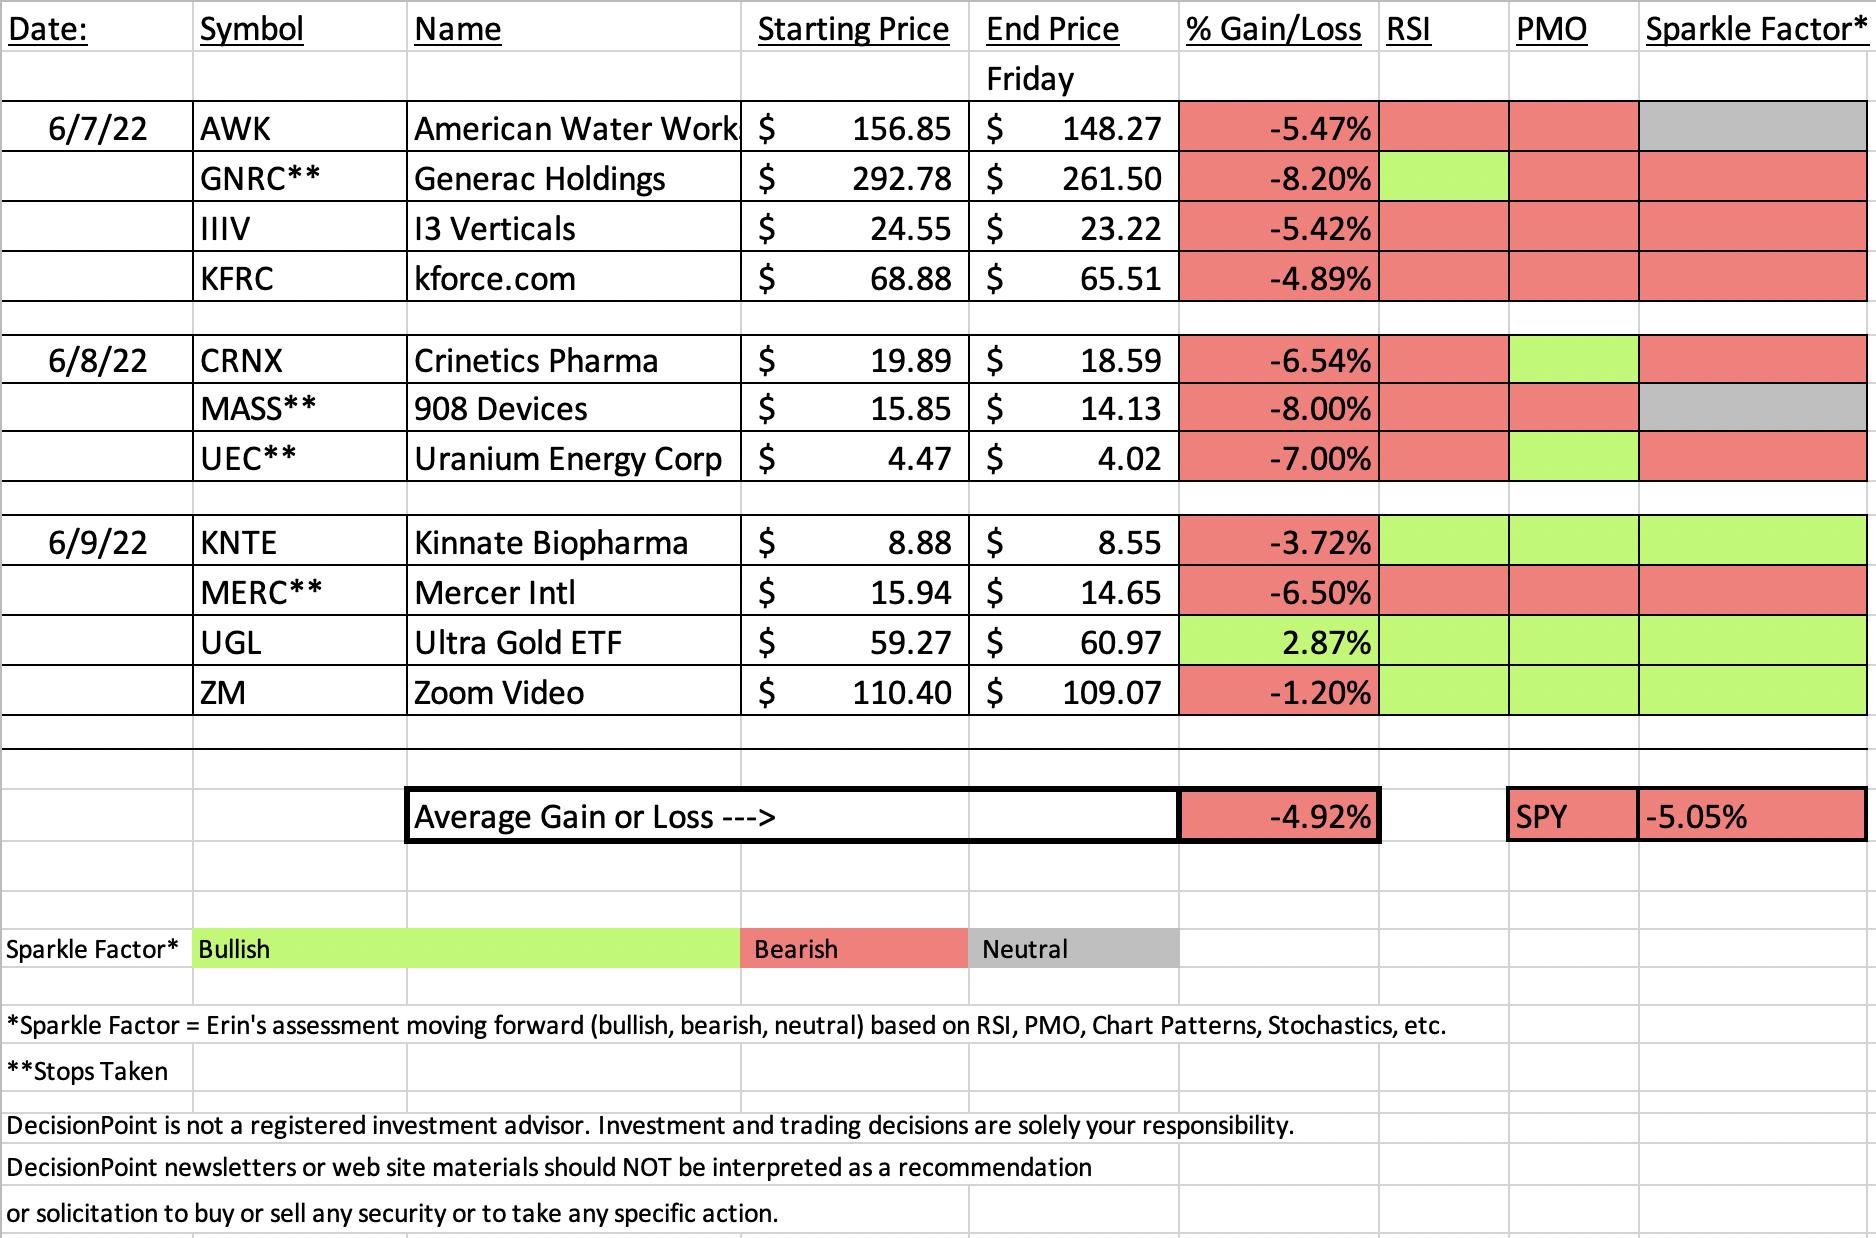
This week's "Diamonds in the Rough" proved to us the importance of stops. This week we took an unprecedented FOUR stops. We outperformed the SPY by 0.13% because of them. Had we not had these stops the average loss on the week would have been almost -6%. Instead the average loss was -4.92%. It is a little over a percentage point savings--worth it.
A few notes about the spreadsheet today. You may find it interesting that two of the stocks we took stops on are listed with "Neutral" Sparkle Factors. AWK had a terrible week, but it is sitting in Utilities (a defensive sector) and deserves a spot on your watch list. It is nearing strong support and I believe has the ability to reverse off that level.
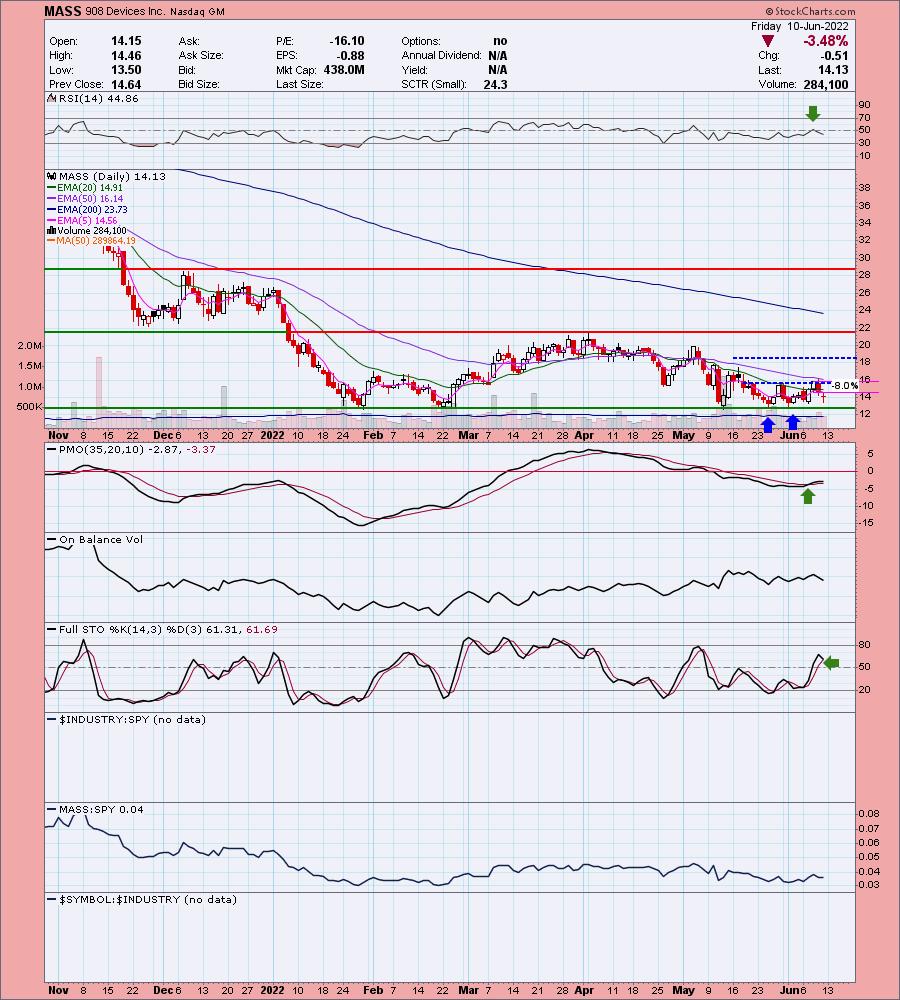
MASS also is listed as neutral. The decline is taking it to strong support. That support level is another 8% lower, so this is watch list material. If it holds support, it could make a profitable trip up to the top of the trading range.
UEC is Uranium Energy Corp. Uranium should be a strong area for investment given the push toward green (non-fossil fuel) energy. It is nearing support and is watch list material as it could take some time for it to take off.
The "Dud" of the week is Generac (GNRC). We took the stop and it was a deep 8.2% versus the other three stops. If go purely by loss for the week, 908 Devices (MASS) was down 10.85% and GNRC was down 10.68%. I'm choosing to show you MASS especially since I listed it with a "neutral" Sparkle Factor.
The "Darling" of the week was the Ultra (2x bull) Gold ETF (UGL). I'm a big fan of Gold right now, but I will reiterate that volatility is killer when working with "juiced" ETFs, so prepare yourself. My choice of investment in Gold is IAU. It is a physical Gold trust, meaning they own actual Gold. It's a pure play on the metal and I will be using it as I expand my exposure Monday.
See you in Monday's free trading room! Next Diamonds report will be on Tuesday, June 14th.
Erin

RECORDING LINK (6/10/2022):
Topic: DecisionPoint Diamond Mine (6/10/2022) LIVE Trading Room
Start Time: Jun 10, 2022 09:00 AM
Meeting Recording Link
Access Passcode: June$10th
REGISTRATION FOR Friday 6/17 Diamond Mine:
When: Jun 17, 2022 09:00 AM Pacific Time (US and Canada)
Topic: DecisionPoint Diamond Mine (6/17/2022) LIVE Trading Room
Register in advance for this webinar HERE
Save the registration confirmation email with login instructions in case Zoom doesn't notify you in time.

Free DP Trading Room (6/6/2022) RECORDING LINK:
Topic: DecisionPoint Trading Room
Start Time: Jun 6, 2022 09:00 AM
Meeting Recording Link
Access Passcode: June@6th
For best results, copy and paste the access code to avoid typos.
A few items about the spreadsheet: I've put on the spreadsheet whether the RSI is positive (green) or negative (red). The PMO column tells you if it is rising (green) or falling (red). Finally I've added my own "Sparkle Factor" that gives you my assessment going forward, bullish (green), bearish (red) or neutral (gray). The Sparkle Factor is basically my thoughts on whether I expect it to rise or fall. A neutral means it could really go either way so it could be added to a watch list. If you're in a stock I consider "neutral" going forward, the ball is in your court.
Darling:
ProShares Ultra Gold (UGL)
EARNINGS: N/A
UGL provides 2x the daily performance of gold, as measured by the price of COMEX gold futures contracts. For more information click HERE.
Predefined Scans Triggered: Parabolic SAR Sell Signals.
Below are the commentary and chart from yesterday (6/9):
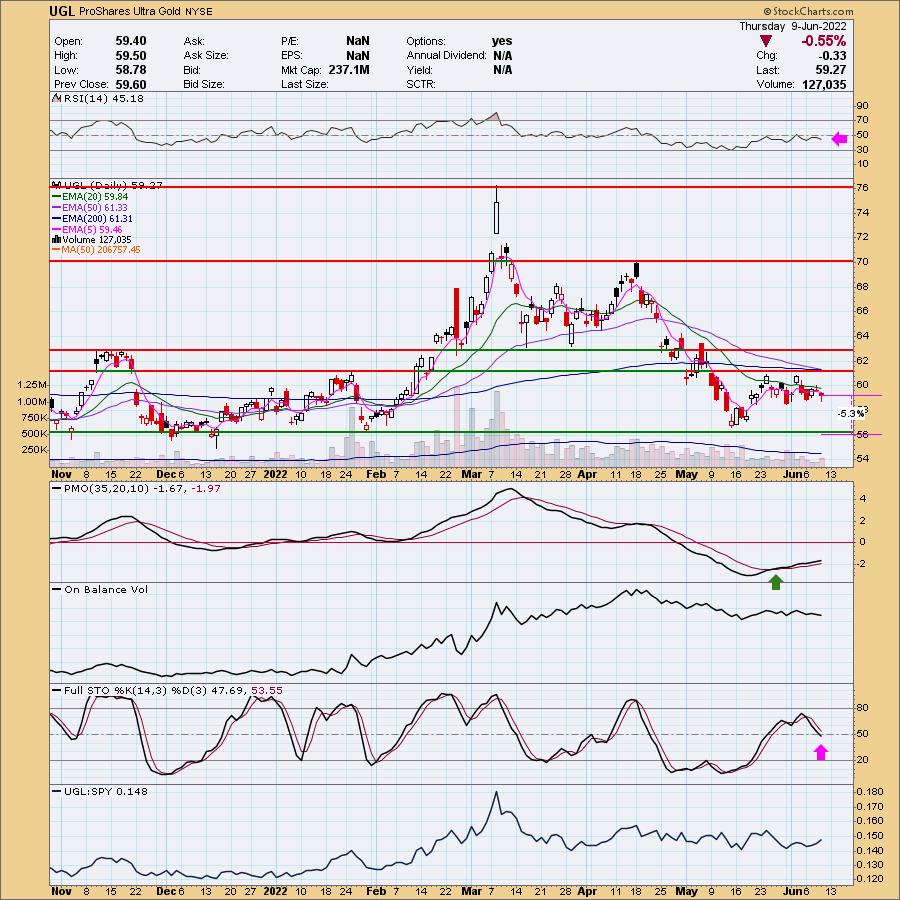
"UGL is down -0.44% in after hours trading. While I am bullish on Gold, I need to see a breakout before getting involved so I would caution you on using this "juiced" ETF. If you are interested in investing in Gold, Carl and I use IAU. It is a closed-ended fund that holds actual Gold. It's a "pure play" on Gold and will be less volatile that UGL. There is a toppy looking formation building. Short-term support is holding at the lows for this month. The RSI and Stochastics are not healthy yet. However, the PMO has been holding its BUY signal for a few weeks. I would like this on the breakout, but I'm not a fan of going "ultra" right now. The stop is fairly thin if you want to give it a try."
Here is today's chart:
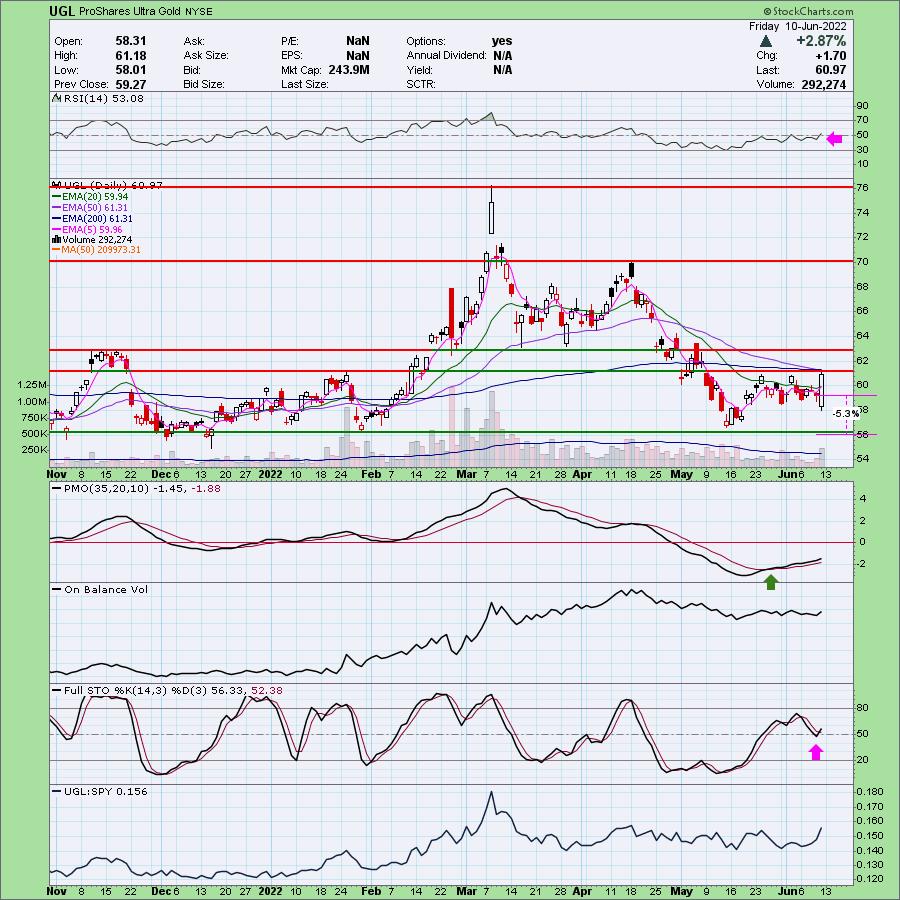
I was a little "wishy washy" on my write up yesterday. Partly because it is a juiced ETF and partly because I wanted to see confirmation of my longer-term bullish stance with a breakout. Instead of a breakout, we saw Gold move higher even as the Dollar rose. Not only did this positive correlation occur today, Gold was up nearly a half percent higher than the Dollar. This is not a breakout, but it is the confirmation I need to buy on Monday. Hoping for a natural pullback after the powerful move. If you have a taste for some risk, this juiced ETF should serve you well, but if it doesn't...it won't be pretty.
Don't forget, on Thursdays I look at reader-requested symbols, so shoot me an email at erin@decisionpoint.com. I read every email I receive and try to answer them all!
Dud:
908 Devices Inc. (MASS)
EARNINGS: 8/4/2022 (BMO)
908 Devices, Inc. engages in the development of measurement devices for chemical and biochemical analysis. It offers products using mass spectrometry technology, an analytical technique for measuring the mass of charged molecules that is used in chemical analysis laboratories for applications, such as safety and security, food science, biotechnology, clinical diagnostics, and controlling industrial processes. Its products include desktops and handhelds. The company was founded by Kevin J. Knopp, Miller Scott, Steve Araiza, Andrew Bartfay, Michael Jobin, Christopher D. Brown, and Christopher J. Petty in 2012 and is headquartered in Boston, MA.
Predefined Scans Triggered: P&F Double Top Breakout.
Below are the commentary and chart from Wednesday (6/8):
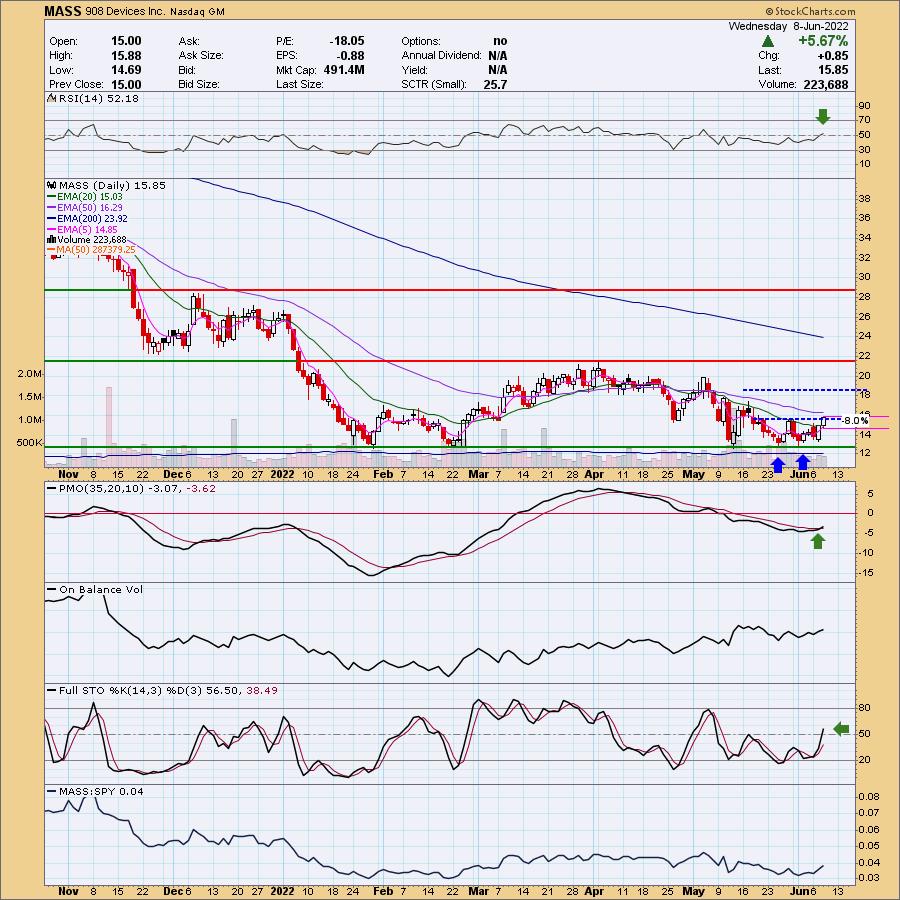
"MASS is unchanged in after hours trading. I know playing reversals is risky right now, but as I said, pickin's were slim. This one is incredibly beat down, but it is rebounding off support and has formed a double-bottom. This was actually a bearish ascending triangle but today's breakout from the short-term declining trend busted that pattern. Price is back above the 20-day EMA. The minimum upside target of the double-bottom is just above $18. The RSI just moved into positive territory and the PMO triggered a crossover BUY signal today. Stochastics just moved into positive territory. Relative strength isn't anything great, but at least it is even and not in decline. It's not listed as part of a sector or industry group, but based on the description of the company, it is a healthcare stock and provides medical devices/equipment. The group isn't doing that well and XLV is doing okay so keep that in mind. The stop was difficult to set due to today's giant rally. I set it below the April low."
Here is today's chart:
It was a big pullback after the rallies on Monday and Tuesday that I did foresee to some degree based on my original comments. I kept this one in "neutral" category because strong support is nearing. Clearly the indicators aren't in tune with a bounce here. Note that it would be another 8% down leg before that support is hit. I do like this one for a watch list because a bounce would be very lucrative.
THIS WEEK's Sector Performance:

DecisionPoint Sector Scoreboard (Mechanical Trend Model Signals):

Click Here to view Carl's annotated Sector ChartList!
RRG® Daily Chart ($ONE Benchmark):
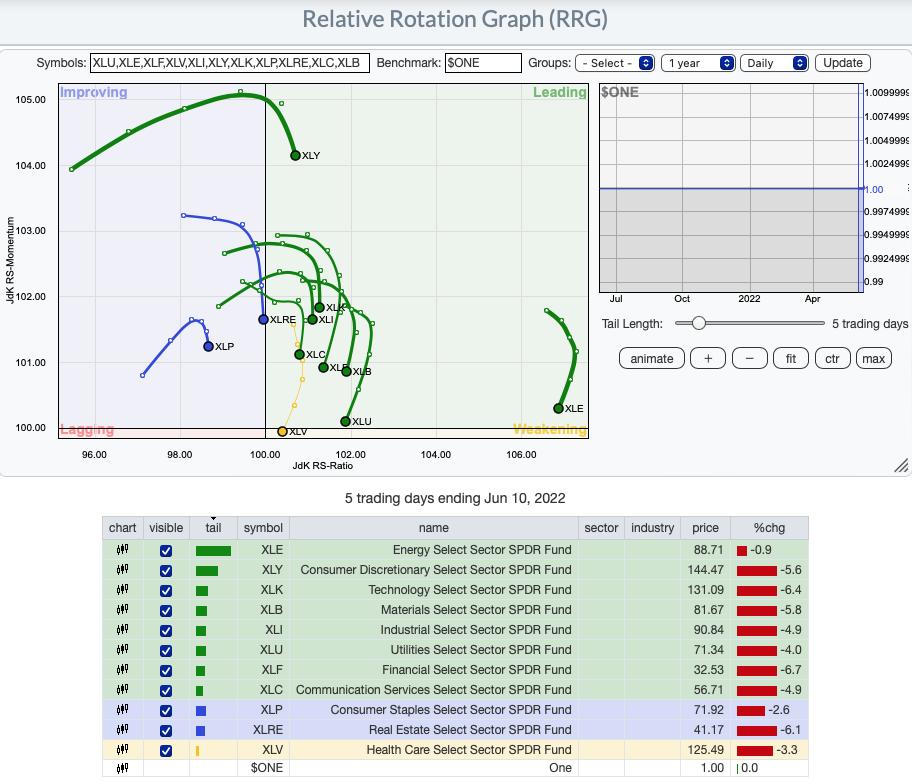
We haven't had to go into gory detail on what each sector is up to because they have all been in deterioration mode. XLV reached the Weakening quadrant today. XLU and XLE aren't far behind.
None of the sectors have bullish northeast headings. There are plenty with bearish southwest headings: XLC, XLI, XLK, XLP, XLB, XLU and XLE.The remainder, XLY, XLP and XLRE still have a bearish southward component to their headings. It's not a pretty short-term picture.
RRG® Weekly Chart ($ONE Benchmark):
The weekly RRG hasn't changed so last week's comments are valid. The bear market is clearly in force:
"The weekly RRG shows all sectors with bearish southwest headings with the exception of XLE which is directionless. We have short-term bullishness (daily RRG), but intermediate-term weakness (weekly RRG)."
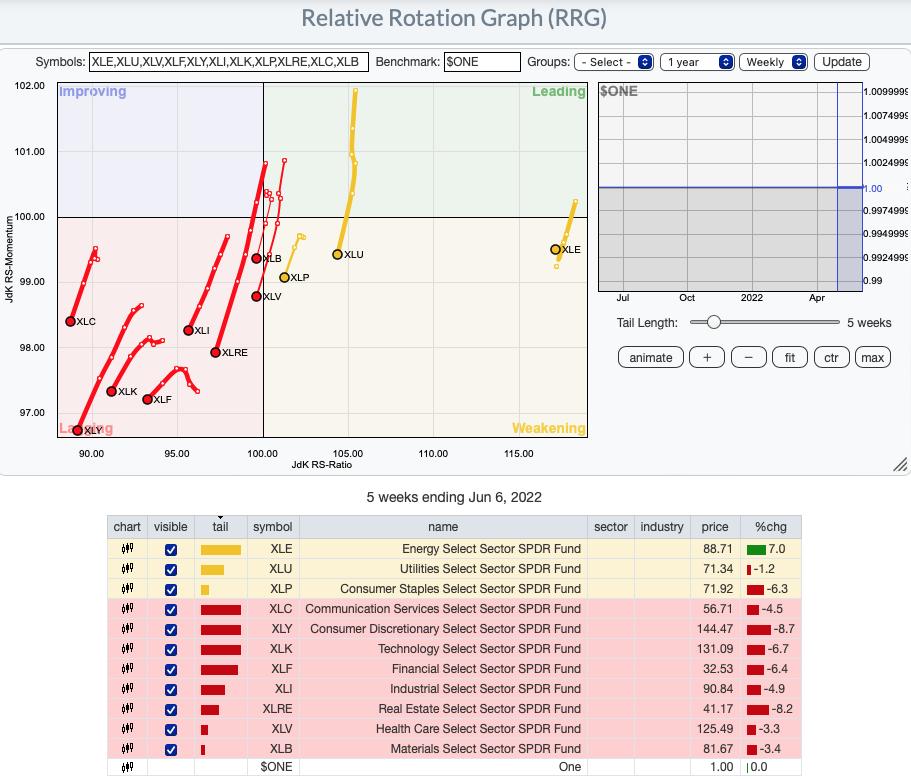
RRG® charts show you the relative strength and momentum for a group of stocks. Stocks with strong relative strength and momentum appear in the green Leading quadrant. As relative momentum fades, they typically move into the yellow Weakening quadrant. If relative strength then fades, they move into the red Lagging quadrant. Finally, when momentum starts to pick up again, they shift into the blue Improving quadrant.
CLICK HERE for an animated version of the RRG charts.
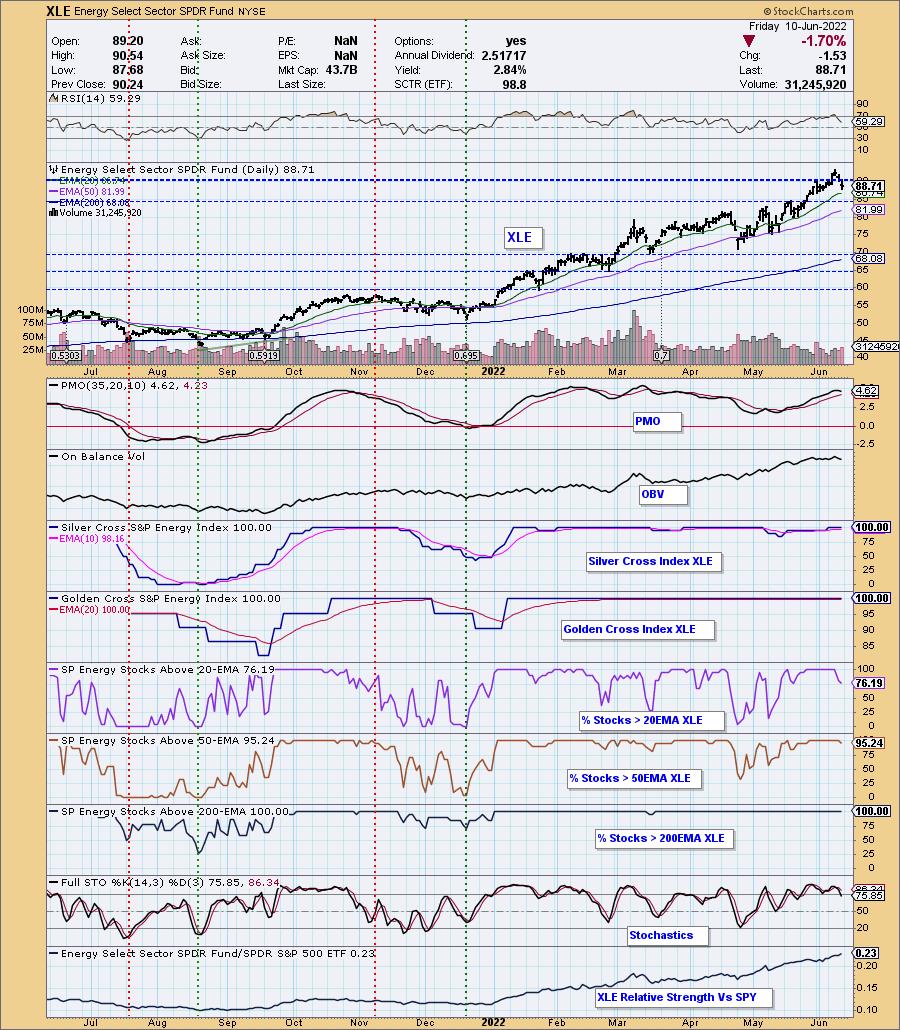
Sector to Watch: Energy (XLE)
Based on the technicals there really was no other choice but Energy.
I toyed with Healthcare (XLV) which is on support and is showing relative strength, but participation is so low and the PMO SELL signal well below the zero line just had me shaking my head.
Materials was a possible given the Industry Group to Watch is Gold Miners, but it is no where near support and appears in free fall. It's underperforming an already weak SPY.
I almost present Consumer Staples (XLP). It is really improving on relative strength, but the PMO topped beneath its signal line BELOW the zero line. That about as negative as you can get. Additionally, participation is weak.
Energy did pullback at the end of the week as it got caught up in the tsunami market breakdown. Support is near. Participation has deteriorated somewhat, but overall it is still strong. I'm partial to the Exploration & Production industry group within, but all look good other than Coal.
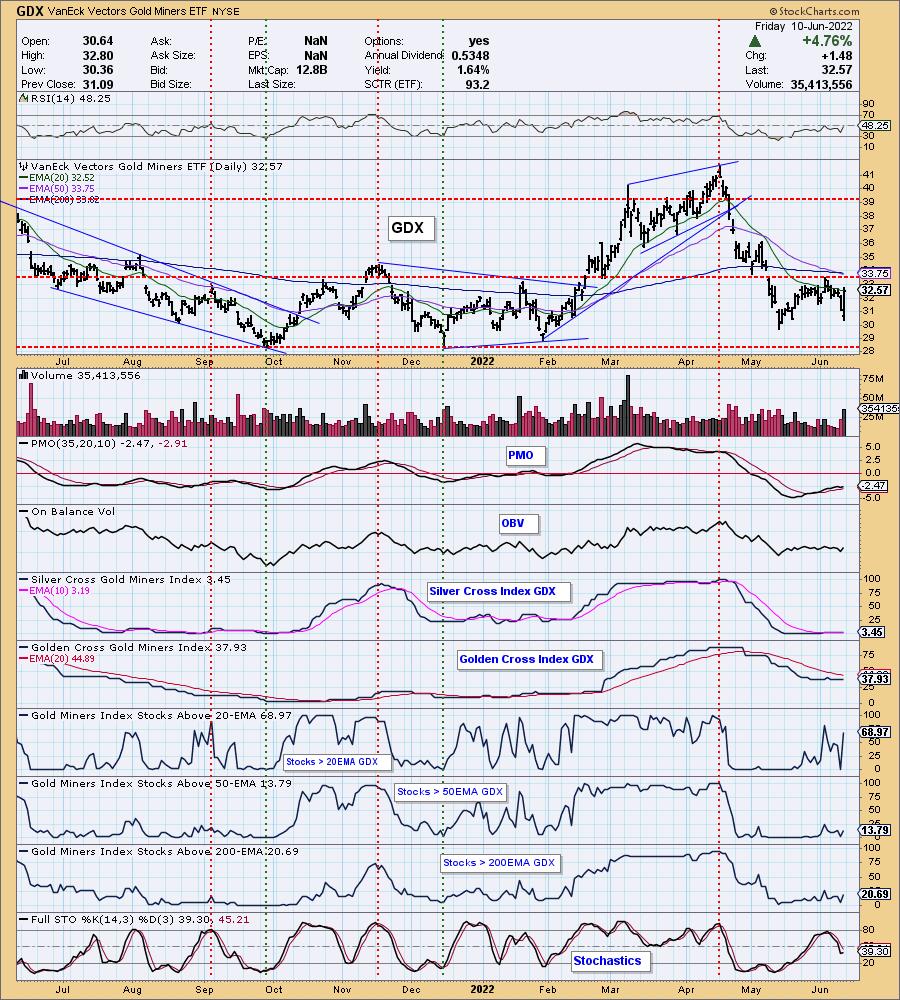
Industry Group to Watch: Gold Miners (GDX)
We're fortunate that we do have "under the hood" indicators for Gold Miners so I'm taking advantage. This is a chart we go over daily in the DP Alert. I've been expressing my dislike for GDX since the breakout above the 20-day EMA failed and the group received a "death cross" of the 50/200-day EMAs. The RSI is nearing positive territory. The PMO has turned back up. %Stocks > 20-day EMA spiked today. We even saw a few more stocks overcome the 50/200-day EMAs. The short-term bias on Gold Miners is very bullish. There was only one real choice among the group and that was Franco-Nevada (FNV). Certainly some of the others look good, but we know this is a solid very high volume stock in this space. I like RGLD and GOLD as well, but FNV has the best technicals overall.
Go to our Sector ChartList on DecisionPoint.com to get an in-depth view of all the sectors.
Good Luck & Good Trading!
- Erin
erin@decisionpoint.com
Full Disclosure: I'm 30% exposed.
Watch the latest episode of DecisionPoint with Carl & Erin Swenlin on Mondays 7:00p EST or on the DecisionPoint playlist on the StockCharts TV YouTube channel here!
Technical Analysis is a windsock, not a crystal ball. --Carl Swenlin
NOTE: The stocks reported herein are from mechanical trading model scans that are based upon moving average relationships, momentum and volume. DecisionPoint analysis is then applied to get five selections from the scans. The selections given should prompt readers to do a chart review using their own analysis process. This letter is not a call for a specific action to buy, sell or short any of the stocks provided. There are NO sure things or guaranteed returns on the daily selection of "diamonds in the rough."
Helpful DecisionPoint Links:
DecisionPoint Shared ChartList and DecisionPoint Chart Gallery
Price Momentum Oscillator (PMO)
Swenlin Trading Oscillators (STO-B and STO-V)
(c) Copyright 2022 DecisionPoint.com